 8-Plex
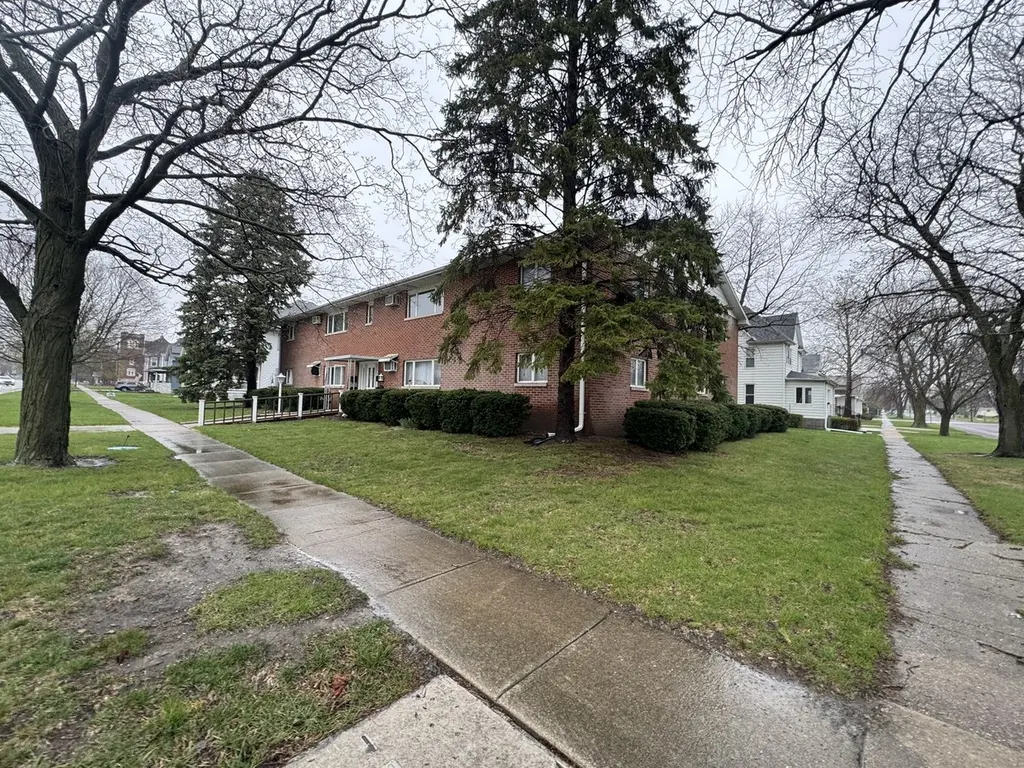
210 E 9th St · Gibson City, IL
Flood risk 1/10 · Minimal
- FEMA flood zone
- X (unshaded)
- Chance of flooding over 30 yrs
- 0.0%
- Est. flood insurance / yr
- $507 – $1,088
Fire risk 1/10 · Minimal
- Est. fire insurance / yr
- $804 – $1,492
Heat risk 3/10 · Minor
- Hot days now (above 104°F)
- 7 days/yr
- Hot days in 30 yrs
- 18 days/yr
Wind risk 2/10 · Minimal
- Chance of severe wind over 30 yrs
- 1.0%
Air-quality risk 2/10 · Minimal
- Unhealthy air days now
- 1 days/yr
- Unhealthy air days in 30 yrs
- 1 days/yr
Risk factors via First Street. Map © Google.
Why this score? — see what drove the D+ grade
The composite is a weighted blend of 9 inputs, each scored 0–100. Each bar is that input's sub-score; the figure is the points it added to the 100-point composite (weight × sub-score).
- Cash flow +20.1/30.0
- ARV discount +7.5/15.0
- DSCR +6.4/10.0
- 1% rule +5.3/10.0
- Livability +3.2/5.0
- Schools +2.7/10.0
- Rent growth +2.5/5.0
- Condition / age +2.2/5.0
- Appreciation +0.0/10.0
$625,000
🖨 Deal sheet 📄 Offer letter ✓ Due diligence
Multi-family units
County records classify this as Multi-Family (5+ Unit). Listing-text estimate: 8 units. confirmed
5+ unit building — per-unit beds/baths from public records are typically unavailable; the breakdown below (if shown) is an estimate from the listing text.
Listing remarks
10 Units total, The main building is an 8 unit, 2 story apartment building with a partial basement. This building has 8, 2 bedroom apartments. Each have an open floor plan with 1 full bathroom. There is coin laundry available for the tenants in the main hallway. The 2nd building is a 2 unit converted house located behind the main building. The buildings are in good repair, vacancy has been minimal. It has provided year to good income for the owners.
Key facts
- 0.37 acre lot
- Built 1975
- Listed 5 days
Property features AI
Finance
- Other: Parcel number available in records
- Financial info: Total of 10 units; Building generates approximately $3,800 monthly ($45,640 gross annually); Monthly income per unit type: 8 units (2-bed) roughly $450–$550; 2 units (1-bed) roughly $390–$450; Gross rent multiplier approximately 13.7; Reported annual expenses include electric, trash, and insurance
Exterior
- Parking: Outdoor parking with room for 6–12 vehicles
- Utilities: Municipal water; Circuit breaker electrical service; Separate electric meters
- Home design: Multi-family building (5+ units); Individual ownership; Not a conversion
- Construction: Built before 1978; Hip roof with fiberglass material; Brick construction
- Exterior features: Lot dimensions approximately 100 x 160; Zoned for multi-family; Brick exterior
Interior
- Kitchen: Multiple ranges in building (10 total)
- Bedrooms: Eight units total: most units are 2-bedroom and 1-bedroom layouts (see unit breakdown)
- Bathrooms: Units include full bathrooms
- Heating & cooling: Electric heating with baseboard; Separate heating per unit; Wall sleeve and window air-conditioning units
- Interior features: Basement with storage space; Month-to-month tenancy
- Laundry & utility: Separate electric meters for units
Neighborhood map
What this means for you Summary
Snapshot
- This is a 8 × 2-bed/?-bath units multifamily listed at $625k. Condition is rated fair.
Deal economics
- At list price, monthly cash flow is $776 ($9k/yr) — positive. Per door: $97/mo.
- The deal already cash-flows at list — no discount required.
- Meets the 1% rule at list price ($6k rent vs $625k).
Location & tenants
- Location reads 63/100 on livability (#777 in IL) — a middle-class / working-renter tenant base. Strengths: cost of living A+, crime A-, housing A-; Watch: schools D, amenities F, commute F.
- Gibson City-Melvin-Sibley CUSD 5 (town): math 26% / reading 36% proficiency, ranked #242 of 620 in IL (top 39%) — families likely to look elsewhere, expect single-tenant / working-renter base with shorter leases.
- Market conditions: 17 active listings in the ZIP; 10 units permitted in Ford County in 2024 (0 in 5+ unit buildings).
Forward outlook
- Local home prices are declining (-3.0%/yr); year-one equity from $4k of loan paydown is wiped out by about $19k of value loss. Plan a longer hold.
- Ford County population projected at -17% by 2050 — secular population decline; favor cash flow + early exit over multi-decade hold.
Negotiation context
- Only 5 days on market — expect competitive offers; lowballing is unlikely to land.
Questions for the listing agent
- Can we see the unit-by-unit rent roll, current vacancy, and any below-market leases? What's the average tenancy length?
- What capital expenditures (roof, boiler, parking lot, exteriors) have been made in the last 5 years, and what's planned in the next 2?
- Have any recent inspections been done? Can we get a copy of the seller's disclosures and any deferred-maintenance estimates?
- Built in 1975 — when were the roof, HVAC, electrical panel, plumbing, and water heater last replaced?
- Is there a deadline driving the sale (1031 exchange, divorce, estate, relocation)? That informs how much negotiation room exists.
- Schools are D-rated, which usually means shorter tenancies and higher turnover. Who's the typical renter profile here, and what's been the actual vacancy rate?
- The area grade is low — what's the realistic commute time and amenity access for the typical tenant pool here? Any planned neighborhood developments (good or bad) we should know about?
- What's the average days-on-market for RENTAL listings here right now (not sales)? A rising rental-DOM trend means longer vacancies and softer asking-rent achievability than the comps imply.
- What's the recent tenant-quality profile in this submarket — average credit score on applications, eviction rate, late-payment / NSF rate, and stable-employment percentage? A property-management company in the area should have these aggregated.
- How much new apartment / multifamily construction is in the pipeline within 1–3 miles? Heavy new supply (>2% of stock underway) typically softens rents 12–24 months out; light construction supports rent growth.
Investment metrics
- 1% rule
- 1.03% ✓
- Cap rate
- 7.78%
- Cash-on-cash
- 5.32%
- DSCR
- 1.24
- GRM
- 8.1
CMA / ARV
No comps found within radius.
Projected returns pro-forma
-3.0% appreciation · 3.0% rent growth · sell at horizon
- IRR
- -8.0%
- Equity multiple
- 0.70×
- Total profit
- $-51,739
- Equity at exit
- $93,190
- IRR
- 1.5%
- Equity multiple
- 1.11×
- Total profit
- $19,005
- Equity at exit
- $54,039
Cash invested: $175,000 (down + closing). Projections, not guarantees.
Landlord ↔ Tenant lean methodology
- Overall (STATE)
- 43 Moderately Tenant-Leaning
- State Illinois
- 43 Moderately Tenant-Leaning · D+7
- County
- — inherits STATE
- City
- — inherits STATE
ZIP-level market 60936
- Home prices YoY
- -26.7%
- Active inventory
- 17
- Price-to-rent
- 64.6×
Monthly cashflow live
- Estimated rent
- $6,450 medium interval (Pro) →
- Mortgage (P&I)
- −$3,278
- Tax est. 1.5%
- −$781 /mo · $9,375/yr
- Insurance
- −$260
- HOA
- −$0
- Vacancy / Maint / Mgmt
- −$1,354
- Net cashflow
- $776
Break-even live
8-unit breakdown (identical units grouped — click to expand)
| Units | Beds | Baths | Est. rent |
|---|---|---|---|
| 8× units | 2 | — | $6,448 |
| #1 | 2 | — | $806 |
| #2 | 2 | — | $806 |
| #3 | 2 | — | $806 |
| #4 | 2 | — | $806 |
| #5 | 2 | — | $806 |
| #6 | 2 | — | $806 |
| #7 | 2 | — | $806 |
| #8 | 2 | — | $806 |
| Total (8 units) | $6,450 | ||
UW: 25.0% down · 7.5% · 30yr · 1.5% tax · 5.0% vac · 8.0% maint · 8.0% mgmt
Financing live
Cash to close
- Down payment
- $156,250
- Closing costs
- $18,750
- Reserves months
- —
- Total cash needed
- —
Loan-product check · same deal, 3 products live
Conventional
25% down · 7.5% · 30yr
- Down + closing
- —
- Monthly P&I
- —
- Monthly cashflow
- —
- DSCR
- —
- Eligible?
- —
Personal DTI + credit; lowest rate.
DSCR
20% down · 8.5% · 30yr
- Down + closing
- —
- Monthly P&I
- —
- Monthly cashflow
- —
- DSCR
- —
- Eligible?
- —
No personal income docs; deal must DSCR.
Hard money
10% down · 12.0% · 12mo
- Down + closing
- —
- Monthly P&I
- —
- Monthly cashflow
- —
- DSCR
- —
- Eligible?
- —
Short-term bridge; refi at stabilization.
Listing history 1 events
-
2026-05-12status Pending
ⓘ Source: listings_history table (triggers on properties + properties_extension) + one-shot
backfill from property_details.listing_events for pre-trigger history.
Climate risk First Street
- Flood 1/10 Low FEMA zone X (unshaded) · 0% chance over 30 yrs
- Wildfire 1/10 Low
- Heat 3/10 Moderate 7 d/yr ≥104°F today · 18 d/yr by 30 yrs out
- Wind 2/10 Low 100% chance of damaging wind over 30 yrs
- Air quality 2/10 Low 1 unhealthy d/yr today · 1 by 30 yrs out
Nearby sold comps map
Loading sold comps map…
Walkable amenities ~0.75 mi
Loading nearby amenities…
Taxation est. · year 1
- Rental income
- $77,400
- − Mortgage interest
- −$35,010
- − Property taxes
- −$9,375
- − Insurance
- −$3,125
- − Repairs & maintenance
- −$6,192
- − Management
- −$6,192
- − Depreciation
- −$18,182
- Taxable loss
- −$676
- Est. tax savings @ 24.0%
- +$162
- After-tax cash flow
- $9,477/yr
For passive investors: Depreciation is non-cash, so a rental often shows a tax loss while cash-flowing — sheltering income. Rental losses are passive: they offset passive income freely, and up to $25,000/yr can offset ordinary (W-2) income if you actively participate and your MAGI is under $100k (phasing out to $0 by $150k); unused losses carry forward. On sale, claimed depreciation is recaptured at up to 25%, and gains may owe capital-gains tax (a 1031 exchange can defer both). Figures are a year-1 estimate at your 24.0% rate — not tax advice; consult a CPA.
Condition & rehab AI · 13 photos
The property is in fair condition with some repairs and maintenance needed, including replacing the roof and exterior siding, and replacing the carpeted flooring. The property has a moderate level of rehabilitation required to increase its value.
Repairs flagged
- Major Roof — The independent satellite image shows a flat roof with visible wear and tear, indicating potential need for replacement.
- Moderate Exterior siding — The exterior siding appears to be in fair condition, with some discoloration and wear visible.
- Minor Flooring — The carpeted floors appear to be in fair condition, with some discoloration and wear visible.
Value-add opportunities
- Both Replace roof — Replacing the roof will improve the overall condition of the property and increase its resale and rental value.
- Both Paint exterior siding — Painting the exterior siding will improve the curb appeal and increase the property's resale and rental value.
- Both Replace carpeted flooring — Replacing the carpeted flooring with hardwood or tile flooring will improve the overall condition of the property and increase its resale and rental value.
Renovation cost estimate screening
| Repair item | Severity | Est. cost |
|---|---|---|
| Roof · The independent satellite image shows a flat roof with visible wear and tear, indicating potential need for replacement. | Major | $15,000–50,000 |
| Exterior siding · The exterior siding appears to be in fair condition, with some discoloration and wear visible. | Moderate | $3,000–15,000 |
| Flooring · The carpeted floors appear to be in fair condition, with some discoloration and wear visible. | Minor | $500–3,000 |
| Total estimated repair cost · 3 items | $18,500–68,000 |
Value-add ROI direction
- Both Replace roof — Replacing the roof will improve the overall condition of the property and increase its resale and rental value. ↑
- Both Paint exterior siding — Painting the exterior siding will improve the curb appeal and increase the property's resale and rental value. ↑
- Both Replace carpeted flooring — Replacing the carpeted flooring with hardwood or tile flooring will improve the overall condition of the property and increase its resale and rental value. ↑
ⓘ Cost ranges are severity-bucket heuristics (US national rule-of-thumb). Get contractor quotes + a written scope before underwriting a rehab budget.
Schools (NCES district)
- District
- Gibson City-Melvin-Sibley CUSD 5
- NCES district ID
- 1700041
- Math proficiency
- 26% ▼ -14.00%
- Reading proficiency
- 36% ▼ -12.00%
- Median HH income
- $46,998
- Composite
- 26.71/100
- National rank
- #7150
- State rank
- #242 of 620 in IL
Livability — Gibson City
- Score
- 63/100
- State rank
- #777
- US rank
- #15522
Category grades
Schools grade is shown separately in the Schools card above.
Census & demographics
- Census place
- Gibson City, IL
- Population (ZIP)
- 4,260
Population outlook (Ford County) Hauer SSP2
- Today (2025)
- 13,044 people
- By 2030
- 12,607 · -3.4%
- By 2040
- 11,716 · -10.2%
- By 2050
- 10,836 · -16.9%
- By 2075
- 9,328 · -28.5%
- By 2100
- 7,803 · -40.2%
Race, ethnicity, and origin ACS 2023
- Neighborhood character
- Predominantly White (83%)
- Race & ethnicity
- White 83% Hispanic / Latino 9% Two or more races 8% Asian 2% Black 1%
- Hispanic origin (detail)
- Mexican 4%
- Common ancestry
- Lithuanian 4% Scandinavian 3% Romanian 2%
- Foreign-born
- 5% · Canada, Philippines, Guatemala
- Languages at home
- 93% English-only · Spanish 5% Other Asian/Pacific 1% French/Haitian/Cajun 1%
Political lean MEDSL · Ford
- 2024 margin
- Solid R (+47.9) · D 25.1% · R 73.0% · Other 1.9%
- 2008→2024 swing
- -18.9pp toward R · 2008: -29.0pp · 2024: -47.9pp
- All cycles
- 2024: R+47.9 2020: R+47.3 2016: R+48.7 2012: R+42.9 2008: R+29.0
Not yet ingested
- Civics
- —
Market trends
- HPI YoY
- ▼ -65.66%
- Current HPI
- 180.223
- Rent YoY
- —
- Metro
- —
- State GDP YoY
- ▲ 1.59%
- F500 in state
- 60
Industry mix (Fortune 500 HQ in IL)
| Industry | F500 HQs | Revenue |
|---|---|---|
| Insurance | 4 | $201B |
|
||
| Consumer Goods | 4 | $87B |
|
||
| Industrial Machinery | 3 | $64B |
|
||
| Healthcare | 2 | $55B |
|
||
| Retail / Pharmacy | 1 | $148B |
|
||
| Agriculture / Food | 1 | $86B |
|
||
Cash-flow waterfall
monthlySold comps — $/sqft
last 12 mo · ≤1 miLoading sold comps…