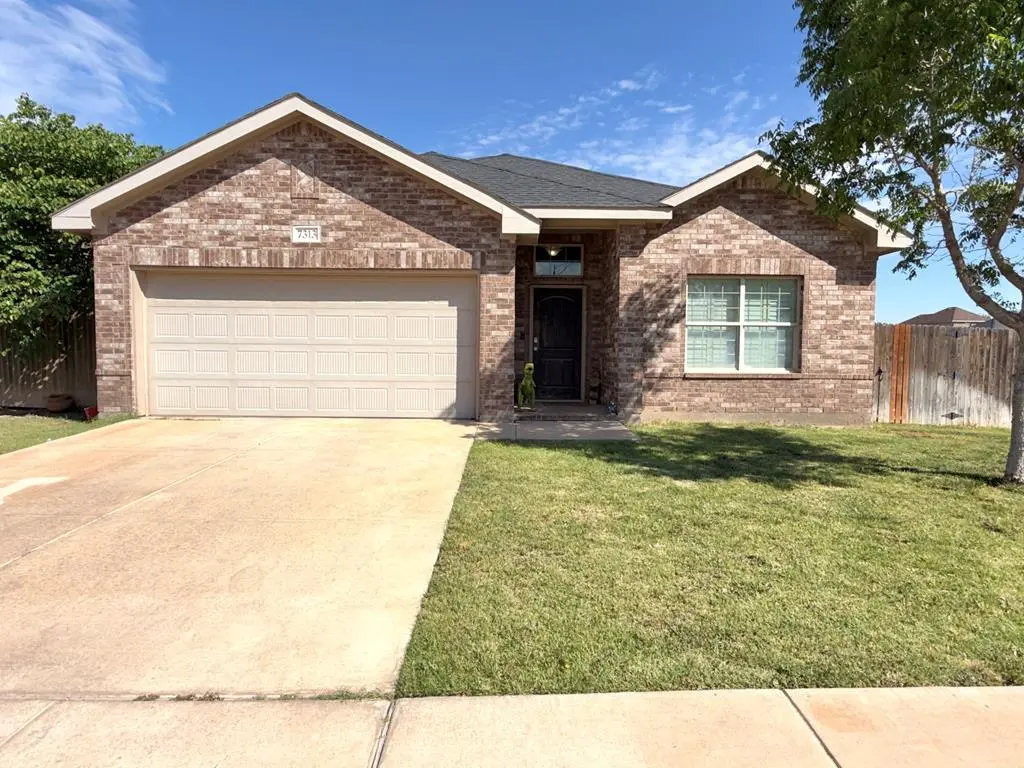
7313 Raphael St · Odessa, TX
Flood risk 1/10 · Minimal
- FEMA flood zone
- X (unshaded)
- Chance of flooding over 30 yrs
- 0.0%
- Est. flood insurance / yr
- $507 – $1,088
Fire risk 7/10 · Major
- Est. fire insurance / yr
- $1,222 – $2,270
Heat risk 6/10 · Moderate
- Hot days now (above 101°F)
- 7 days/yr
- Hot days in 30 yrs
- 23 days/yr
Wind risk 2/10 · Minimal
- Chance of severe wind over 30 yrs
- 3.0%
Air-quality risk 1/10 · Minimal
- Unhealthy air days now
- 0 days/yr
- Unhealthy air days in 30 yrs
- 0 days/yr
Risk factors via First Street. Map © Google.
Why this score? — see what drove the D grade
The composite is a weighted blend of 9 inputs, each scored 0–100. Each bar is that input's sub-score; the figure is the points it added to the 100-point composite (weight × sub-score).
- Cash flow +13.2/30.0
- ARV discount +9.9/15.0
- DSCR +4.0/10.0
- Livability +3.8/5.0
- 1% rule +3.4/10.0
- Rent growth +2.6/5.0
- Condition / age +2.5/5.0
- Schools +2.2/10.0
- Appreciation +0.0/10.0
$320,000
🖨 Deal sheet (PDF) 📄 Offer letter ✓ Due diligence
Listing remarks MLS
Welcome home to this beautiful 3 bedroom 2 bathroom move in ready home! You will love the open concept floor plan and the spacious corner lot. The shutters on the windows throughout the house make this deal even sweeter! Hurry and call your agent today before it's gone!
Key facts
- 6,534 sq ft lot
- Garage
- Built 2013
Neighborhood map
What this means for you Summary
Snapshot
- This is a 3-bed/2.0-bath single-family listed at $320k.
Deal economics
- At list price, monthly cash flow is $-5 ($-60/yr) — negative.
- To cash-flow at today's rent, offer at most $319k (0.3% below list).
- To meet the 1% rule (rent ≥ 1% of price), the offer needs to be $267k (16.5% below list).
- Recommended offer: $267k (16.5% below list) — sets the bar for 1% rule.
Location & tenants
- Location reads 75/100 on livability (#132 in TX, #3,928 nationally) — a middle-class / working-renter tenant base. Strengths: cost of living A+, housing A+, health & safety A+; Watch: commute D+, amenities D.
- Ector County ISD (urban): math 22% / reading 27% proficiency, ranked #707 of 826 in TX (top 86%) — low school quality limits family demand, transient renter base, plan for 1-2y turnover.
- Zoned schools: L B Johnson El (math 26% / reading 27%, grade F, #2,927 of 4,322 statewide, top 68%, 517 students, 67% FRL); Ector College Prep Success Academy (math 18% / reading 24%, grade F, #1,387 of 1,662 statewide, top 85%, 1,384 students, 72% FRL, charter); Permian H S (math 19% / reading 29%, grade F, #1,333 of 1,632 statewide, top 82%, 3,978 students, 51% FRL).
- Market conditions: Rents flat; 433 active listings in the ZIP; 19 comparable units currently listed for rent nearby; rentals lingering (median 46d on market — plan ~5-8 weeks vacancy on turnover, expect pricing pressure); 53% of comp listings sitting > 30 days — soft ceiling on asking rent; solid renter incomes; 1,004 units permitted in Ector County in 2024 (0 in 5+ unit buildings).
- This rent runs 31% of the median local income ($105k/yr) — at the standard rent-burdened threshold; future hikes will face affordability resistance.
Forward outlook
- Local home prices are declining (-3.0%/yr); year-one equity from $2k of loan paydown is wiped out by about $10k of value loss. Plan a longer hold.
- Ector County population projected at +78% by 2050 — long-run rental-demand tailwind backs the buy-and-hold thesis.
Negotiation context
- It's been on market 22 days — a 2% lower offer ($315k) is reasonable based on typical stale-listing flexibility.
- 2 sale attempts since 9y ago; this cycle's ask is 13% above the opening price — seller raised mid-cycle; expect resistance to lowballs.
Risks & watch-outs
- Climate carrying-cost: major wildfire risk; extreme-heat days projected 7→23/yr by 2055 (HVAC capex compounding) — expect insurance premiums to compound above CPI over the hold.
Questions for the listing agent
- What do current leases actually rent for vs. the listed asking? Can we see a recent rent roll and the last 12 months of T-12 income?
- Is there a deadline driving the sale (1031 exchange, divorce, estate, relocation)? That informs how much negotiation room exists.
- Schools are F-rated, which usually means shorter tenancies and higher turnover. Who's the typical renter profile here, and what's been the actual vacancy rate?
- The area grade is low — what's the realistic commute time and amenity access for the typical tenant pool here? Any planned neighborhood developments (good or bad) we should know about?
- What's the average days-on-market for RENTAL listings here right now (not sales)? A rising rental-DOM trend means longer vacancies and softer asking-rent achievability than the comps imply.
- What's the recent tenant-quality profile in this submarket — average credit score on applications, eviction rate, late-payment / NSF rate, and stable-employment percentage? A property-management company in the area should have these aggregated.
- How much new for-sale + rental construction is in the pipeline within 1–3 miles? Heavy new supply typically softens prices + rents 12–24 months out; constrained supply supports both.
Investment metrics
- 1% rule
- 0.84% ✗
- Cap rate
- 6.27%
- Cash-on-cash
- -0.07%
- DSCR
- 1.00
- GRM
- 10.0
CMA / ARV
- ARV (median comp)
- $337,698
- List price
- $320,000
- Delta
- -5.24%
- Verdict
- FAIR
- Comps
- 1 within 2.0 mi
Projected returns pro-forma
-3.0% appreciation · 0.54% rent growth · sell at horizon
- IRR
- -19.1%
- Equity multiple
- 0.35×
- Total profit
- $-58,646
- Equity at exit
- $47,713
- IRR
- -17.5%
- Equity multiple
- 0.14×
- Total profit
- $-76,768
- Equity at exit
- $27,668
Cash invested: $89,600 (down + closing). Projections, not guarantees.
Landlord ↔ Tenant lean methodology
- Overall (STATE)
- 87 Strongly Landlord-Friendly
- State Texas
- 87 Strongly Landlord-Friendly · R+5
- County
- — inherits STATE
- City
- — inherits STATE
ZIP-level market 79765
- Home prices YoY
- -28.7%
- Rents YoY
- 0.5%
- Active inventory
- 433
- Price-to-rent
- 10.0×
Monthly cashflow live
- Estimated rent
- $2,672 high interval (Pro) →
- Mortgage (P&I)
- −$1,678
- Tax from tax record
- −$305 /mo · $3,655/yr
- Insurance
- −$133
- HOA
- −$0
- Vacancy / Maint / Mgmt
- −$561
- Net cashflow
- $-5
Break-even live
Sensitivity live
| Price | -10% $176 | -5% $86 | +0% $-5 | +5% $-96 | +10% $-186 |
|---|---|---|---|---|---|
| Rent | -10% $-216 | -5% $-111 | +0% $-5 | +5% $101 | +10% $206 |
| Rate | -1.0pp $156 | -0.5pp $76 | base $-5 | +0.5pp $-88 | +1.0pp $-172 |
UW: 25.0% down · 7.5% · 30yr · 1.5% tax · 5.0% vac · 8.0% maint · 8.0% mgmt
Financing live
Cash to close
- Down payment
- $80,000
- Closing costs
- $9,600
- Reserves months
- —
- Total cash needed
- —
Loan-product check · same deal, 3 products live
Conventional
25% down · 7.5% · 30yr
- Down + closing
- —
- Monthly P&I
- —
- Monthly cashflow
- —
- DSCR
- —
- Eligible?
- —
Personal DTI + credit; lowest rate.
DSCR
20% down · 8.5% · 30yr
- Down + closing
- —
- Monthly P&I
- —
- Monthly cashflow
- —
- DSCR
- —
- Eligible?
- —
No personal income docs; deal must DSCR.
Hard money
10% down · 12.0% · 12mo
- Down + closing
- —
- Monthly P&I
- —
- Monthly cashflow
- —
- DSCR
- —
- Eligible?
- —
Short-term bridge; refi at stabilization.
Rent comps 19 comps
| Address | Beds | Baths | Sqft | Rent | $/sqft | DOM | Units | Dist |
|---|---|---|---|---|---|---|---|---|
| 7309 Raphael St Odessa, TX | 3.0 | 2.0 | 1824 | $3,500 | $1.92 | 23d | 1 | 0.03mi |
| 7309 Bellini St Odessa, TX | 4.0 | 2.0 | 2005 | $3,000 | $1.50 | 45d | 1 | 0.13mi |
| 7206 Raphael St Odessa, TX | 3.0 | 2.0 | 1743 | $2,800 | $1.61 | 45d | 1 | 0.19mi |
| 7204 Donatello St Odessa, TX | 3.0 | 2.0 | 1748 | $2,400 | $1.37 | 45d | 1 | 0.21mi |
| 7230 Barksdale Ln Odessa, TX | 3.0 | 2.0 | 1283 | $2,100 | $1.64 | 23d | 1 | 0.24mi |
| 7214 Barksdale Ln Odessa, TX | 3.0 | 2.0 | 1295 | $2,000 | $1.54 | 45d | 1 | 0.26mi |
| 3404 Bastrop Ave Odessa, TX | 4.0 | 2.0 | 2275 | $2,800 | $1.23 | 23d | 1 | 0.27mi |
| 1207 Old Course Rd Odessa, TX | 4.0 | 2.5 | 2067 | $2,450 | $1.19 | 45d | 1 | 0.47mi |
| 1205 Old Course Rd Odessa, TX | 3.0 | 2.5 | 1731 | $2,100 | $1.21 | 45d | 1 | 0.48mi |
| 3001 Pointer Ln Unit 5B Odessa, TX | 3.0 | 2.5 | 1817 | $2,450 | $1.35 | 45d | 1 | 0.54mi |
| 3001 Pointer Ln Unit 12D Odessa, TX | 3.0 | 2.5 | 1704 | $2,800 | $1.64 | 23d | 1 | 0.56mi |
| 907 Old Course Rd Odessa, TX | 4.0 | 2.5 | 2067 | $2,450 | $1.19 | 45d | 1 | 0.56mi |
| 33 Cibola Ct Odessa, TX | 3.0 | 2.0 | 1504 | $3,500 | $2.33 | 45d | 1 | 0.65mi |
| 503 Old Course Rd Odessa, TX | 3.0 | 2.5 | 1731 | $2,200 | $1.27 | 15d | 1 | 0.68mi |
| 2804 Dustin Dr Odessa, TX | 3.0 | 2.0 | 1890 | $3,100 | $1.64 | 15d | 1 | 0.84mi |
| 7650 Tres Hermanas Blvd Odessa, TX | 1.0–2.0 | 1.0–2.0 | 1055 | $1,940 | $1.84 | 45d | 3 | 0.94mi |
| 6500 Eastridge Rd Odessa, TX | 2.0–3.0 | 1.5–2.5 | 1222 | $1,970 | $1.61 | 15d | 4 | 0.99mi |
| 3418 Rocky Lane Rd Odessa, TX | 2.0 | 2.0 | 1537 | $1,900 | $1.24 | 23d | 1 | 1.12mi |
| 8001 Brownstone Rd Odessa, TX | 1.0–2.0 | 1.0–2.0 | 958 | $2,058 | $2.15 | 15d | 16 | 1.41mi |
Listing history 7 events
-
2026-05-04$320,000 Active 175-char remark
-
2021-09-10soldstatus
-
2021-09-08soldstatus 270-char remark
Show marketing remark (270 chars)
Welcome home to this beautiful 3 bedroom 2 bathroom move in ready home! You will love the open concept floor plan and the spacious corner lot. The shutters on the windows throughout the house make this deal even sweeter! Hurry and call your agent today before it's gone!
-
2021-06-13$284,000 270-char remark
Show marketing remark (270 chars)
Welcome home to this beautiful 3 bedroom 2 bathroom move in ready home! You will love the open concept floor plan and the spacious corner lot. The shutters on the windows throughout the house make this deal even sweeter! Hurry and call your agent today before it's gone!
-
2018-03-23soldstatus
-
2018-03-22soldstatus
Show marketing remark (163 chars)
Amazing house on corner lot. Take a look at this move-in ready house. You will love the open floor plan cooncept. Granite and master bedroom. Call to see it today.
-
2017-12-04$260,000
Show marketing remark (163 chars)
Amazing house on corner lot. Take a look at this move-in ready house. You will love the open floor plan cooncept. Granite and master bedroom. Call to see it today.
ⓘ Source: listings_history table (triggers on properties + properties_extension) + one-shot
backfill from property_details.listing_events for pre-trigger history.
Tax reassessment forecast TX · Resets to sale price
- Current annual tax
- $3,655 · $305/mo
- Projected year-2 tax
- $5,856 · $488/mo
- Expected delta
- +$2,201/yr (+$183/mo · 60.2%)
ⓘ Screening estimate from a state-policy table — verify with the county assessor before closing.
Climate risk First Street
- Flood 1/10 Low FEMA zone X (unshaded) · 0% chance over 30 yrs
- Wildfire 7/10 Severe
- Heat 6/10 Major 7 d/yr ≥101°F today · 23 d/yr by 30 yrs out
- Wind 2/10 Low 3% chance of damaging wind over 30 yrs
- Air quality 1/10 Low 0 unhealthy d/yr today · 0 by 30 yrs out
Nearby sold comps map
Loading sold comps map…
Walkable amenities ~0.75 mi
Loading nearby amenities…
Taxation est. · year 1
- Rental income
- $32,066
- − Mortgage interest
- −$17,925
- − Property taxes
- −$3,655
- − Insurance
- −$1,600
- − Repairs & maintenance
- −$2,565
- − Management
- −$2,565
- − Depreciation
- −$9,309
- Taxable loss
- −$5,553
- Est. tax savings @ 24.0%
- +$1,333
- After-tax cash flow
- $1,273/yr
For passive investors: Depreciation is non-cash, so a rental often shows a tax loss while cash-flowing — sheltering income. Rental losses are passive: they offset passive income freely, and up to $25,000/yr can offset ordinary (W-2) income if you actively participate and your MAGI is under $100k (phasing out to $0 by $150k); unused losses carry forward. On sale, claimed depreciation is recaptured at up to 25%, and gains may owe capital-gains tax (a 1031 exchange can defer both). Figures are a year-1 estimate at your 24.0% rate — not tax advice; consult a CPA.
Schools (NCES district)
- District
- Ector County ISD
- NCES district ID
- 4818000
- Math proficiency
- 22% ▼ -9.00%
- Reading proficiency
- 27% ▼ -4.00%
- Median HH income
- $52,740
- Composite
- 21.89/100
- National rank
- #8233
- State rank
- #707 of 826 in TX
Livability — Odessa
- Score
- 75/100
- State rank
- #132
- US rank
- #3928
Category grades
Schools grade is shown separately in the Schools card above.
Census & demographics
- Census place
- Odessa, TX
- County
- Ector County · 131,169 people
- City population
- 131,169
- Metro
- Odessa, TX
- Population (ZIP)
- 25,904
- Household income
- $104,965
- Rent vs Own
- Severe rent burden
- 884.0
Population outlook (Ector County) Hauer SSP2
- Today (2025)
- 212,765 people
- By 2030
- 241,962 · +13.7%
- By 2040
- 306,582 · +44.1%
- By 2050
- 379,755 · +78.5%
- By 2075
- 568,991 · +167.4%
- By 2100
- 709,829 · +233.6%
Race, ethnicity, and origin ACS 2023
- Neighborhood character
- Diverse neighborhood (Simpson 0.59)
- Race & ethnicity
- Hispanic / Latino 49% White 41% Two or more races 15% Black 5% Asian 3% Native American 1%
- Hispanic origin (detail)
- Mexican 45%
- Common ancestry
- Romanian 1% Slovak 1% Lithuanian 1%
- Foreign-born
- 10% · Canada, China, South Korea
- Languages at home
- 63% English-only · Spanish 31% German/W. Germanic 1% Tagalog/Filipino 1%
Political lean MEDSL · Ector
- 2024 margin
- Solid R (+52.9) · D 23.2% · R 76.1%
- 2008→2024 swing
- -4.9pp toward R · 2008: -48.0pp · 2024: -52.9pp
- All cycles
- 2024: R+52.9 2020: R+47.8 2016: R+40.6 2012: R+48.9 2008: R+48.0
Not yet ingested
- Civics
- —
Market trends
- HPI YoY
- ▼ -69.68%
- Current HPI
- 173.4252
- Rent YoY
- ▲ 0.54%
- Metro
- Odessa, TX
- State GDP YoY
- ▲ 3.95%
- F500 in state
- 110
Industry mix (Fortune 500 HQ in TX)
| Industry | F500 HQs | Revenue |
|---|---|---|
| Energy | 16 | $1,198B |
|
||
| Technology | 5 | $198B |
|
||
| Engineering / Construction | 4 | $72B |
|
||
| Energy Services | 3 | $60B |
|
||
| Utilities | 3 | $41B |
|
||
| Healthcare | 2 | $330B |
|
||
Price history
+9.2% since first listed6 events — show timeline
- 2021-09-10 Sold (Public Records) — Public Records
- 2021-09-08 Sold (MLS) — ODMLS
- 2021-06-13 Listed $284,000 ODMLS
- 2018-03-23 Sold (Public Records) — Public Records
- 2018-03-22 Sold (MLS) — ODMLS
- 2017-12-04 Listed $260,000 ODMLS
Property tax history
-2.3%/yrLatest (2025): $3,655 · -20.7% YoY. Source: county tax records.
Cash-flow waterfall
monthlySold comps — $/sqft
last 12 mo · ≤1 miLoading sold comps…