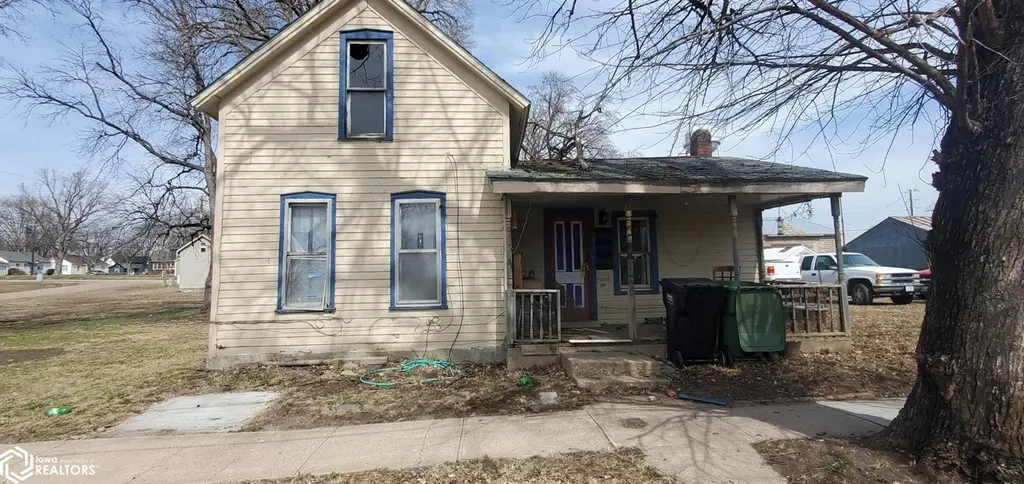
707 4th St · Correctionville, IA
Flood risk 4/10 · Minor
- FEMA flood zone
- X (unshaded)
- Chance of flooding over 30 yrs
- 0.22%
- Est. flood insurance / yr
- $473 – $860
Fire risk 3/10 · Minor
- Est. fire insurance / yr
- $902 – $1,676
Heat risk 3/10 · Minor
- Hot days now (above 102°F)
- 7 days/yr
- Hot days in 30 yrs
- 15 days/yr
Wind risk 2/10 · Minimal
- Chance of severe wind over 30 yrs
- —
Air-quality risk 1/10 · Minimal
- Unhealthy air days now
- 0 days/yr
- Unhealthy air days in 30 yrs
- 0 days/yr
Risk factors via First Street. Map © Google.
Why this score? — see what drove the C- grade
The composite is a weighted blend of 9 inputs, each scored 0–100. Each bar is that input's sub-score; the figure is the points it added to the 100-point composite (weight × sub-score).
- Cash flow +15.0/30.0
- ARV discount +7.5/15.0
- Appreciation +6.8/10.0
- Schools +5.2/10.0
- 1% rule +5.0/10.0
- DSCR +5.0/10.0
- Livability +3.3/5.0
- Rent growth +2.5/5.0
- Condition / age +2.5/5.0
$7,800
🖨 Deal sheet 📄 Offer letter ✓ Due diligence
Listing remarks
This property is an excellent opportunity for fix & flip, rental, or make it your own. Repairs, rehab, updates, clean out are needed. Plenty of opportunity for quick equity in this one. Nice corner lot. Call today!
Key facts
- 8,712 sq ft lot
- Garage
- Built 1890
Neighborhood map
What this means for you Summary
Snapshot
- This is a 4-bed/1.0-bath single-family listed at $8k.
Deal economics
- At list price, monthly cash flow is $724 ($9k/yr) — positive.
- The deal already cash-flows at list — no discount required.
- Meets the 1% rule at list price ($985 rent vs $8k).
- Recommended offer: $8k (1.5% below list) — sets the bar for market timing.
Location & tenants
- Location reads 66/100 on livability (#528 in IA) — a middle-class / working-renter tenant base. Strengths: cost of living A+, housing A+; Watch: employment D+, health & safety D, amenities F.
- River Valley Community School District (rural): math 60% / reading 63% proficiency, ranked #238 of 289 in IA (top 82%) — acceptable for families but not a draw, mixed tenant base, ~2y average lease.
- Market conditions: 15 active listings in the ZIP; 170 units permitted in Woodbury County in 2024 (90 in 5+ unit buildings).
Forward outlook
- In year one you build about $335 of equity ($54 loan paydown + $281 appreciation (3.6% local appreciation)).
- At projected returns (3.6% appreciation + 3.0% rent growth), your $2k cash investment doubles in ~1 year — after that, you're playing with house money.
Negotiation context
- It's been on market 26 days — a 2% lower offer ($8k) is reasonable based on typical stale-listing flexibility.
Risks & watch-outs
- Watch-outs: built in 1890 — expect roof / HVAC / electrical / plumbing capex.
Questions for the listing agent
- Built in 1890 — when were the roof, HVAC, electrical panel, plumbing, and water heater last replaced?
- Is there a deadline driving the sale (1031 exchange, divorce, estate, relocation)? That informs how much negotiation room exists.
- Schools are B-rated — typically a magnet for longer-tenancy family renters. What's the average tenant stay here, and is there a school-zone premium baked into asking?
- What's the average days-on-market for RENTAL listings here right now (not sales)? A rising rental-DOM trend means longer vacancies and softer asking-rent achievability than the comps imply.
- What's the recent tenant-quality profile in this submarket — average credit score on applications, eviction rate, late-payment / NSF rate, and stable-employment percentage? A property-management company in the area should have these aggregated.
- How much new for-sale + rental construction is in the pipeline within 1–3 miles? Heavy new supply typically softens prices + rents 12–24 months out; constrained supply supports both.
Investment metrics
- 1% rule
- 12.62% ✓
- Cap rate
- 117.67%
- Cash-on-cash
- 397.77%
- DSCR
- 18.70
- GRM
- 0.7
CMA / ARV
No comps found within radius.
Projected returns pro-forma
3.61% appreciation · 3.0% rent growth · sell at horizon
- IRR
- —
- Equity multiple
- 22.66×
- Total profit
- $47,316
- Equity at exit
- $3,776
- IRR
- —
- Equity multiple
- 48.41×
- Total profit
- $103,537
- Equity at exit
- $6,038
Cash invested: $2,184 (down + closing). Projections, not guarantees.
Landlord ↔ Tenant lean methodology
- Overall (STATE)
- 83 Strongly Landlord-Friendly
- State Iowa
- 83 Strongly Landlord-Friendly · R+6
- County
- — inherits STATE
- City
- — inherits STATE
ZIP-level market 51016
- Home prices YoY
- 1.7%
- Active inventory
- 15
- Price-to-rent
- 0.7×
Monthly cashflow live
- Estimated rent
- $985 medium interval (Pro) →
- Mortgage (P&I)
- −$41
- Tax est. 1.5%
- −$10 /mo · $117/yr
- Insurance
- −$3
- HOA
- −$0
- Vacancy / Maint / Mgmt
- −$207
- Net cashflow
- $724
Break-even live
UW: 25.0% down · 7.5% · 30yr · 1.5% tax · 5.0% vac · 8.0% maint · 8.0% mgmt
Financing live
Cash to close
- Down payment
- $1,950
- Closing costs
- $234
- Reserves months
- —
- Total cash needed
- —
Loan-product check · same deal, 3 products live
Conventional
25% down · 7.5% · 30yr
- Down + closing
- —
- Monthly P&I
- —
- Monthly cashflow
- —
- DSCR
- —
- Eligible?
- —
Personal DTI + credit; lowest rate.
DSCR
20% down · 8.5% · 30yr
- Down + closing
- —
- Monthly P&I
- —
- Monthly cashflow
- —
- DSCR
- —
- Eligible?
- —
No personal income docs; deal must DSCR.
Hard money
10% down · 12.0% · 12mo
- Down + closing
- —
- Monthly P&I
- —
- Monthly cashflow
- —
- DSCR
- —
- Eligible?
- —
Short-term bridge; refi at stabilization.
Listing history 4 events
-
2026-04-23status Pending
-
2026-04-20historical Active Under Contract
-
2026-03-28$7,800 Active
-
2012-05-31soldstatus $15,000
ⓘ Source: listings_history table (triggers on properties + properties_extension) + one-shot
backfill from property_details.listing_events for pre-trigger history.
Climate risk First Street
- Flood 4/10 Moderate FEMA zone X (unshaded) · 22% chance over 30 yrs
- Wildfire 3/10 Moderate
- Heat 3/10 Moderate 7 d/yr ≥102°F today · 15 d/yr by 30 yrs out
- Wind 2/10 Low
- Air quality 1/10 Low 0 unhealthy d/yr today · 0 by 30 yrs out
Nearby sold comps map
Loading sold comps map…
Walkable amenities ~0.75 mi
Loading nearby amenities…
Taxation est. · year 1
- Rental income
- $11,815
- − Mortgage interest
- −$437
- − Property taxes
- −$117
- − Insurance
- −$39
- − Repairs & maintenance
- −$945
- − Management
- −$945
- − Depreciation
- −$227
- Taxable income
- $9,105
- Est. tax owed @ 24.0%
- −$2,185
- After-tax cash flow
- $6,502/yr
For passive investors: Depreciation is non-cash, so a rental often shows a tax loss while cash-flowing — sheltering income. Rental losses are passive: they offset passive income freely, and up to $25,000/yr can offset ordinary (W-2) income if you actively participate and your MAGI is under $100k (phasing out to $0 by $150k); unused losses carry forward. On sale, claimed depreciation is recaptured at up to 25%, and gains may owe capital-gains tax (a 1031 exchange can defer both). Figures are a year-1 estimate at your 24.0% rate — not tax advice; consult a CPA.
Schools (NCES district)
- District
- River Valley Community School District
- NCES district ID
- 1910340
- Math proficiency
- 60% ▼ -5.00%
- Reading proficiency
- 63% ▼ -2.00%
- Median HH income
- $43,677
- Composite
- 51.71/100
- National rank
- #1686
- State rank
- #238 of 289 in IA
Livability — Correctionville
- Score
- 66/100
- State rank
- #528
- US rank
- #11786
Category grades
Schools grade is shown separately in the Schools card above.
Census & demographics
- Census place
- Correctionville, IA
- Population (ZIP)
- 1,095
Population outlook (Woodbury County) Hauer SSP2
- Today (2025)
- 103,226 people
- By 2030
- 103,060 · -0.2%
- By 2040
- 102,533 · -0.7%
- By 2050
- 102,788 · -0.4%
- By 2075
- 107,227 · +3.9%
- By 2100
- 113,980 · +10.4%
Race, ethnicity, and origin ACS 2023
- Neighborhood character
- Predominantly White (83%)
- Race & ethnicity
- White 83% Two or more races 16% Hispanic / Latino 15%
- Hispanic origin (detail)
- Mexican 14%
- Common ancestry
- Romanian 3% Lithuanian 2% Portuguese 1%
- Foreign-born
- 3% · Canada
- Languages at home
- 84% English-only · Spanish 14% German/W. Germanic 1%
Political lean MEDSL · Woodbury
- 2024 margin
- Strong R (+23.0) · D 37.8% · R 60.9% · Other 1.3%
- 2008→2024 swing
- -22.5pp toward R · 2008: -0.5pp · 2024: -23.0pp
- All cycles
- 2024: R+23.0 2020: R+15.5 2016: R+19.9 2012: R+0.2 2008: R+0.5
Not yet ingested
- Civics
- —
Market trends
- HPI YoY
- ▲ 3.61%
- Current HPI
- 215.7251
- Rent YoY
- —
- Metro
- —
- State GDP YoY
- ▲ 2.48%
- F500 in state
- 4
Industry mix (Fortune 500 HQ in IA)
| Industry | F500 HQs | Revenue |
|---|---|---|
| Financial Services | 1 | $16B |
|
||
| Retail / Convenience | 1 | $15B |
|
||
Price history
-48.0% since first listed4 events — show timeline
- 2026-04-23 Pending — IAR
- 2026-04-20 Contingent — IAR
- 2026-03-28 Listed $7,800 IAR
- 2012-05-31 Sold (Public Records) $15,000 Public Records
Property tax history
+11.7%/yrLatest (2025): $691 · -0.1% YoY. Source: county tax records.
Cash-flow waterfall
monthlySold comps — $/sqft
last 12 mo · ≤1 miLoading sold comps…