 Fourplex
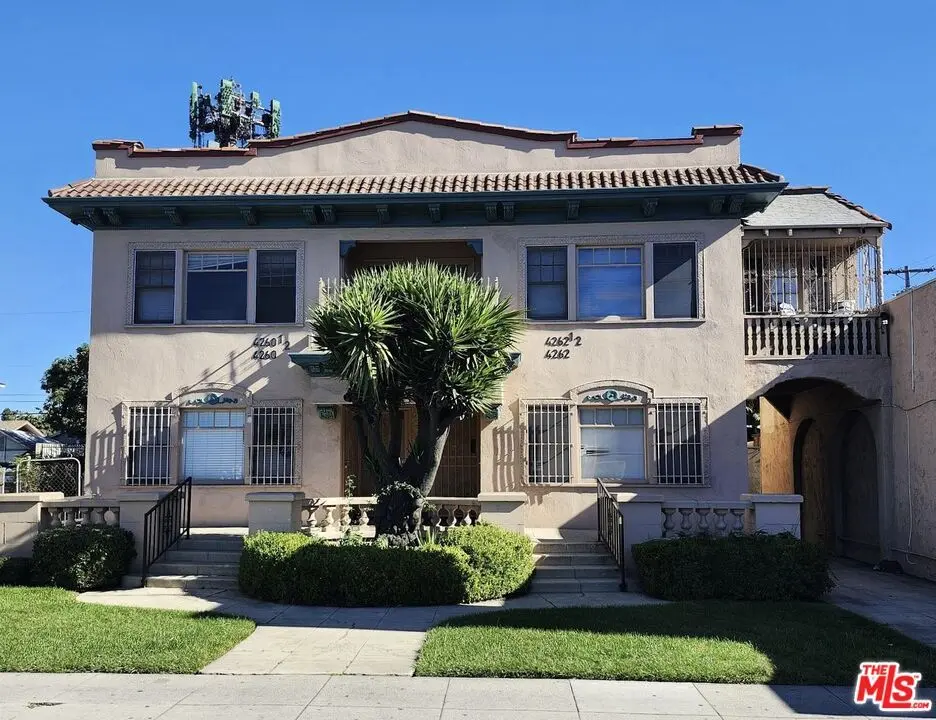
4260 S Figueroa St · Los Angeles, CA
Flood risk 1/10 · Minimal
- FEMA flood zone
- X (unshaded)
- Chance of flooding over 30 yrs
- 0.0%
- Est. flood insurance / yr
- $507 – $1,088
Fire risk 1/10 · Minimal
- Est. fire insurance / yr
- $659 – $1,223
Heat risk 6/10 · Moderate
- Hot days now (above 88°F)
- 7 days/yr
- Hot days in 30 yrs
- 22 days/yr
Wind risk 1/10 · Minimal
- Chance of severe wind over 30 yrs
- —
Air-quality risk 5/10 · Moderate
- Unhealthy air days now
- 7 days/yr
- Unhealthy air days in 30 yrs
- 7 days/yr
Risk factors via First Street. Map © Google.
Why this score? — see what drove the C grade
The composite is a weighted blend of 9 inputs, each scored 0–100. Each bar is that input's sub-score; the figure is the points it added to the 100-point composite (weight × sub-score).
- Cash flow +27.4/30.0
- DSCR +9.6/10.0
- 1% rule +6.4/10.0
- Schools +3.6/10.0
- Livability +3.4/5.0
- Rent growth +2.9/5.0
- Condition / age +2.5/5.0
- ARV discount +1.8/15.0
- Appreciation +0.0/10.0
$1,150,000
🖨 Deal sheet 📄 Offer letter ✓ Due diligence
Multi-family units
County records classify this as Multi-Family (2-4 Unit). Listing-text estimate: 4 units. confirmed
Listing remarks MLS
An exceptional investment opportunity awaits in the heart of Los Angeles. This spacious and elegantly maintained four-unit property sits on a large 7,510 sq. ft. lot, just blocks from the University of Southern California, the Coliseum and one block from the iconic BMO Stadium, home of LAFC. Each of the four units contains approximately 1,100 Sq. Ft. with pristine hardwood floors and nice finishes offering immediate appeal for residents. Situated just minutes to Exposition Park the new Lucas Museum of Narrative art, Expo Line Train Station, this property offers incredible access to cultural landmarks, public transit, and campus life. The neighborhood is experiencing rapid appreciation, making this a strong income-producing investment. Property includes a driveway to a back lot for ample parking. Easy reach to downtown LA, cultural venues, and public transit. High Demand Market Student housing, young professionals, and sports/cultural enthusiasts. The Fourth ground-floor vacant unit offers Value-Add Opportunity: Renovate the fourth unit for increased returns at a projected rental income of $2,300/month or as an owner user. Gross Rent Multiplier is calculated with the actual gross rent of the occupied three units plus the scheduled gross rent for the vacant unit.
Key facts
- Public transit
- Large lot
- Four unit property
Tags
Neighborhood map
What this means for you Summary
Snapshot
- This is a 4 × 4-bed/4.0-bath units multifamily listed at $1.15M.
Deal economics
- At list price, monthly cash flow is $3k ($41k/yr) — positive. Per door: $844/mo.
- The deal already cash-flows at list — no discount required.
- Meets the 1% rule at list price ($13k rent vs $1.15M).
- Recommended offer: $1.01M (12.0% below list) — sets the bar for market timing.
- Cap rate 9.8% vs local median 2.1% in Los Angeles — top-decile yield for the area; either an underpriced asset or a hidden risk that comps aren't pricing in. Stress-test before assuming the spread holds.
Location & tenants
- Location reads 68/100 on livability (#273 in CA) — a middle-class / working-renter tenant base. Strengths: amenities A+, commute A+, employment B; Watch: health & safety C-, schools D+, crime F.
- Los Angeles Unified (urban): math 29% / reading 54% proficiency, ranked #223 of 517 in CA (top 43%) — families likely to look elsewhere, expect single-tenant / working-renter base with shorter leases; 67% free/reduced lunch — lower-income household profile, screen leases tightly.
- Market conditions: Rents rising (+1.7%/yr); 99 active listings in the ZIP; 5 comparable units currently listed for rent nearby; rentals at typical pace (median 25d on market — plan ~3-4 weeks tenant-placement turnaround); 19,697 units permitted in Los Angeles County in 2024 (9,426 in 5+ unit buildings).
- At $13,123/mo this rent would consume 273% of the median local household income ($58k/yr) (locally 4200% of renters already pay >50% of income on rent) — very limited rent-growth headroom before tenants either downsize or default.
Forward outlook
- Local home prices are declining (-3.0%/yr); year-one equity from $8k of loan paydown is wiped out by about $34k of value loss. Plan a longer hold.
- Los Angeles County population projected at +9% by 2050 — modest demand growth; plan on rents tracking national, not racing it.
Negotiation context
- It's been on market 199 days — a 12% lower offer ($1.01M) is reasonable based on typical stale-listing flexibility.
- Current owner paid $225k; list at $1.15M implies a 411% gain — meaningful room to come down on a strong offer.
Risks & watch-outs
- Watch-outs: built in 1920 — expect roof / HVAC / electrical / plumbing capex.
- Climate carrying-cost: extreme-heat days projected 7→22/yr by 2055 (HVAC capex compounding) — expect insurance premiums to compound above CPI over the hold.
Questions for the listing agent
- It's been on market 199 days. Have you received any prior offers? Is the seller open to a 12% concession, seller financing, or rate buy-down credit?
- Can we see the unit-by-unit rent roll, current vacancy, and any below-market leases? What's the average tenancy length?
- What capital expenditures (roof, boiler, parking lot, exteriors) have been made in the last 5 years, and what's planned in the next 2?
- Built in 1920 — when were the roof, HVAC, electrical panel, plumbing, and water heater last replaced?
- Why hasn't it sold? Are there any deal-killer items the seller is aware of (foundation, flood, title, zoning, code violations)?
- Is there a deadline driving the sale (1031 exchange, divorce, estate, relocation)? That informs how much negotiation room exists.
- Schools are D-rated, which usually means shorter tenancies and higher turnover. Who's the typical renter profile here, and what's been the actual vacancy rate?
- Crime grade is F in this area — have there been break-ins, vandalism, or insurance claims at this property in the last 3 years? What carrier currently insures it and at what premium?
- What's the average days-on-market for RENTAL listings here right now (not sales)? A rising rental-DOM trend means longer vacancies and softer asking-rent achievability than the comps imply.
- What's the recent tenant-quality profile in this submarket — average credit score on applications, eviction rate, late-payment / NSF rate, and stable-employment percentage? A property-management company in the area should have these aggregated.
- How much new apartment / multifamily construction is in the pipeline within 1–3 miles? Heavy new supply (>2% of stock underway) typically softens rents 12–24 months out; light construction supports rent growth.
Investment metrics
- 1% rule
- 1.14% ✓
- Cap rate
- 9.82%
- Cash-on-cash
- 12.58%
- DSCR
- 1.56
- GRM
- 7.3
CMA / ARV
- ARV (median comp)
- $1,020,709
- List price
- $1,150,000
- Delta
- 12.67%
- Verdict
- OVERPRICED
- Comps
- 20 within 1.0 mi
Show comp detail 3 sales within ~0.75 mi
| Address | Dist | Beds/Ba | Sqft | Sold | Price | $/sf | Match |
|---|---|---|---|---|---|---|---|
| 807 W 41st St | 0.39mi | 4/4.0 | 4,548 (+1%) | 10mo | $1,300,000 | $286 | 72 |
| 869 W 41st St | 0.48mi | 3/9.0 (-1) | 4,588 (+2%) | 3mo | $1,080,000 | $235 | 53 |
| 854 W Martin Luther King Jr Blvd | 0.51mi | 4/— | 4,062 (-10%) | 8mo | $1,200,000 | $295 | 52 |
Match score weights: distance 35% · size 25% · config 20% · recency 20%. Top-matched comps best support the ARV.
Projected returns pro-forma
-3.0% appreciation · 1.69% rent growth · sell at horizon
- IRR
- 0.9%
- Equity multiple
- 1.03×
- Total profit
- $11,246
- Equity at exit
- $171,469
- IRR
- 9.3%
- Equity multiple
- 1.67×
- Total profit
- $216,890
- Equity at exit
- $99,431
Cash invested: $322,000 (down + closing). Projections, not guarantees.
Landlord ↔ Tenant lean methodology
- Overall (CITY)
- 0 Strongly Tenant-Friendly
- State California
- 18 Strongly Tenant-Friendly · D+13
- County
- — inherits STATE
- City Los Angeles
- 0 Strongly Tenant-Friendly · D+22
ZIP-level market 90037
- Rents YoY
- 1.7%
- Active inventory
- 99
- Price-to-rent
- 29.2×
Monthly cashflow live
- Estimated rent
- $13,123 high interval (Pro) →
- Mortgage (P&I)
- −$6,031
- Tax from tax record
- −$481 /mo · $5,768/yr
- Insurance
- −$479
- HOA
- −$0
- Vacancy / Maint / Mgmt
- −$2,756
- Net cashflow
- $3,377
Break-even live
4-unit breakdown (identical units grouped — click to expand)
| Units | Beds | Baths | Est. rent |
|---|---|---|---|
| 4× units | 4 | 4 | $13,124 |
| #1 | 4 | 4 | $3,281 |
| #2 | 4 | 4 | $3,281 |
| #3 | 4 | 4 | $3,281 |
| #4 | 4 | 4 | $3,281 |
| Total (4 units) | $13,123 | ||
UW: 25.0% down · 7.5% · 30yr · 1.5% tax · 5.0% vac · 8.0% maint · 8.0% mgmt
Financing live
Cash to close
- Down payment
- $287,500
- Closing costs
- $34,500
- Reserves months
- —
- Total cash needed
- —
Loan-product check · same deal, 3 products live
Conventional
25% down · 7.5% · 30yr
- Down + closing
- —
- Monthly P&I
- —
- Monthly cashflow
- —
- DSCR
- —
- Eligible?
- —
Personal DTI + credit; lowest rate.
DSCR
20% down · 8.5% · 30yr
- Down + closing
- —
- Monthly P&I
- —
- Monthly cashflow
- —
- DSCR
- —
- Eligible?
- —
No personal income docs; deal must DSCR.
Hard money
10% down · 12.0% · 12mo
- Down + closing
- —
- Monthly P&I
- —
- Monthly cashflow
- —
- DSCR
- —
- Eligible?
- —
Short-term bridge; refi at stabilization.
Rent comps 5 comps
| Address | Beds | Baths | Sqft | Rent | $/sqft | DOM | Units | Dist |
|---|---|---|---|---|---|---|---|---|
| 145 E 36th St Unit 145 Los Angeles, CA | 5.0 | 3.0 | 4500 | $5,400 | $1.20 | 24d | 1 | 0.92mi |
| 1150 W 38th St Los Angeles, CA | 3.0–19.0 | 3.0–18.5 | 4527 | $4,969 | $1.10 | 1d | 9 | 1.11mi |
| 715 W 58th St Los Angeles, CA | 5.0 | 3.0 | 3500 | $4,000 | $1.14 | 24d | 1 | 1.13mi |
| 225 E 30th St Unit 225 1/2 Los Angeles, CA | 3.0 | 2.0 | 4346 | $3,100 | $0.71 | 43d | 1 | 1.29mi |
| 215 E 29th St Unit 1 Los Angeles, CA | 4.0 | 4.0 | 4000 | $750 | $0.19 | 24d | 1 | 1.36mi |
Listing history 18 events
-
2026-06-18days on market $1,150,000 Active 199 DOM
-
2026-06-17days on market $1,150,000 Active 198 DOM
-
2026-06-16days on market $1,150,000 Active 197 DOM
-
2026-06-15days on market $1,150,000 Active 196 DOM
-
2026-06-13days on market $1,150,000 Active 194 DOM
-
2026-06-09days on market $1,150,000 Active 190 DOM
-
2026-06-08days on market $1,150,000 Active 189 DOM
-
2026-06-07days on market $1,150,000 Active 188 DOM
-
2026-06-04days on market $1,150,000 Active 185 DOM
-
2026-06-03days on market $1,150,000 Active 184 DOM
-
2026-06-02days on market $1,150,000 Active 183 DOM
-
2026-06-01days on market $1,150,000 Active 182 DOM
-
2026-05-31days on market $1,150,000 Active 181 DOM
-
2026-04-03price $1,150,000 1281-char remark
Show marketing remark (1281 chars)
An exceptional investment opportunity awaits in the heart of Los Angeles. This spacious and elegantly maintained four-unit property sits on a large 7,510 sq. ft. lot, just blocks from the University of Southern California, the Coliseum and one block from the iconic BMO Stadium, home of LAFC. Each of the four units contains approximately 1,100 Sq. Ft. with pristine hardwood floors and nice finishes offering immediate appeal for residents. Situated just minutes to Exposition Park the new Lucas Museum of Narrative art, Expo Line Train Station, this property offers incredible access to cultural landmarks, public transit, and campus life. The neighborhood is experiencing rapid appreciation, making this a strong income-producing investment. Property includes a driveway to a back lot for ample parking. Easy reach to downtown LA, cultural venues, and public transit. High Demand Market Student housing, young professionals, and sports/cultural enthusiasts. The Fourth ground-floor vacant unit offers Value-Add Opportunity: Renovate the fourth unit for increased returns at a projected rental income of $2,300/month or as an owner user. Gross Rent Multiplier is calculated with the actual gross rent of the occupied three units plus the scheduled gross rent for the vacant unit.
-
2025-12-01$1,295,000 Active 1281-char remark
Show marketing remark (1281 chars)
An exceptional investment opportunity awaits in the heart of Los Angeles. This spacious and elegantly maintained four-unit property sits on a large 7,510 sq. ft. lot, just blocks from the University of Southern California, the Coliseum and one block from the iconic BMO Stadium, home of LAFC. Each of the four units contains approximately 1,100 Sq. Ft. with pristine hardwood floors and nice finishes offering immediate appeal for residents. Situated just minutes to Exposition Park the new Lucas Museum of Narrative art, Expo Line Train Station, this property offers incredible access to cultural landmarks, public transit, and campus life. The neighborhood is experiencing rapid appreciation, making this a strong income-producing investment. Property includes a driveway to a back lot for ample parking. Easy reach to downtown LA, cultural venues, and public transit. High Demand Market Student housing, young professionals, and sports/cultural enthusiasts. The Fourth ground-floor vacant unit offers Value-Add Opportunity: Renovate the fourth unit for increased returns at a projected rental income of $2,300/month or as an owner user. Gross Rent Multiplier is calculated with the actual gross rent of the occupied three units plus the scheduled gross rent for the vacant unit.
-
1994-04-27soldstatus $225,000
-
1987-08-07soldstatus $146,000
-
1983-10-18soldstatus $100,000
ⓘ Source: listings_history table (triggers on properties + properties_extension) + one-shot
backfill from property_details.listing_events for pre-trigger history.
Tax reassessment forecast CA · Resets to sale price
- Current annual tax
- $5,768 · $481/mo
- Projected year-2 tax
- $8,740 · $728/mo
- Expected delta
- +$2,972/yr (+$248/mo · 51.5%)
ⓘ Screening estimate from a state-policy table — verify with the county assessor before closing.
Climate risk First Street
- Flood 1/10 Low FEMA zone X (unshaded) · 0% chance over 30 yrs
- Wildfire 1/10 Low
- Heat 6/10 Major 7 d/yr ≥88°F today · 22 d/yr by 30 yrs out
- Wind 1/10 Low
- Air quality 5/10 Major 7 unhealthy d/yr today · 7 by 30 yrs out
Nearby sold comps map
Loading sold comps map…
Walkable amenities ~0.75 mi
Loading nearby amenities…
Taxation est. · year 1
- Rental income
- $157,476
- − Mortgage interest
- −$64,418
- − Property taxes
- −$5,768
- − Insurance
- −$5,750
- − Repairs & maintenance
- −$12,598
- − Management
- −$12,598
- − Depreciation
- −$33,455
- Taxable income
- $22,890
- Est. tax owed @ 24.0%
- −$5,494
- After-tax cash flow
- $35,026/yr
For passive investors: Depreciation is non-cash, so a rental often shows a tax loss while cash-flowing — sheltering income. Rental losses are passive: they offset passive income freely, and up to $25,000/yr can offset ordinary (W-2) income if you actively participate and your MAGI is under $100k (phasing out to $0 by $150k); unused losses carry forward. On sale, claimed depreciation is recaptured at up to 25%, and gains may owe capital-gains tax (a 1031 exchange can defer both). Figures are a year-1 estimate at your 24.0% rate — not tax advice; consult a CPA.
Schools (NCES district)
- District
- Los Angeles Unified
- NCES district ID
- 0622710
- Math proficiency
- 29% ▼ -4.00%
- Reading proficiency
- 54% ▲ 10.00%
- Median HH income
- $50,403
- Composite
- 35.67/100
- National rank
- #4875
- State rank
- #223 of 517 in CA
Livability — Los Angeles
- Score
- 68/100
- State rank
- #273
- US rank
- #9237
Category grades
Schools grade is shown separately in the Schools card above.
Census & demographics
- Census place
- Los Angeles, CA
- County
- Los Angeles County · 9,444,647 people
- City population
- 3,838,149
- Metro
- Los Angeles-Long Beach-Anaheim, CA
- Population (ZIP)
- 65,482
- Household income
- $57,622
- Rent vs Own
- Severe rent burden
- 4200.0
Population outlook (Los Angeles County) Hauer SSP2
- Today (2025)
- 10,940,515 people
- By 2030
- 11,256,481 · +2.9%
- By 2040
- 11,729,929 · +7.2%
- By 2050
- 11,948,407 · +9.2%
- By 2075
- 11,818,114 · +8.0%
- By 2100
- 10,842,928 · -0.9%
Race, ethnicity, and origin ACS 2023
- Neighborhood character
- Predominantly Hispanic (80%)
- Race & ethnicity
- Hispanic / Latino 80% Two or more races 15% Black 15% Native American 3% White 2% Asian 1%
- Hispanic origin (detail)
- Mexican 43%
- Common ancestry
- British 1%
- Foreign-born
- 44% · Canada, South Korea
- Languages at home
- 23% English-only · Spanish 74% Korean 1% French/Haitian/Cajun 1%
Political lean MEDSL · Los Angeles
- 2024 margin
- Solid D (+32.9) · D 64.8% · R 31.9% · Other 3.3%
- 2008→2024 swing
- -7.4pp toward R · 2008: 40.4pp · 2024: 32.9pp
- All cycles
- 2024: D+32.9 2020: D+44.2 2016: D+48.0 2012: D+40.0 2008: D+40.4
Not yet ingested
- Civics
- —
Market trends
- HPI YoY
- ▼ -639.09%
- Current HPI
- 467.0371
- Rent YoY
- ▲ 1.69%
- Metro
- Los Angeles-Long Beach-Anaheim, CA
- State GDP YoY
- ▲ 3.21%
- F500 in state
- 116
Industry mix (Fortune 500 HQ in CA)
| Industry | F500 HQs | Revenue |
|---|---|---|
| Technology | 27 | $1,492B |
|
||
| Financial Services | 3 | $174B |
|
||
| Retail | 3 | $44B |
|
||
| Insurance | 3 | $26B |
|
||
| Media / Entertainment | 2 | $115B |
|
||
| Pharmaceuticals / Biotech | 2 | $62B |
|
||
Price history
+1050.0% since first listed5 events — show timeline
- 2026-04-03 Price Changed $1,150,000 TheMLS
- 2025-12-01 Listed $1,295,000 TheMLS
- 1994-04-27 Sold (Public Records) $225,000 Public Records
- 1987-08-07 Sold (Public Records) $146,000 Public Records
- 1983-10-18 Sold (Public Records) $100,000 Public Records
Property tax history
+1.7%/yrLatest (2025): $5,768 · +2.5% YoY. Source: county tax records.
Cash-flow waterfall
monthlySold comps — $/sqft
last 12 mo · ≤1 miLoading sold comps…