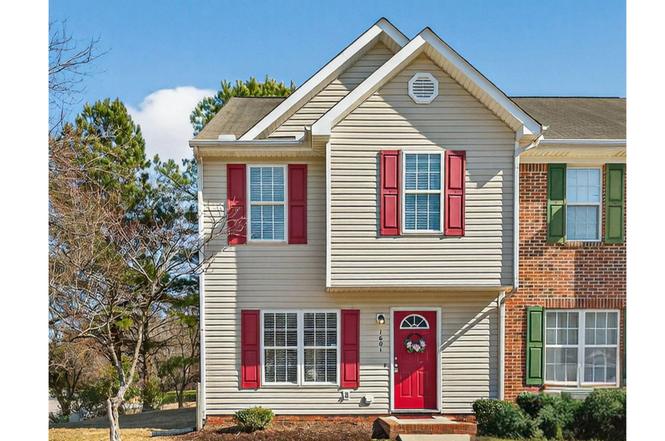
1601 Briarmont Ct · Raleigh, NC
Flood risk 1/10 · Minimal
- FEMA flood zone
- X (unshaded)
- Chance of flooding over 30 yrs
- 0.0%
- Est. flood insurance / yr
- $507 – $1,088
Fire risk 3/10 · Minor
- Est. fire insurance / yr
- $906 – $1,684
Heat risk 6/10 · Moderate
- Hot days now (above 105°F)
- 7 days/yr
- Hot days in 30 yrs
- 17 days/yr
Wind risk 6/10 · Moderate
- Chance of severe wind over 30 yrs
- 58.0%
Air-quality risk 3/10 · Minor
- Unhealthy air days now
- 2 days/yr
- Unhealthy air days in 30 yrs
- 2 days/yr
Risk factors via First Street. Map © Google.
Why this score? — see what drove the D- grade
The composite is a weighted blend of 9 inputs, each scored 0–100. Each bar is that input's sub-score; the figure is the points it added to the 100-point composite (weight × sub-score).
- Cash flow +11.2/30.0
- ARV discount +7.5/15.0
- Schools +4.9/10.0
- Livability +4.2/5.0
- 1% rule +3.4/10.0
- DSCR +3.3/10.0
- Rent growth +2.6/5.0
- Condition / age +2.5/5.0
- Appreciation +0.0/10.0
$219,000
🖨 Deal sheet (PDF) 📄 Offer letter ✓ Due diligence
Listing remarks
This is it! Hard-to-find, move-in-ready, well-maintained 3-bedroom, 2.5-bath END-unit townhome priced under $220,000. This immaculate home features a two-story layout in a convenient Raleigh location and is ideal for both owner-occupants and investors. Recent updates include newer flooring and fresh interior paint, making the home truly turn-key. The kitchen offers plenty of cabinet space, stove, and dishwasher. The light-filled living room features a cozy gas log fireplace, creating a warm and inviting space. Upstairs, you'll find the primary bedroom with en-suite bath, along with two additional bedrooms. adding to the home's convenience and value. The location is hard to beat with easy ac
Key facts
- Newer flooring
- End-unit townhome
- Two-story layout
Tags
Property features AI
Finance
- Other: Lot size approximately 0.02 acres; Zoned R-6
- HOA & community: Neighborhoods of Walnut Creek Townhomes Association; Monthly HOA fee of $120.78 covering grounds and structure maintenance
Exterior
- Parking: Open parking with 2 spaces (2 total parking spaces)
- Utilities: Public water; Public sewer
- Home design: Townhouse; Bi-level; Townhouse ownership
- Construction: Brick veneer and vertical siding exterior
- Exterior features: Slab foundation; Shingle roof; Private road with road maintenance agreement
Interior
- Bedrooms: 3 bedrooms
- Flooring: Carpet; Vinyl
- Bathrooms: 2 full bathrooms; 1 half bathroom
- Heating & cooling: Forced air heating (natural gas); Central air conditioning
- Interior features: Gas log fireplace; Carpet and vinyl flooring
Neighborhood map
What this means for you Summary
Snapshot
- This is a 3-bed/2.5-bath townhouse listed at $219k.
Deal economics
- At list price, monthly cash flow is $-85 ($-1k/yr) — negative.
- To cash-flow at today's rent, offer at most $204k (6.9% below list).
- To meet the 1% rule (rent ≥ 1% of price), the offer needs to be $185k (15.7% below list).
- Recommended offer: $185k (15.7% below list) — sets the bar for 1% rule.
- Cap rate 5.8% vs local median 2.7% in Raleigh — top-decile yield for the area; either an underpriced asset or a hidden risk that comps aren't pricing in. Stress-test before assuming the spread holds.
Location & tenants
- Location reads 83/100 on livability (#10 in NC, #1,028 nationally) — a professional / high-income tenant draw. Strengths: amenities A+, commute A+, housing A+; Watch: crime F.
- Wake County Schools (suburban): math 52% / reading 60% proficiency, ranked #35 of 178 in NC (top 20%) — acceptable for families but not a draw, mixed tenant base, ~2y average lease.
- Zoned schools: Walnut Creek Elementary (math 23% / reading 32%, grade F, #1,028 of 1,410 statewide, top 73%, 497 students, 99% FRL); Centennial Campus Middle (math 27% / reading 47%, grade F, #262 of 475 statewide, top 57%, 509 students, 66% FRL); Southeast Raleigh High (math 24% / reading 50%, grade F, #414 of 535 statewide, top 79%, 1,401 students, 72% FRL) — zoned schools average 79% FRL vs 30% district-wide (49 pts higher); higher-poverty schools than district average — tighter screening recommended.
- Zoned-school proficiency averages 34% at this address vs 56% district-wide (-22 pts) — the specific schools serving this property underperform the Wake County Schools average; the district grade overstates school quality for this exact location.
- Market conditions: Rents flat; 594 active listings in the ZIP; 23 comparable units currently listed for rent nearby; rentals at typical pace (median 18d on market — plan ~3-4 weeks tenant-placement turnaround); 15,249 units permitted in Wake County in 2024 (5,568 in 5+ unit buildings).
- This rent runs 33% of the median local income ($68k/yr) — at the standard rent-burdened threshold; future hikes will face affordability resistance.
Forward outlook
- Local home prices are declining (-3.0%/yr); year-one equity from $2k of loan paydown is wiped out by about $7k of value loss. Plan a longer hold.
- Wake County population projected at +51% by 2050 — long-run rental-demand tailwind backs the buy-and-hold thesis.
Negotiation context
- It's been on market 132 days — a 12% lower offer ($193k) is reasonable based on typical stale-listing flexibility.
- 8 sale attempts since 24y ago; this cycle's ask has dropped $18k (8%) from the opening price — seller is motivated, your offer sets the floor, not the list.
Risks & watch-outs
- Climate carrying-cost: major wind risk, 58% chance of damaging wind over 30y; extreme-heat days projected 7→17/yr by 2055 (HVAC capex compounding) — expect insurance premiums to compound above CPI over the hold.
Questions for the listing agent
- What do current leases actually rent for vs. the listed asking? Can we see a recent rent roll and the last 12 months of T-12 income?
- It's been on market 132 days. Have you received any prior offers? Is the seller open to a 16% concession, seller financing, or rate buy-down credit?
- What does the HOA fee cover, when was the last increase, and are there any pending special assessments or reserve-fund shortfalls?
- Why hasn't it sold? Are there any deal-killer items the seller is aware of (foundation, flood, title, zoning, code violations)?
- Is there a deadline driving the sale (1031 exchange, divorce, estate, relocation)? That informs how much negotiation room exists.
- Schools are B-rated — typically a magnet for longer-tenancy family renters. What's the average tenant stay here, and is there a school-zone premium baked into asking?
- Crime grade is F in this area — have there been break-ins, vandalism, or insurance claims at this property in the last 3 years? What carrier currently insures it and at what premium?
- The area grade is low — what's the realistic commute time and amenity access for the typical tenant pool here? Any planned neighborhood developments (good or bad) we should know about?
- What's the average days-on-market for RENTAL listings here right now (not sales)? A rising rental-DOM trend means longer vacancies and softer asking-rent achievability than the comps imply.
- What's the recent tenant-quality profile in this submarket — average credit score on applications, eviction rate, late-payment / NSF rate, and stable-employment percentage? A property-management company in the area should have these aggregated.
- How much new for-sale + rental construction is in the pipeline within 1–3 miles? Heavy new supply typically softens prices + rents 12–24 months out; constrained supply supports both.
Investment metrics
- 1% rule
- 0.84% ✗
- Cap rate
- 5.82%
- Cash-on-cash
- -1.67%
- DSCR
- 0.93
- GRM
- 9.9
CMA / ARV
No comps found within radius.
Projected returns pro-forma
-3.0% appreciation · 0.2% rent growth · sell at horizon
- IRR
- -22.3%
- Equity multiple
- 0.25×
- Total profit
- $-45,940
- Equity at exit
- $32,654
- IRR
- -25.7%
- Equity multiple
- -0.08×
- Total profit
- $-66,446
- Equity at exit
- $18,935
Cash invested: $61,320 (down + closing). Projections, not guarantees.
Landlord ↔ Tenant lean methodology
- Overall (STATE)
- 85 Strongly Landlord-Friendly
- State North Carolina
- 85 Strongly Landlord-Friendly · R+3
- County
- — inherits STATE
- City
- — inherits STATE
ZIP-level market 27610
- Rents YoY
- 0.2%
- Active inventory
- 594
- Price-to-rent
- 9.9×
Monthly cashflow live
- Estimated rent
- $1,845 high interval (Pro) →
- Mortgage (P&I)
- −$1,148
- Tax from tax record
- −$184 /mo · $2,203/yr
- Insurance
- −$91
- HOA
- −$120
- Vacancy / Maint / Mgmt
- −$388
- Net cashflow
- $-85
Break-even live
Sensitivity live
| Price | -10% $39 | -5% $-23 | +0% $-85 | +5% $-147 | +10% $-209 |
|---|---|---|---|---|---|
| Rent | -10% $-231 | -5% $-158 | +0% $-85 | +5% $-13 | +10% $60 |
| Rate | -1.0pp $25 | -0.5pp $-30 | base $-85 | +0.5pp $-142 | +1.0pp $-200 |
UW: 25.0% down · 7.5% · 30yr · 1.5% tax · 5.0% vac · 8.0% maint · 8.0% mgmt
Financing live
Cash to close
- Down payment
- $54,750
- Closing costs
- $6,570
- Reserves months
- —
- Total cash needed
- —
Loan-product check · same deal, 3 products live
Conventional
25% down · 7.5% · 30yr
- Down + closing
- —
- Monthly P&I
- —
- Monthly cashflow
- —
- DSCR
- —
- Eligible?
- —
Personal DTI + credit; lowest rate.
DSCR
20% down · 8.5% · 30yr
- Down + closing
- —
- Monthly P&I
- —
- Monthly cashflow
- —
- DSCR
- —
- Eligible?
- —
No personal income docs; deal must DSCR.
Hard money
10% down · 12.0% · 12mo
- Down + closing
- —
- Monthly P&I
- —
- Monthly cashflow
- —
- DSCR
- —
- Eligible?
- —
Short-term bridge; refi at stabilization.
Rent comps 23 comps
| Address | Beds | Baths | Sqft | Rent | $/sqft | DOM | Units | Dist |
|---|---|---|---|---|---|---|---|---|
| 1611 Royal Foxhound Ln Raleigh, NC | 2.0–4.0 | 2.0 | 1214 | $1,597 | $1.32 | 3d | 31 | 0.16mi |
| 2321 Stoney Spring Dr Raleigh, NC | 1.0–2.0 | 1.0–2.0 | 879 | $1,541 | $1.75 | 3d | 103 | 0.40mi |
| 2411 Aurora Cove Ct Raleigh, NC | 1.0–3.0 | 1.0–2.0 | 1001 | $1,952 | $1.95 | 3d | 12 | 0.50mi |
| 825 Rawls Dr Raleigh, NC | 3.0 | 2.0 | 1500 | $1,845 | $1.23 | 14d | 1 | 0.91mi |
| 825 Rawls Dr Raleigh, NC | 3.0 | 2.0 | 1500 | $1,845 | $1.23 | 22d | 1 | 0.91mi |
| 2012 Winston Diamond Ct Raleigh, NC | 3.0 | 2.5 | 1369 | $1,830 | $1.34 | 25d | 1 | 0.95mi |
| 838 Oak Center Dr Raleigh, NC | 3.0 | 2.5 | 1463 | $1,995 | $1.36 | 25d | 1 | 1.09mi |
| 737 Southgate Dr Raleigh, NC | 3.0 | 2.5 | 1332 | $1,845 | $1.39 | 5d | 1 | 1.12mi |
| 2540 Bluffs View Dr Raleigh, NC | 1.0–3.0 | 1.0–2.0 | 993 | $1,752 | $1.76 | 25d | 1 | 1.13mi |
| 802 Star Ridge Dr Raleigh, NC | 3.0 | 2.5 | 1447 | $1,800 | $1.24 | 18d | 1 | 1.14mi |
| 804 Oak Center Dr Raleigh, NC | 3.0 | 2.5 | 1447 | $1,900 | $1.31 | 20d | 1 | 1.15mi |
| 3369 Bridgeville Rd Raleigh, NC | 3.0 | 2.5 | 1200 | $1,699 | $1.42 | 5d | 1 | 1.28mi |
| 3108 Woodpecker Ct Raleigh, NC | 2.0 | 2.0 | 934 | $1,400 | $1.50 | 22d | 1 | 1.29mi |
| 503 Erie Rd Unit 503 Raleigh, NC | 3.0 | 2.5 | 1470 | $1,650 | $1.12 | 16d | 1 | 1.31mi |
| 709 Glenbrook Dr Raleigh, NC | 3.0 | 1.0 | 1185 | $1,550 | $1.31 | 25d | 1 | 1.33mi |
| 2112 Walnut Bluffs Ln Raleigh, NC | 3.0 | 2.5 | 1189 | $1,495 | $1.26 | 14d | 1 | 1.33mi |
| 832 Brigham Rd Raleigh, NC | 3.0 | 1.5 | 1107 | $1,595 | $1.44 | 25d | 1 | 1.37mi |
| 1208 Haybrook Ln Unit 102 Raleigh, NC | 3.0 | 2.5 | 1300 | $1,695 | $1.30 | 25d | 1 | 1.38mi |
| 1208 Haybrook Ln Raleigh, NC | 3.0 | 3.0 | 1300 | $1,695 | $1.30 | 25d | 1 | 1.38mi |
| 1423 Tamarino Dr Raleigh, NC | 3.0 | 2.5 | 1400 | $1,895 | $1.35 | 18d | 1 | 1.42mi |
| 2804 Donovan Pl Raleigh, NC | 3.0 | 1.5 | 1125 | $1,697 | $1.51 | 14d | 1 | 1.46mi |
| 2292 Fox Ridge Manor Rd Raleigh, NC | 2.0–3.0 | 1.5–2.5 | 1124 | $1,750 | $1.56 | 14d | 1 | 1.46mi |
| 1622 Proctor Rd Raleigh, NC | 2.0–3.0 | 1.0 | 829 | $1,505 | $1.81 | 5d | 6 | 1.50mi |
HOA detail
- Monthly dues
- $120 · $1,440/yr
- Likely covers
- gas
Listing history 38 events
-
2026-06-21days on market $219,000 Active 132 DOM
-
2026-06-18days on market $219,000 Active 129 DOM
-
2026-06-17days on market $219,000 Active 128 DOM
-
2026-06-16days on market $219,000 Active 127 DOM
-
2026-06-15days on market $219,000 Active 126 DOM
-
2026-06-13days on market $219,000 Active 124 DOM
-
2026-06-13days on market $219,000 Active 123 DOM
-
2026-06-09days on market $219,000 Active 120 DOM
-
2026-06-08days on market $219,000 Active 119 DOM
-
2026-06-07days on market $219,000 Active 118 DOM
-
2026-06-05days on market $219,000 Active 115 DOM
-
2026-06-03days on market $219,000 Active 114 DOM
-
2026-06-02days on market $219,000 Active 113 DOM
-
2026-06-01days on market $219,000 Active 112 DOM
-
2026-05-31days on market $219,000 Active 111 DOM
-
2026-05-06price $219,000
-
2026-04-18price $229,000
-
2026-03-26price $234,000
-
2026-02-09$237,000 Active
-
2024-09-15historical $1,695
-
2024-08-29$1,695
-
2024-08-02historical $1,745
-
2024-07-18price $1,745
-
2024-07-06historical
-
2024-06-30$1,795
-
2024-05-09$289,900 Active
-
2023-12-11price $98,756
-
2022-08-31soldstatus $265,000 Closed
-
2022-08-31soldstatus $265,000
-
2022-08-02status Pending
-
2022-07-27$249,900 Active
-
2011-04-21historical
-
2010-12-20$90,000
-
2010-12-20historical
-
2010-01-20$89,999
-
2009-04-14historical
-
2003-01-20price $143,900
-
2002-07-11$98,756
ⓘ Source: listings_history table (triggers on properties + properties_extension) + one-shot
backfill from property_details.listing_events for pre-trigger history.
Tax reassessment forecast NC · Resets to sale price
- Current annual tax
- $2,203 · $184/mo
- Projected year-2 tax
- $2,203 · $184/mo
- Expected delta
- $0/yr ($0/mo · 0.0%)
ⓘ Screening estimate from a state-policy table — verify with the county assessor before closing.
Climate risk First Street
- Flood 1/10 Low FEMA zone X (unshaded) · 0% chance over 30 yrs
- Wildfire 3/10 Moderate
- Heat 6/10 Major 7 d/yr ≥105°F today · 17 d/yr by 30 yrs out
- Wind 6/10 Major 58% chance of damaging wind over 30 yrs
- Air quality 3/10 Moderate 2 unhealthy d/yr today · 2 by 30 yrs out
Nearby sold comps map
Loading sold comps map…
Walkable amenities ~0.75 mi
Loading nearby amenities…
Taxation est. · year 1
- Rental income
- $22,145
- − Mortgage interest
- −$12,267
- − Property taxes
- −$2,203
- − Insurance
- −$1,095
- − Repairs & maintenance
- −$1,772
- − Management
- −$1,772
- − HOA
- −$1,440
- − Depreciation
- −$6,371
- Taxable loss
- −$4,775
- Est. tax savings @ 24.0%
- +$1,146
- After-tax cash flow
- $121/yr
For passive investors: Depreciation is non-cash, so a rental often shows a tax loss while cash-flowing — sheltering income. Rental losses are passive: they offset passive income freely, and up to $25,000/yr can offset ordinary (W-2) income if you actively participate and your MAGI is under $100k (phasing out to $0 by $150k); unused losses carry forward. On sale, claimed depreciation is recaptured at up to 25%, and gains may owe capital-gains tax (a 1031 exchange can defer both). Figures are a year-1 estimate at your 24.0% rate — not tax advice; consult a CPA.
Schools (NCES district)
- District
- Wake County Schools
- NCES district ID
- 3704720
- Math proficiency
- 52% ▲ 2.00%
- Reading proficiency
- 60% ▲ 4.00%
- Median HH income
- $67,509
- Composite
- 49.41/100
- National rank
- #2010
- State rank
- #35 of 178 in NC
Livability — Raleigh
- Score
- 83/100
- State rank
- #10
- US rank
- #1028
Category grades
Schools grade is shown separately in the Schools card above.
Census & demographics
- Census place
- Raleigh, NC
- County
- Wake County · 1,216,256 people
- City population
- 569,344
- Metro
- Raleigh-Cary, NC
- Population (ZIP)
- 81,419
- Household income
- $67,932
- Rent vs Own
- Severe rent burden
- 3499.0
Population outlook (Wake County) Hauer SSP2
- Today (2025)
- 1,293,152 people
- By 2030
- 1,428,223 · +10.4%
- By 2040
- 1,698,188 · +31.3%
- By 2050
- 1,955,807 · +51.2%
- By 2075
- 2,520,273 · +94.9%
- By 2100
- 2,893,335 · +123.7%
Race, ethnicity, and origin ACS 2023
- Neighborhood character
- Diverse neighborhood (Simpson 0.59)
- Race & ethnicity
- Black 59% Hispanic / Latino 20% White 15% Two or more races 8% Asian 1%
- Hispanic origin (detail)
- Mexican 10% Puerto Rican 1% Dominican 1%
- Common ancestry
- Lithuanian 1% Slovak 1% Serbian 1%
- Foreign-born
- 14% · Canada
- Languages at home
- 77% English-only · Spanish 18% Arabic 1% French/Haitian/Cajun 1%
Political lean MEDSL · Wake
- 2024 margin
- Strong D (+25.5) · D 61.9% · R 36.4% · Other 1.7%
- 2008→2024 swing
- +11.1pp toward D · 2008: 14.4pp · 2024: 25.5pp
- All cycles
- 2024: D+25.5 2020: D+26.4 2016: D+20.5 2012: D+10.2 2008: D+14.4
Not yet ingested
- Civics
- —
Market trends
- HPI YoY
- ▼ -131.88%
- Current HPI
- 237.704
- Rent YoY
- ▲ 0.20%
- Metro
- Raleigh-Cary, NC
- State GDP YoY
- ▲ 3.28%
- F500 in state
- 26
Industry mix (Fortune 500 HQ in NC)
| Industry | F500 HQs | Revenue |
|---|---|---|
| Financial Services | 2 | $213B |
|
||
| Retail | 2 | $95B |
|
||
| Industrial Conglomerate | 1 | $38B |
|
||
| Metals / Steel | 1 | $35B |
|
||
| Utilities | 1 | $30B |
|
||
| Industrial Machinery | 1 | $19B |
|
||
Price history
+121.8% since first listed23 events — show timeline
- 2026-05-06 Price Changed $219,000 TMLS
- 2026-04-18 Price Changed $229,000 TMLS
- 2026-03-26 Price Changed $234,000 TMLS
- 2026-02-09 Listed $237,000 TMLS
- 2024-09-15 Rental Removed $1,695 APPFOLIO
- 2024-08-29 Listed for Rent $1,695 APPFOLIO
- 2024-08-02 Rental Removed $1,745 APPFOLIO
- 2024-07-18 Price Changed $1,745 APPFOLIO
- 2024-07-06 Listing Removed — TMLS
- 2024-06-30 Listed for Rent $1,795 APPFOLIO
- 2024-05-09 Listed $289,900 TMLS
- 2023-12-11 Price Changed $98,756 TMLS
- 2022-08-31 Sold (Public Records) $265,000 Public Records
- 2022-08-31 Sold (MLS) $265,000 TMLS
- 2022-08-02 Pending — TMLS
- 2022-07-27 Listed $249,900 TMLS
- 2011-04-21 Listing Removed — TMLS
- 2010-12-20 Listing Removed — TMLS
- 2010-12-20 Listed $90,000 TMLS
- 2010-01-20 Listed $89,999 TMLS
- 2009-04-14 Listing Removed — TMLS
- 2003-01-20 Price Changed $143,900 TMLS
- 2002-07-11 Listed $98,756 TMLS
Property tax history
+6.6%/yrLatest (2025): $2,203 · +0.4% YoY. Source: county tax records.
Cash-flow waterfall
monthlySold comps — $/sqft
last 12 mo · ≤1 miLoading sold comps…