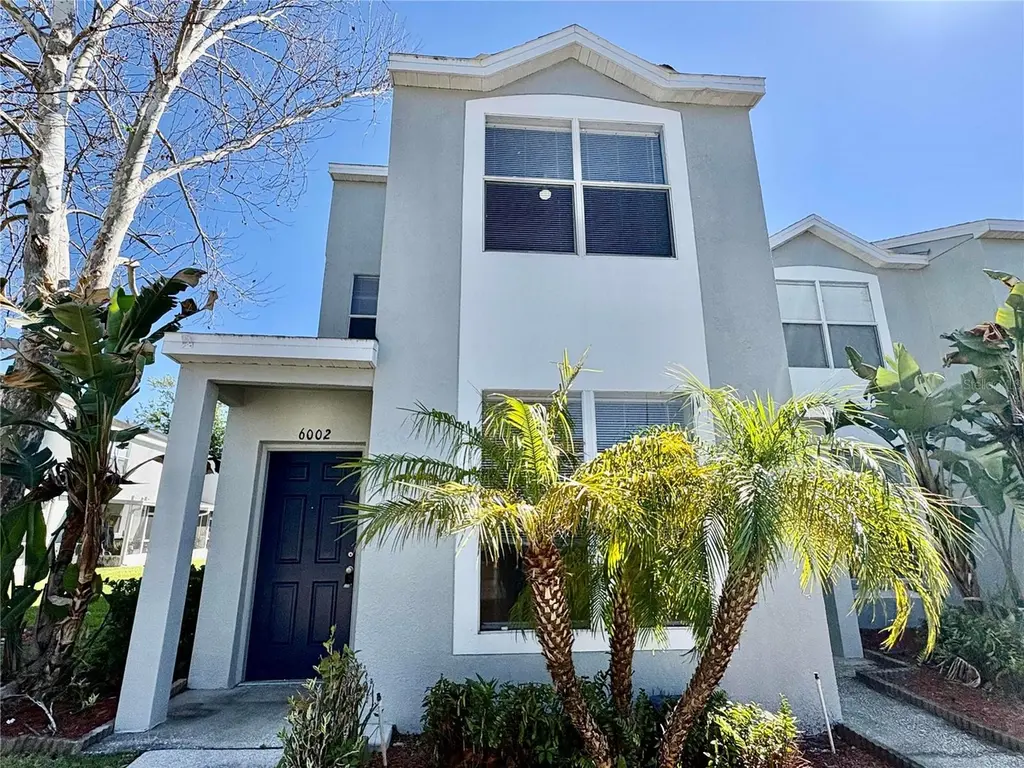
6002 Osprey Lake Cir · Riverview, FL
Flood risk 1/10 · Minimal
- FEMA flood zone
- X (unshaded)
- Chance of flooding over 30 yrs
- 0.0%
- Est. flood insurance / yr
- $507 – $1,088
Fire risk 1/10 · Minimal
- Est. fire insurance / yr
- $947 – $1,759
Heat risk 10/10 · Severe
- Hot days now (above 109°F)
- 7 days/yr
- Hot days in 30 yrs
- 28 days/yr
Wind risk 9/10 · Severe
- Chance of severe wind over 30 yrs
- 99.0%
Air-quality risk 4/10 · Minor
- Unhealthy air days now
- 4 days/yr
- Unhealthy air days in 30 yrs
- 5 days/yr
Risk factors via First Street. Map © Google.
Why this score? — see what drove the D- grade
The composite is a weighted blend of 9 inputs, each scored 0–100. Each bar is that input's sub-score; the figure is the points it added to the 100-point composite (weight × sub-score).
- Cash flow +11.0/30.0
- ARV discount +7.5/15.0
- 1% rule +4.6/10.0
- Schools +4.2/10.0
- Livability +4.0/5.0
- DSCR +3.2/10.0
- Condition / age +2.5/5.0
- Rent growth +2.3/5.0
- Appreciation +0.0/10.0
$229,000
🖨 Deal sheet 📄 Offer letter ✓ Due diligence
Listing remarks
Welcome to your turn-key oasis in the sought-after Osprey Lake community! This stunning home at 6002 Osprey Lake Circle combines modern elegance with everyday functionality. Featuring an open-concept floor plan drenched in natural light, this residence boasts a chef-inspired kitchen with crisp white cabinetry and spacious living areas perfect for entertaining. Retreat to the oversized primary suite or enjoy the Florida sunset from your private screened lanai. Residents of Osprey Lake enjoy a peaceful atmosphere while being minutes away from top-rated dining, shopping, and easy commuter access to I-75 and US-301. No flood insurance required and low HOA! Schedule your private showing today an
Key facts
- $238 HOA
- Community pool
- Built 2002
Neighborhood map
What this means for you Summary
Snapshot
- This is a 3-bed/3.0-bath townhouse listed at $229k.
Deal economics
- At list price, monthly cash flow is $-97 ($-1k/yr) — negative.
- To cash-flow at today's rent, offer at most $212k (7.5% below list).
- To meet the 1% rule (rent ≥ 1% of price), the offer needs to be $219k (4.5% below list).
- Recommended offer: $212k (7.5% below list) — sets the bar for cash-flow.
Location & tenants
- Location reads 79/100 on livability (#134 in FL, #2,000 nationally) — a middle-class / working-renter tenant base. Strengths: housing A+, health & safety A+, employment B+; Watch: amenities F.
- Hillsborough (suburban): math 47% / reading 50% proficiency, ranked #41 of 73 in FL (top 56%) — families likely to look elsewhere, expect single-tenant / working-renter base with shorter leases.
- Zoned schools: Spoto High School (math 25% / reading 36%, grade F, #434 of 667 statewide, top 66%, 1,823 students, 57% FRL).
- Zoned-school proficiency averages 30% at this address vs 48% district-wide (-18 pts) — the specific schools serving this property underperform the Hillsborough average; the district grade overstates school quality for this exact location.
- Market conditions: Rents soft (-0.9%/yr); 559 active listings in the ZIP; 40 comparable units currently listed for rent nearby; rentals at typical pace (median 22d on market — plan ~3-4 weeks tenant-placement turnaround); solid renter incomes; 9,053 units permitted in Hillsborough County in 2024 (4,555 in 5+ unit buildings).
- This rent runs 31% of the median local income ($86k/yr) — at the standard rent-burdened threshold; future hikes will face affordability resistance.
Forward outlook
- Local home prices are declining (-3.0%/yr); year-one equity from $2k of loan paydown is wiped out by about $7k of value loss. Plan a longer hold.
- Hillsborough County population projected at +37% by 2050 — long-run rental-demand tailwind backs the buy-and-hold thesis.
Negotiation context
- It's been on market 18 days — a 2% lower offer ($226k) is reasonable based on typical stale-listing flexibility.
- 4 sale attempts since 2y ago with the ask held roughly flat each time — persistent listings suggest the price (not the market) is what's stuck; bring a comps-based counter.
- Current owner paid $115k; list at $229k implies a 99% gain — meaningful room to come down on a strong offer.
Risks & watch-outs
- Climate carrying-cost: severe wind risk, 99% chance of damaging wind over 30y; extreme-heat days projected 7→28/yr by 2055 (HVAC capex compounding) — expect insurance premiums to compound above CPI over the hold.
Questions for the listing agent
- What do current leases actually rent for vs. the listed asking? Can we see a recent rent roll and the last 12 months of T-12 income?
- What does the HOA fee cover, when was the last increase, and are there any pending special assessments or reserve-fund shortfalls?
- Is there a deadline driving the sale (1031 exchange, divorce, estate, relocation)? That informs how much negotiation room exists.
- Schools are B-rated — typically a magnet for longer-tenancy family renters. What's the average tenant stay here, and is there a school-zone premium baked into asking?
- The area grade is low — what's the realistic commute time and amenity access for the typical tenant pool here? Any planned neighborhood developments (good or bad) we should know about?
- What's the average days-on-market for RENTAL listings here right now (not sales)? A rising rental-DOM trend means longer vacancies and softer asking-rent achievability than the comps imply.
- What's the recent tenant-quality profile in this submarket — average credit score on applications, eviction rate, late-payment / NSF rate, and stable-employment percentage? A property-management company in the area should have these aggregated.
- How much new for-sale + rental construction is in the pipeline within 1–3 miles? Heavy new supply typically softens prices + rents 12–24 months out; constrained supply supports both.
Investment metrics
- 1% rule
- 0.96% ✗
- Cap rate
- 5.79%
- Cash-on-cash
- -1.81%
- DSCR
- 0.92
- GRM
- 8.7
CMA / ARV
No comps found within radius.
Projected returns pro-forma
-3.0% appreciation · 0.0% rent growth · sell at horizon
- IRR
- -23.2%
- Equity multiple
- 0.23×
- Total profit
- $-49,506
- Equity at exit
- $34,145
- IRR
- -31.2%
- Equity multiple
- -0.17×
- Total profit
- $-75,091
- Equity at exit
- $19,800
Cash invested: $64,120 (down + closing). Projections, not guarantees.
Landlord ↔ Tenant lean methodology
- Overall (STATE)
- 87 Strongly Landlord-Friendly
- State Florida
- 87 Strongly Landlord-Friendly · R+3
- County
- — inherits STATE
- City
- — inherits STATE
ZIP-level market 33578
- Home prices YoY
- -12.9%
- Rents YoY
- -0.9%
- Active inventory
- 559
- Price-to-rent
- 8.7×
Monthly cashflow live
- Estimated rent
- $2,188 high interval (Pro) →
- Mortgage (P&I)
- −$1,201
- Tax from tax record
- −$291 /mo · $3,492/yr
- Insurance
- −$95
- HOA
- −$238
- Vacancy / Maint / Mgmt
- −$459
- Net cashflow
- $-97
Break-even live
UW: 25.0% down · 7.5% · 30yr · 1.5% tax · 5.0% vac · 8.0% maint · 8.0% mgmt
Financing live
Cash to close
- Down payment
- $57,250
- Closing costs
- $6,870
- Reserves months
- —
- Total cash needed
- —
Loan-product check · same deal, 3 products live
Conventional
25% down · 7.5% · 30yr
- Down + closing
- —
- Monthly P&I
- —
- Monthly cashflow
- —
- DSCR
- —
- Eligible?
- —
Personal DTI + credit; lowest rate.
DSCR
20% down · 8.5% · 30yr
- Down + closing
- —
- Monthly P&I
- —
- Monthly cashflow
- —
- DSCR
- —
- Eligible?
- —
No personal income docs; deal must DSCR.
Hard money
10% down · 12.0% · 12mo
- Down + closing
- —
- Monthly P&I
- —
- Monthly cashflow
- —
- DSCR
- —
- Eligible?
- —
Short-term bridge; refi at stabilization.
Rent comps 40 comps
| Address | Beds | Baths | Sqft | Rent | $/sqft | DOM | Units | Dist |
|---|---|---|---|---|---|---|---|---|
| 6229 Osprey Lake Cir Riverview, FL | 3.0 | 3.0 | 1412 | $2,000 | $1.42 | 24d | 1 | 0.17mi |
| 6252 Osprey Lake Cir Riverview, FL | 3.0 | 3.0 | 1412 | $1,750 | $1.24 | 24d | 1 | 0.18mi |
| 6252 Osprey Lake Cir Riverview, FL | 3.0 | 3.0 | 1412 | $1,699 | $1.20 | 5d | 1 | 0.18mi |
| 10650 Mystic Seafloor Dr Riverview, FL | 1.0–3.0 | 1.0–2.0 | 1049 | $2,505 | $2.39 | 2d | 29 | 0.19mi |
| 6339 Osprey Lake Cir Riverview, FL | 3.0 | 3.0 | 1412 | $2,000 | $1.42 | 24d | 1 | 0.20mi |
| 5701 Summerall Vista Cir Riverview, FL | 1.0–3.0 | 1.0–2.0 | 1071 | $2,898 | $2.71 | 1d | 25 | 0.28mi |
| 10305 Zackary Cir Riverview, FL | 2.0–3.0 | 2.0 | 1025 | $1,507 | $1.47 | 24d | 8 | 0.28mi |
| 10222 Pink Palmata Ct Riverview, FL | 3.0 | 2.5 | 1750 | $2,300 | $1.31 | 5d | 1 | 0.37mi |
| 2096 Kings Palace Dr Riverview, FL | 3.0 | 2.0 | 1780 | $2,399 | $1.35 | 24d | 1 | 0.44mi |
| 5959 Bandera Springs Cir Riverview, FL | 3.0 | 1.0–2.0 | 1007 | $2,291 | $2.27 | 2d | 25 | 0.51mi |
| 2215 Kings Palace Dr Riverview, FL | 3.0 | 2.0 | 1771 | $2,200 | $1.24 | 24d | 1 | 0.52mi |
| 2215 Kings Palace Dr Riverview, FL | 3.0 | 2.0 | 1771 | $2,200 | $1.24 | 17d | 1 | 0.52mi |
| 10222 River Palencia Ct Riverview, FL | 3.0 | 2.0 | 1401 | $1,850 | $1.32 | 14d | 1 | 0.56mi |
| 10222 River Palencia Ct Riverview, FL | 2.0 | 2.0 | 1401 | $1,850 | $1.32 | 21d | 1 | 0.56mi |
| 6218 Watermark Dr Riverview, FL | 1.0–3.0 | 1.0–2.0 | 1010 | $2,126 | $2.10 | 2d | 25 | 0.56mi |
| 2202 Cattleman Dr Brandon, FL | 3.0 | 2.0 | 1532 | $2,441 | $1.59 | 5d | 1 | 0.60mi |
| 5905 Trace Meadow Loop Riverview, FL | 1.0–3.0 | 1.0–2.0 | 1027 | $2,435 | $2.37 | 2d | 14 | 0.61mi |
| 6623 Summer Haven Dr Riverview, FL | 4.0 | 2.0 | 1337 | $2,300 | $1.72 | 24d | 1 | 0.62mi |
| 2018 Wrangler Dr Brandon, FL | 3.0 | 2.0 | 1527 | $2,300 | $1.51 | 20d | 1 | 0.66mi |
| 2015 Wrangler Dr Brandon, FL | 3.0 | 2.0 | 1660 | $3,000 | $1.81 | 24d | 1 | 0.66mi |
| 6637 Summer Haven Dr Riverview, FL | 4.0 | 2.0 | 1534 | $2,280 | $1.49 | 24d | 1 | 0.66mi |
| 6713 Summer Cove Dr Riverview, FL | 3.0 | 2.0 | 1298 | $2,160 | $1.66 | 5d | 1 | 0.68mi |
| 6215 Cannoli Pl Riverview, FL | 3.0 | 2.0 | 1208 | $2,090 | $1.73 | 2d | 1 | 0.69mi |
| 6719 Summer Cove Dr Riverview, FL | 3.0 | 2.0 | 1298 | $2,240 | $1.73 | 5d | 1 | 0.69mi |
| 6216 Gondola Dr Riverview, FL | 4.0 | 2.0 | 1874 | $2,430 | $1.30 | 24d | 1 | 0.73mi |
| 6708 Summer Haven Dr Riverview, FL | 3.0 | 2.0 | 1330 | $2,135 | $1.61 | 3d | 1 | 0.75mi |
| 6831 Dartmouth Hill St Riverview, FL | 2.0 | 2.5 | 1254 | $1,845 | $1.47 | 24d | 1 | 0.77mi |
| 1802 Durkee Pl Brandon, FL | 4.0 | 2.0 | 1667 | $2,350 | $1.41 | 16d | 1 | 0.77mi |
| 4930 Pond Ridge Dr Riverview, FL | 3.0 | 3.0 | 1654 | $2,165 | $1.31 | 3d | 1 | 0.78mi |
| 4866 Pond Ridge Dr Riverview, FL | 3.0 | 2.5 | 1644 | $2,000 | $1.22 | 24d | 1 | 0.78mi |
| 10840 Johanna Ave Riverview, FL | 3.0 | 2.5 | 1477 | $1,950 | $1.32 | 24d | 1 | 0.83mi |
| 5501 Legacy Crescent Pl Riverview, FL | 1.0–4.0 | 1.0–2.0 | 1120 | $1,819 | $1.62 | 21d | 13 | 0.84mi |
| 6923 Summer Harbor Ln Riverview, FL | 3.0 | 2.0 | 1314 | $1,960 | $1.49 | 5d | 1 | 0.84mi |
| 10831 Johanna Ave Riverview, FL | 4.0 | 3.0 | 1708 | $2,200 | $1.29 | 14d | 1 | 0.85mi |
| 10854 Lake Saint Charles Blvd Riverview, FL | 3.0 | 2.5 | 1544 | $1,950 | $1.26 | 21d | 1 | 0.87mi |
| 4754 Pond Ridge Dr Riverview, FL | 3.0 | 2.5 | 1790 | $2,400 | $1.34 | 24d | 1 | 0.88mi |
| 5611 Legacy Crescent Pl #304 Riverview, FL | 2.0 | 2.0 | 1068 | $1,500 | $1.40 | 14d | 1 | 0.89mi |
| 2482 Sagemont Dr Brandon, FL | 3.0 | 2.0 | 1254 | $1,850 | $1.48 | 24d | 1 | 0.89mi |
| 4744 Pond Ridge Dr Riverview, FL | 3.0 | 2.5 | 1796 | $2,000 | $1.11 | 24d | 1 | 0.90mi |
| 10124 Cannon Dr Riverview, FL | 4.0 | 2.0 | 1796 | $2,450 | $1.36 | 24d | 1 | 0.90mi |
HOA detail
- Monthly dues
- $238 · $2,856/yr
Listing history 12 events
-
2026-04-21status Pending
-
2026-04-03$229,000 Active
-
2025-07-22historical
-
2025-04-29price $268,500
-
2025-03-07$279,900 Active
-
2024-12-17historical $1,845
-
2024-12-15price $1,845
-
2024-12-06price $1,945
-
2024-11-27$1,995
-
2024-11-17historical $1,995
-
2024-11-08$1,995
-
2003-10-02soldstatus $115,000
ⓘ Source: listings_history table (triggers on properties + properties_extension) + one-shot
backfill from property_details.listing_events for pre-trigger history.
Tax reassessment forecast FL · Resets to sale price
- Current annual tax
- $3,492 · $291/mo
- Projected year-2 tax
- $3,492 · $291/mo
- Expected delta
- $0/yr ($0/mo · 0.0%)
ⓘ Screening estimate from a state-policy table — verify with the county assessor before closing.
Climate risk First Street
- Flood 1/10 Low FEMA zone X (unshaded) · 0% chance over 30 yrs
- Wildfire 1/10 Low
- Heat 10/10 Extreme 7 d/yr ≥109°F today · 28 d/yr by 30 yrs out
- Wind 9/10 Extreme 99% chance of damaging wind over 30 yrs
- Air quality 4/10 Moderate 4 unhealthy d/yr today · 5 by 30 yrs out
Nearby sold comps map
Loading sold comps map…
Walkable amenities ~0.75 mi
Loading nearby amenities…
Taxation est. · year 1
- Rental income
- $26,255
- − Mortgage interest
- −$12,828
- − Property taxes
- −$3,492
- − Insurance
- −$1,145
- − Repairs & maintenance
- −$2,100
- − Management
- −$2,100
- − HOA
- −$2,856
- − Depreciation
- −$6,662
- Taxable loss
- −$4,928
- Est. tax savings @ 24.0%
- +$1,183
- After-tax cash flow
- $21/yr
For passive investors: Depreciation is non-cash, so a rental often shows a tax loss while cash-flowing — sheltering income. Rental losses are passive: they offset passive income freely, and up to $25,000/yr can offset ordinary (W-2) income if you actively participate and your MAGI is under $100k (phasing out to $0 by $150k); unused losses carry forward. On sale, claimed depreciation is recaptured at up to 25%, and gains may owe capital-gains tax (a 1031 exchange can defer both). Figures are a year-1 estimate at your 24.0% rate — not tax advice; consult a CPA.
Schools (NCES district)
- District
- Hillsborough
- NCES district ID
- 1200870
- Math proficiency
- 47% ▼ -8.00%
- Reading proficiency
- 50% ▼ -4.00%
- Median HH income
- $50,622
- Composite
- 41.6/100
- National rank
- #3435
- State rank
- #41 of 73 in FL
Livability — Riverview
- Score
- 79/100
- State rank
- #134
- US rank
- #2000
Category grades
Schools grade is shown separately in the Schools card above.
Census & demographics
- Census place
- Riverview, FL
- County
- Hillsborough County · 1,540,968 people
- City population
- 137,988
- Metro
- Tampa-St. Petersburg-Clearwater, FL
- Population (ZIP)
- 60,651
- Household income
- $85,921
- Rent vs Own
- Severe rent burden
- 3063.0
Population outlook (Hillsborough County) Hauer SSP2
- Today (2025)
- 1,607,022 people
- By 2030
- 1,733,968 · +7.9%
- By 2040
- 1,979,565 · +23.2%
- By 2050
- 2,203,427 · +37.1%
- By 2075
- 2,667,893 · +66.0%
- By 2100
- 2,891,558 · +79.9%
Race, ethnicity, and origin ACS 2023
- Neighborhood character
- Diverse neighborhood (Simpson 0.69)
- Race & ethnicity
- White 43% Hispanic / Latino 26% Black 23% Two or more races 17% Asian 3%
- Hispanic origin (detail)
- Mexican 4% Puerto Rican 8% Cuban 3% Dominican 4%
- Common ancestry
- Romanian 3% Hispanic 3% Lithuanian 2%
- Foreign-born
- 14% · Canada, Jamaica, China
- Languages at home
- 73% English-only · Spanish 19% French/Haitian/Cajun 3% Other Indo-European 2%
Political lean MEDSL · Hillsborough
- 2024 margin
- Toss-up / Even · D 47.8% · R 50.9% · Other 1.3%
- 2008→2024 swing
- -10.2pp toward R · 2008: 7.1pp · 2024: -3.1pp
- All cycles
- 2024: R+3.1 2020: D+6.9 2016: D+6.8 2012: D+6.7 2008: D+7.1
Not yet ingested
- Civics
- —
Market trends
- HPI YoY
- ▼ -48.42%
- Current HPI
- 326.0368
- Rent YoY
- ▼ -0.95%
- Metro
- Tampa-St. Petersburg-Clearwater, FL
- State GDP YoY
- ▲ 3.28%
- F500 in state
- 36
Industry mix (Fortune 500 HQ in FL)
| Industry | F500 HQs | Revenue |
|---|---|---|
| Industrial Technology | 2 | $29B |
|
||
| Insurance | 2 | $17B |
|
||
| Retail | 1 | $60B |
|
||
| Technology Distribution | 1 | $58B |
|
||
| Homebuilding | 1 | $35B |
|
||
| Technology Manufacturing | 1 | $35B |
|
||
Price history
+99.1% since first listed12 events — show timeline
- 2026-04-21 Pending — Stellar MLS as Distributed by MLS Grid
- 2026-04-03 Listed $229,000 Stellar MLS as Distributed by MLS Grid
- 2025-07-22 Listing Removed — Stellar MLS as Distributed by MLS Grid
- 2025-04-29 Price Changed $268,500 Stellar MLS as Distributed by MLS Grid
- 2025-03-07 Listed $279,900 Stellar MLS as Distributed by MLS Grid
- 2024-12-17 Rental Removed $1,845 RENTALBEAST
- 2024-12-15 Price Changed $1,845 RENTALBEAST
- 2024-12-06 Price Changed $1,945 RENTALBEAST
- 2024-11-27 Listed for Rent $1,995 RENTALBEAST
- 2024-11-17 Rental Removed $1,995 RENTALBEAST
- 2024-11-08 Listed for Rent $1,995 RENTALBEAST
- 2003-10-02 Sold (Public Records) $115,000 Public Records
Property tax history
+12.0%/yrLatest (2025): $3,492 · +12.0% YoY. Source: county tax records.
Cash-flow waterfall
monthlySold comps — $/sqft
last 12 mo · ≤1 miLoading sold comps…