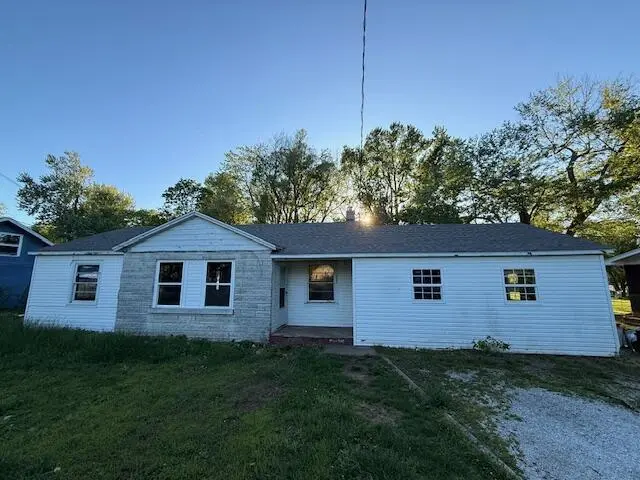
639 S Old Orchard Ave · Springfield, MO
Flood risk 1/10 · Minimal
- FEMA flood zone
- X (unshaded)
- Chance of flooding over 30 yrs
- 0.0%
- Est. flood insurance / yr
- $507 – $1,088
Fire risk 2/10 · Minimal
- Est. fire insurance / yr
- $1,054 – $1,958
Heat risk 5/10 · Moderate
- Hot days now (above 104°F)
- 6 days/yr
- Hot days in 30 yrs
- 16 days/yr
Wind risk 2/10 · Minimal
- Chance of severe wind over 30 yrs
- 0.0%
Air-quality risk 2/10 · Minimal
- Unhealthy air days now
- 2 days/yr
- Unhealthy air days in 30 yrs
- 2 days/yr
Risk factors via First Street. Map © Google.
Why this score? — see what drove the B grade
The composite is a weighted blend of 9 inputs, each scored 0–100. Each bar is that input's sub-score; the figure is the points it added to the 100-point composite (weight × sub-score).
- Cash flow +27.9/30.0
- ARV discount +15.0/15.0
- DSCR +9.9/10.0
- 1% rule +6.9/10.0
- Livability +3.8/5.0
- Rent growth +3.7/5.0
- Schools +3.2/10.0
- Condition / age +2.5/5.0
- Appreciation +0.0/10.0
$119,000
🖨 Deal sheet 📄 Offer letter ✓ Due diligence
Listing remarks MLS
Fixer-upper with upside in Springfield! 3 bed, 1 bath with newer roof and central heat already in place. Property needs full cosmetic renovation but has strong potential for resale or rental. Good lot with a nice backyard. Priced to reflect condition--don't miss this value-add opportunity!
Key facts
- Central heat
- Newer roof
- 0.53 acre lot
Tags
Neighborhood map
What this means for you Summary
Snapshot
- This is a 3-bed/1.0-bath single-family listed at $119k.
Deal economics
- At list price, monthly cash flow is $366 ($4k/yr) — positive.
- The deal already cash-flows at list — no discount required.
- Meets the 1% rule at list price ($1k rent vs $119k).
- Recommended offer: $117k (1.5% below list) — sets the bar for market timing.
- Cap rate 10.0% vs local median 4.6% in Springfield — top-decile yield for the area; either an underpriced asset or a hidden risk that comps aren't pricing in. Stress-test before assuming the spread holds.
Location & tenants
- Location reads 75/100 on livability (#57 in MO, #4,121 nationally) — a middle-class / working-renter tenant base. Strengths: commute A+, cost of living A+, housing A+; Watch: crime F, employment F.
- Springfield R-XII (urban): math 32% / reading 46% proficiency, ranked #174 of 324 in MO (top 54%) — families likely to look elsewhere, expect single-tenant / working-renter base with shorter leases.
- Market conditions: Rents rising fast (+4.8%/yr); 512 active listings in the ZIP; 19 comparable units currently listed for rent nearby; rentals at typical pace (median 23d on market — plan ~3-4 weeks tenant-placement turnaround); 47% of comp listings sitting > 30 days — soft ceiling on asking rent; 1,302 units permitted in Greene County in 2024 (250 in 5+ unit buildings).
- This rent runs 31% of the median local income ($55k/yr) — at the standard rent-burdened threshold; future hikes will face affordability resistance.
Forward outlook
- Local home prices are declining (-3.0%/yr); year-one equity from $823 of loan paydown is wiped out by about $4k of value loss. Plan a longer hold.
- Greene County population projected at +25% by 2050 — long-run rental-demand tailwind backs the buy-and-hold thesis.
- At projected returns (-3.0% appreciation + 4.8% rent growth), your $33k cash investment doubles in ~8 years — after that, you're playing with house money.
Negotiation context
- It's been on market 16 days — a 2% lower offer ($117k) is reasonable based on typical stale-listing flexibility.
Risks & watch-outs
- Watch-outs: built in 1948 — expect roof / HVAC / electrical / plumbing capex.
- Climate carrying-cost: extreme-heat days projected 6→16/yr by 2055 (HVAC capex compounding) — expect insurance premiums to compound above CPI over the hold.
Questions for the listing agent
- Built in 1948 — when were the roof, HVAC, electrical panel, plumbing, and water heater last replaced?
- Is there a deadline driving the sale (1031 exchange, divorce, estate, relocation)? That informs how much negotiation room exists.
- Crime grade is F in this area — have there been break-ins, vandalism, or insurance claims at this property in the last 3 years? What carrier currently insures it and at what premium?
- What's the average days-on-market for RENTAL listings here right now (not sales)? A rising rental-DOM trend means longer vacancies and softer asking-rent achievability than the comps imply.
- What's the recent tenant-quality profile in this submarket — average credit score on applications, eviction rate, late-payment / NSF rate, and stable-employment percentage? A property-management company in the area should have these aggregated.
- How much new for-sale + rental construction is in the pipeline within 1–3 miles? Heavy new supply typically softens prices + rents 12–24 months out; constrained supply supports both.
Investment metrics
- 1% rule
- 1.19% ✓
- Cap rate
- 9.99%
- Cash-on-cash
- 13.19%
- DSCR
- 1.59
- GRM
- 7.0
CMA / ARV
- ARV (median comp)
- $173,483
- List price
- $119,000
- Delta
- -31.41%
- Verdict
- UNDERPRICED
- Comps
- 20 within 1.0 mi
Show comp detail 12 sales within ~0.75 mi
| Address | Dist | Beds/Ba | Sqft | Sold | Price | $/sf | Match |
|---|---|---|---|---|---|---|---|
| 639 S Old Orchard Ave | 0.00mi | 3/1.0 | 1,272 (0%) | 1mo | $119,000 | $94 | 100 |
| 2918 E Monroe Ter | 0.25mi | 3/1.5 | 1,229 (-3%) | 2mo | $209,000 | $170 | 79 |
| 514 S Prince Ln | 0.31mi | 3/1.5 | 1,316 (+4%) | 2mo | $220,000 | $167 | 76 |
| 2626 E Elm St | 0.23mi | 4/2.0 (+1) | 1,248 (-2%) | 4mo | $199,500 | $160 | 74 |
| 620 S Belcrest Ave | 0.30mi | 3/1.0 | 1,160 (-9%) | 2mo | $94,900 | $82 | 69 |
| 510 S Burton Ave | 0.20mi | 3/2.0 | 1,152 (-9%) | 3mo | $199,900 | $174 | 68 |
| 217 N Ken Ave | 0.50mi | 3/1.5 | 1,188 (-7%) | 2mo | $200,000 | $168 | 62 |
| 1033 S Paula Ave | 0.68mi | 3/1.5 | 1,309 (+3%) | 1mo | $189,500 | $145 | 61 |
| 209 S Burton Ave | 0.47mi | 2/1.0 (-1) | 1,168 (-8%) | 2mo | $129,000 | $110 | 58 |
| 2965 E Belmont St | 0.44mi | 3/2.0 | 1,385 (+9%) | 3mo | $269,900 | $195 | 58 |
| 2212 E Cherry St | 0.66mi | 3/2.0 | 1,200 (-6%) | 3mo | $181,000 | $151 | 53 |
| 1027 S Karla Ave | 0.54mi | 3/2.0 | 1,437 (+13%) | 1mo | $257,900 | $179 | 48 |
Match score weights: distance 35% · size 25% · config 20% · recency 20%. Top-matched comps best support the ARV.
Projected returns pro-forma
-3.0% appreciation · 4.82% rent growth · sell at horizon
- IRR
- 5.1%
- Equity multiple
- 1.20×
- Total profit
- $6,671
- Equity at exit
- $17,743
- IRR
- 16.0%
- Equity multiple
- 2.41×
- Total profit
- $47,052
- Equity at exit
- $10,289
Cash invested: $33,320 (down + closing). Projections, not guarantees.
Landlord ↔ Tenant lean methodology
- Overall (STATE)
- 81 Strongly Landlord-Friendly
- State Missouri
- 81 Strongly Landlord-Friendly · R+10
- County
- — inherits STATE
- City
- — inherits STATE
ZIP-level market 65802
- Home prices YoY
- -31.9%
- Rents YoY
- 4.8%
- Active inventory
- 512
- Price-to-rent
- 7.0×
Monthly cashflow live
- Estimated rent
- $1,422 high interval (Pro) →
- Mortgage (P&I)
- −$624
- Tax from tax record
- −$83 /mo · $998/yr
- Insurance
- −$50
- HOA
- −$0
- Vacancy / Maint / Mgmt
- −$299
- Net cashflow
- $366
Break-even live
UW: 25.0% down · 7.5% · 30yr · 1.5% tax · 5.0% vac · 8.0% maint · 8.0% mgmt
Financing live
Cash to close
- Down payment
- $29,750
- Closing costs
- $3,570
- Reserves months
- —
- Total cash needed
- —
Loan-product check · same deal, 3 products live
Conventional
25% down · 7.5% · 30yr
- Down + closing
- —
- Monthly P&I
- —
- Monthly cashflow
- —
- DSCR
- —
- Eligible?
- —
Personal DTI + credit; lowest rate.
DSCR
20% down · 8.5% · 30yr
- Down + closing
- —
- Monthly P&I
- —
- Monthly cashflow
- —
- DSCR
- —
- Eligible?
- —
No personal income docs; deal must DSCR.
Hard money
10% down · 12.0% · 12mo
- Down + closing
- —
- Monthly P&I
- —
- Monthly cashflow
- —
- DSCR
- —
- Eligible?
- —
Short-term bridge; refi at stabilization.
Rent comps 19 comps
| Address | Beds | Baths | Sqft | Rent | $/sqft | DOM | Units | Dist |
|---|---|---|---|---|---|---|---|---|
| 3080 E Cherry St Unit F104-ADA Springfield, MO | 3.0 | 2.0 | 1030 | $1,500 | $1.46 | 23d | 1 | 0.42mi |
| 3080 E Cherry St Unit H104-ADA Springfield, MO | 3.0 | 2.0 | 1030 | $1,565 | $1.52 | 43d | 1 | 0.42mi |
| 531 N Oak Grove Ave Springfield, MO | 2.0 | 1.5 | 1184 | $925 | $0.78 | 43d | 1 | 0.73mi |
| 2154 E Cairo St Springfield, MO | 3.0 | 2.0 | 1100 | $1,395 | $1.27 | 43d | 1 | 0.79mi |
| 3501 E Lombard St Springfield, MO | 1.0–3.0 | 1.0–2.0 | 800 | $1,065 | $1.33 | 43d | 1 | 0.98mi |
| 3440 E Lombard St Unit 129 Springfield, MO | 2.0 | 1.5 | 900 | $875 | $0.97 | 23d | 1 | 0.99mi |
| 3440 E Lombard St Unit 110 Springfield, MO | 2.0 | 1.5 | 900 | $875 | $0.97 | 43d | 1 | 0.99mi |
| 2765 E Verona St Springfield, MO | 3.0 | 2.0 | 1244 | $1,600 | $1.29 | 43d | 1 | 1.03mi |
| 2641 E Verona St Springfield, MO | 3.0 | 2.0 | 1293 | $1,750 | $1.35 | 23d | 1 | 1.05mi |
| 1225 S Ingram Mill Rd Springfield, MO | 1.0–2.0 | 1.0–2.0 | 1150 | $2,345 | $2.04 | 13d | 4 | 1.08mi |
| 2804 E Linwood St Springfield, MO | 3.0 | 2.0 | 1400 | $1,650 | $1.18 | 13d | 1 | 1.20mi |
| 2146 E Bennett St Unit 0 Springfield, MO | 2.0 | 1.0 | 1009 | $895 | $0.89 | 43d | 1 | 1.20mi |
| 3700 E Cherry St Springfield, MO | 2.0 | 2.0 | 1527 | $2,000 | $1.31 | 13d | 1 | 1.24mi |
| 1528 S Catalina Ave Springfield, MO | 3.0 | 1.0 | 1326 | $1,440 | $1.09 | 43d | 1 | 1.27mi |
| 726 S Kentwood Ave Springfield, MO | 2.0 | 1.0 | 1116 | $1,295 | $1.16 | 13d | 1 | 1.27mi |
| 2831 E University St Springfield, MO | 2.0 | 1.0 | 975 | $1,095 | $1.12 | 23d | 1 | 1.35mi |
| 2831 E University St Springfield, MO | 2.0 | 1.0 | 950 | $1,195 | $1.26 | 13d | 1 | 1.35mi |
| 1603 S Saint Charles Ave Springfield, MO | 3.0 | 2.0 | 1452 | $1,695 | $1.17 | 43d | 1 | 1.39mi |
| 2149 E Sunshine St Springfield, MO | 1.0–2.0 | 1.0–1.5 | 671 | $1,453 | $2.17 | 13d | 20 | 1.45mi |
Listing history 3 events
-
2026-05-05status Pending 290-char remark
Show marketing remark (290 chars)
Fixer-upper with upside in Springfield! 3 bed, 1 bath with newer roof and central heat already in place. Property needs full cosmetic renovation but has strong potential for resale or rental. Good lot with a nice backyard. Priced to reflect condition--don't miss this value-add opportunity!
-
2026-04-20$119,000 Active 290-char remark
Show marketing remark (290 chars)
Fixer-upper with upside in Springfield! 3 bed, 1 bath with newer roof and central heat already in place. Property needs full cosmetic renovation but has strong potential for resale or rental. Good lot with a nice backyard. Priced to reflect condition--don't miss this value-add opportunity!
-
2012-08-21soldstatus
ⓘ Source: listings_history table (triggers on properties + properties_extension) + one-shot
backfill from property_details.listing_events for pre-trigger history.
Tax reassessment forecast MO · Resets to sale price
- Current annual tax
- $998 · $83/mo
- Projected year-2 tax
- $1,154 · $96/mo
- Expected delta
- +$156/yr (+$13/mo · 15.7%)
ⓘ Screening estimate from a state-policy table — verify with the county assessor before closing.
Climate risk First Street
- Flood 1/10 Low FEMA zone X (unshaded) · 0% chance over 30 yrs
- Wildfire 2/10 Low
- Heat 5/10 Major 6 d/yr ≥104°F today · 16 d/yr by 30 yrs out
- Wind 2/10 Low 0% chance of damaging wind over 30 yrs
- Air quality 2/10 Low 2 unhealthy d/yr today · 2 by 30 yrs out
Nearby sold comps map
Loading sold comps map…
Walkable amenities ~0.75 mi
Loading nearby amenities…
Taxation est. · year 1
- Rental income
- $17,058
- − Mortgage interest
- −$6,666
- − Property taxes
- −$998
- − Insurance
- −$595
- − Repairs & maintenance
- −$1,365
- − Management
- −$1,365
- − Depreciation
- −$3,462
- Taxable income
- $2,608
- Est. tax owed @ 24.0%
- −$626
- After-tax cash flow
- $3,768/yr
For passive investors: Depreciation is non-cash, so a rental often shows a tax loss while cash-flowing — sheltering income. Rental losses are passive: they offset passive income freely, and up to $25,000/yr can offset ordinary (W-2) income if you actively participate and your MAGI is under $100k (phasing out to $0 by $150k); unused losses carry forward. On sale, claimed depreciation is recaptured at up to 25%, and gains may owe capital-gains tax (a 1031 exchange can defer both). Figures are a year-1 estimate at your 24.0% rate — not tax advice; consult a CPA.
Schools (NCES district)
- District
- Springfield R-XII
- NCES district ID
- 2928860
- Math proficiency
- 32% ▼ -2.00%
- Reading proficiency
- 46% ▼ -3.00%
- Median HH income
- $37,886
- Composite
- 32.45/100
- National rank
- #5717
- State rank
- #174 of 324 in MO
Livability — Springfield
- Score
- 75/100
- State rank
- #57
- US rank
- #4121
Category grades
Schools grade is shown separately in the Schools card above.
Census & demographics
- Census place
- Springfield, MO
- County
- Greene County · 244,327 people
- City population
- 223,044
- Metro
- Springfield, MO
- Population (ZIP)
- 46,739
- Household income
- $55,019
- Rent vs Own
- Severe rent burden
- 1818.0
Population outlook (Greene County) Hauer SSP2
- Today (2025)
- 319,054 people
- By 2030
- 335,135 · +5.0%
- By 2040
- 366,186 · +14.8%
- By 2050
- 397,431 · +24.6%
- By 2075
- 477,035 · +49.5%
- By 2100
- 520,828 · +63.2%
Race, ethnicity, and origin ACS 2023
- Neighborhood character
- Predominantly White (81%)
- Race & ethnicity
- White 81% Two or more races 8% Hispanic / Latino 5% Black 4% Asian 2%
- Common ancestry
- Slovak 2% Lithuanian 2% Italian 2%
- Foreign-born
- 3% · Canada, Vietnam
- Languages at home
- 95% English-only · Spanish 2% Vietnamese 1% Other Indo-European 1%
Political lean MEDSL · Greene
- 2024 margin
- Strong R (+20.8) · D 38.9% · R 59.7% · Other 1.4%
- 2008→2024 swing
- -5.0pp toward R · 2008: -15.8pp · 2024: -20.8pp
- All cycles
- 2024: R+20.8 2020: R+20.1 2016: R+27.4 2012: R+24.4 2008: R+15.8
Not yet ingested
- Civics
- —
Market trends
- HPI YoY
- ▼ -99.72%
- Current HPI
- 212.9826
- Rent YoY
- ▲ 4.82%
- Metro
- Springfield, MO
- State GDP YoY
- ▲ 1.84%
- F500 in state
- 20
Industry mix (Fortune 500 HQ in MO)
| Industry | F500 HQs | Revenue |
|---|---|---|
| Healthcare | 1 | $163B |
|
||
| Insurance | 1 | $21B |
|
||
| Industrial Technology | 1 | $17B |
|
||
| Retail | 1 | $16B |
|
||
| Industrial Distribution | 1 | $10B |
|
||
| Utilities | 1 | $9B |
|
||
Price history
3 events — show timeline
- 2026-05-05 Pending — SOMO
- 2026-04-20 Listed $119,000 SOMO
- 2012-08-21 Sold (Public Records) — Public Records
Property tax history
+4.3%/yrLatest (2025): $998 · +11.8% YoY. Source: county tax records.
Cash-flow waterfall
monthlySold comps — $/sqft
last 12 mo · ≤1 miLoading sold comps…