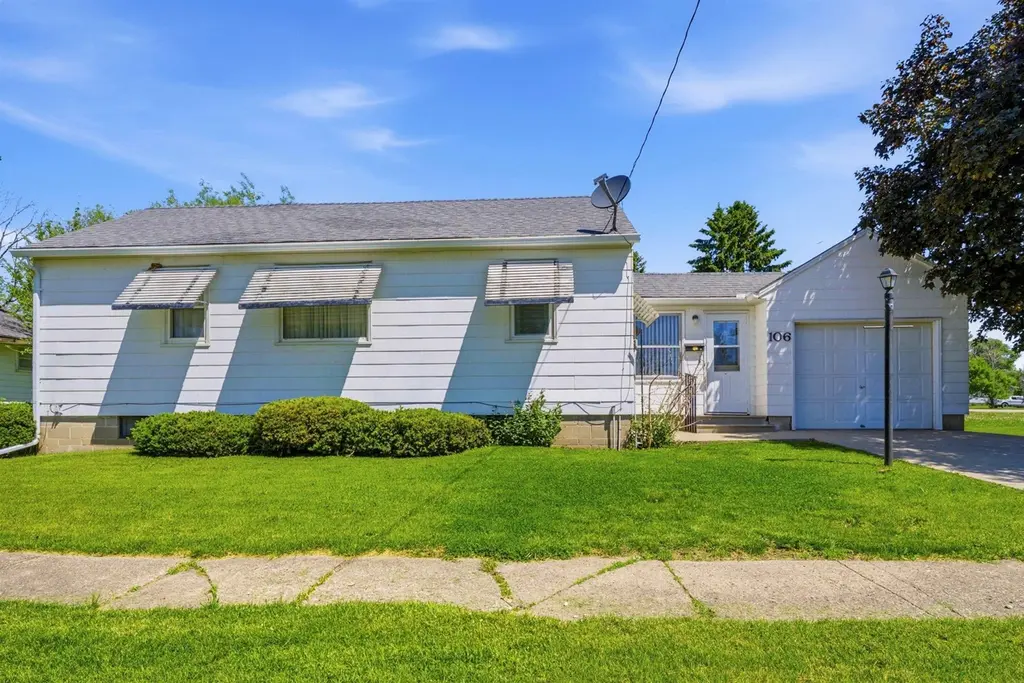
106 2nd Ave · Holland, IA
Flood risk 1/10 · Minimal
- FEMA flood zone
- X (unshaded)
- Chance of flooding over 30 yrs
- 0.0%
- Est. flood insurance / yr
- $473 – $860
Fire risk 2/10 · Minimal
- Est. fire insurance / yr
- $902 – $1,676
Heat risk 3/10 · Minor
- Hot days now (above 100°F)
- 7 days/yr
- Hot days in 30 yrs
- 16 days/yr
Wind risk 2/10 · Minimal
- Chance of severe wind over 30 yrs
- —
Air-quality risk 1/10 · Minimal
- Unhealthy air days now
- 0 days/yr
- Unhealthy air days in 30 yrs
- 0 days/yr
Risk factors via First Street. Map © Google.
Why this score? — see what drove the C+ grade
The composite is a weighted blend of 9 inputs, each scored 0–100. Each bar is that input's sub-score; the figure is the points it added to the 100-point composite (weight × sub-score).
- Cash flow +21.5/30.0
- ARV discount +7.5/15.0
- Schools +7.0/10.0
- Appreciation +6.9/10.0
- DSCR +6.8/10.0
- 1% rule +4.7/10.0
- Livability +3.2/5.0
- Rent growth +2.5/5.0
- Condition / age +2.5/5.0
$98,500
🖨 Deal sheet (PDF) 📄 Offer letter ✓ Due diligence
Listing remarks
New listing in Holland! A small, charming house that is perfect for the first time home buyer to start building equity or an investment property. A one bedroom, one bathroom with a bonus room. Attached garage with a breezeway to the house. A patio area off the breezeway and deck off the living area of the house for outdoor enjoyment. Lots of trees for privacy! Schedule your showing today!
Key facts
- Attached garage
- Breezeway
- Patio area
Tags
Property features AI
Exterior
- Parking: Attached garage; Carport (1 space)
- Utilities: Public water; Public sewer
- Home design: Single family residence; One story
- Construction: Slate and asphalt roof
- Exterior features: Concrete road surface
Interior
- Kitchen: Free-standing range; Refrigerator
- Bathrooms: 1 full bathroom
- Heating & cooling: Forced air heating (natural gas); Central air conditioning
- Interior features: Eat-in kitchen; Concrete, unfinished basement
- Laundry & utility: Washer; Dryer; Laundry located on lower level
Neighborhood map
What this means for you Summary
Snapshot
- This is a 2-bed/1.5-bath single-family listed at $98k.
Deal economics
- At list price, monthly cash flow is $147 ($2k/yr) — positive.
- The deal already cash-flows at list — no discount required.
- To meet the 1% rule (rent ≥ 1% of price), the offer needs to be $96k (2.9% below list).
- Recommended offer: $96k (2.9% below list) — sets the bar for 1% rule.
Location & tenants
- Location reads 65/100 on livability (#577 in IA) — a middle-class / working-renter tenant base. Strengths: cost of living A+, housing A+; Watch: employment C-, amenities F, commute F.
- Grundy Center Community School District (rural): math 80% / reading 85% proficiency, ranked #17 of 289 in IA (top 6%) — strong family-tenant draw, lease renewals of 3-5y typical.
- Zoned schools: Grundy Center Elementary School (math 82% / reading 77%, grade A, #71 of 616 statewide, top 15%, 277 students, 34% FRL); Grundy Center Middle School (math 80% / reading 87%, grade A+, #11 of 246 statewide, top 4%, 212 students, 21% FRL); Grundy Center High School (math 77% / reading 87%, grade A, #20 of 336 statewide, top 7%, 235 students, 28% FRL).
- Market conditions: 3 active listings in the ZIP; 14 units permitted in Grundy County in 2024 (0 in 5+ unit buildings).
Forward outlook
- In year one you build about $4k of equity ($681 loan paydown + $4k appreciation (3.7% local appreciation)).
- At projected returns (3.7% appreciation + 3.0% rent growth), your $28k cash investment doubles in ~5 years — after that, you're playing with house money.
- By year 8, paydown + projected appreciation supports a ~$32k cash-out refi (75% LTV) — recoverable capital for the next deal without selling this one.
Negotiation context
- Only 1 days on market — expect competitive offers; lowballing is unlikely to land.
Risks & watch-outs
- Watch-outs: built in 1951 — expect roof / HVAC / electrical / plumbing capex.
Questions for the listing agent
- Built in 1951 — when were the roof, HVAC, electrical panel, plumbing, and water heater last replaced?
- Is there a deadline driving the sale (1031 exchange, divorce, estate, relocation)? That informs how much negotiation room exists.
- Schools are D-rated, which usually means shorter tenancies and higher turnover. Who's the typical renter profile here, and what's been the actual vacancy rate?
- What's the average days-on-market for RENTAL listings here right now (not sales)? A rising rental-DOM trend means longer vacancies and softer asking-rent achievability than the comps imply.
- What's the recent tenant-quality profile in this submarket — average credit score on applications, eviction rate, late-payment / NSF rate, and stable-employment percentage? A property-management company in the area should have these aggregated.
- How much new for-sale + rental construction is in the pipeline within 1–3 miles? Heavy new supply typically softens prices + rents 12–24 months out; constrained supply supports both.
Investment metrics
- 1% rule
- 0.97% ✗
- Cap rate
- 8.08%
- Cash-on-cash
- 6.40%
- DSCR
- 1.28
- GRM
- 8.6
CMA / ARV
No comps found within radius.
Projected returns pro-forma
3.74% appreciation · 3.0% rent growth · sell at horizon
- IRR
- 15.3%
- Equity multiple
- 1.91×
- Total profit
- $25,125
- Equity at exit
- $48,465
- IRR
- 16.5%
- Equity multiple
- 3.60×
- Total profit
- $71,587
- Equity at exit
- $78,113
Cash invested: $27,580 (down + closing). Projections, not guarantees.
Landlord ↔ Tenant lean methodology
- Overall (STATE)
- 83 Strongly Landlord-Friendly
- State Iowa
- 83 Strongly Landlord-Friendly · R+6
- County
- — inherits STATE
- City
- — inherits STATE
ZIP-level market 50642
- Home prices YoY
- 2.4%
- Active inventory
- 3
- Price-to-rent
- 8.6×
Monthly cashflow live
- Estimated rent
- $956 medium interval (Pro) →
- Mortgage (P&I)
- −$517
- Tax from tax record
- −$51 /mo · $612/yr
- Insurance
- −$41
- HOA
- −$0
- Vacancy / Maint / Mgmt
- −$201
- Net cashflow
- $147
Break-even live
Sensitivity live
| Price | -10% $203 | -5% $175 | +0% $147 | +5% $119 | +10% $91 |
|---|---|---|---|---|---|
| Rent | -10% $71 | -5% $109 | +0% $147 | +5% $185 | +10% $223 |
| Rate | -1.0pp $197 | -0.5pp $172 | base $147 | +0.5pp $122 | +1.0pp $96 |
UW: 25.0% down · 7.5% · 30yr · 1.5% tax · 5.0% vac · 8.0% maint · 8.0% mgmt
Financing live
Cash to close
- Down payment
- $24,625
- Closing costs
- $2,955
- Reserves months
- —
- Total cash needed
- —
Loan-product check · same deal, 3 products live
Conventional
25% down · 7.5% · 30yr
- Down + closing
- —
- Monthly P&I
- —
- Monthly cashflow
- —
- DSCR
- —
- Eligible?
- —
Personal DTI + credit; lowest rate.
DSCR
20% down · 8.5% · 30yr
- Down + closing
- —
- Monthly P&I
- —
- Monthly cashflow
- —
- DSCR
- —
- Eligible?
- —
No personal income docs; deal must DSCR.
Hard money
10% down · 12.0% · 12mo
- Down + closing
- —
- Monthly P&I
- —
- Monthly cashflow
- —
- DSCR
- —
- Eligible?
- —
Short-term bridge; refi at stabilization.
Listing history 1 events
-
2026-05-26$98,500 Active
ⓘ Source: listings_history table (triggers on properties + properties_extension) + one-shot
backfill from property_details.listing_events for pre-trigger history.
Tax reassessment forecast IA · Partial reset (capped growth)
- Current annual tax
- $612 · $51/mo
- Projected year-2 tax
- $1,079 · $90/mo
- Expected delta
- +$467/yr (+$39/mo · 76.3%)
ⓘ Screening estimate from a state-policy table — verify with the county assessor before closing.
Climate risk First Street
- Flood 1/10 Low FEMA zone X (unshaded) · 0% chance over 30 yrs
- Wildfire 2/10 Low
- Heat 3/10 Moderate 7 d/yr ≥100°F today · 16 d/yr by 30 yrs out
- Wind 2/10 Low
- Air quality 1/10 Low 0 unhealthy d/yr today · 0 by 30 yrs out
Nearby sold comps map
Loading sold comps map…
Walkable amenities ~0.75 mi
Loading nearby amenities…
Taxation est. · year 1
- Rental income
- $11,478
- − Mortgage interest
- −$5,518
- − Property taxes
- −$612
- − Insurance
- −$492
- − Repairs & maintenance
- −$918
- − Management
- −$918
- − Depreciation
- −$2,865
- Taxable income
- $154
- Est. tax owed @ 24.0%
- −$37
- After-tax cash flow
- $1,727/yr
For passive investors: Depreciation is non-cash, so a rental often shows a tax loss while cash-flowing — sheltering income. Rental losses are passive: they offset passive income freely, and up to $25,000/yr can offset ordinary (W-2) income if you actively participate and your MAGI is under $100k (phasing out to $0 by $150k); unused losses carry forward. On sale, claimed depreciation is recaptured at up to 25%, and gains may owe capital-gains tax (a 1031 exchange can defer both). Figures are a year-1 estimate at your 24.0% rate — not tax advice; consult a CPA.
Schools (NCES district)
- District
- Grundy Center Community School District
- NCES district ID
- 1913290
- Math proficiency
- 80% ▼ -2.00%
- Reading proficiency
- 85% ▬ 0.00%
- Median HH income
- $54,056
- Composite
- 70.11/100
- National rank
- #275
- State rank
- #17 of 289 in IA
Livability — Holland
- Score
- 65/100
- State rank
- #577
- US rank
- #13137
Category grades
Schools grade is shown separately in the Schools card above.
Census & demographics
- Census place
- Holland, IA
- Population (ZIP)
- 554
Population outlook (Grundy County) Hauer SSP2
- Today (2025)
- 12,452 people
- By 2030
- 12,452 · +0.0%
- By 2040
- 12,437 · -0.1%
- By 2050
- 12,370 · -0.7%
- By 2075
- 12,495 · +0.3%
- By 2100
- 11,823 · -5.1%
Race, ethnicity, and origin ACS 2023
- Neighborhood character
- Predominantly White (97%)
- Race & ethnicity
- White 97% Asian 2% Two or more races 1%
- Common ancestry
- Iranian 8% Portuguese 6% Italian 1%
- Foreign-born
- 2% · China
- Languages at home
- 98% English-only · Chinese 2%
Political lean MEDSL · Grundy
- 2024 margin
- Solid R (+41.8) · D 28.3% · R 70.1% · Other 1.6%
- 2008→2024 swing
- -24.9pp toward R · 2008: -16.9pp · 2024: -41.8pp
- All cycles
- 2024: R+41.8 2020: R+37.4 2016: R+39.5 2012: R+23.1 2008: R+16.9
Not yet ingested
- Civics
- —
Market trends
- HPI YoY
- ▲ 3.74%
- Current HPI
- 159.9415
- Rent YoY
- —
- Metro
- —
- State GDP YoY
- ▲ 2.48%
- F500 in state
- 4
Industry mix (Fortune 500 HQ in IA)
| Industry | F500 HQs | Revenue |
|---|---|---|
| Financial Services | 1 | $16B |
|
||
| Retail / Convenience | 1 | $15B |
|
||
Price history
1 event — show timeline
- 2026-05-26 Listed $98,500 NEIRBR as distributed by MLS GRID
Property tax history
-1.8%/yrLatest (2025): $612 · -15.5% YoY. Source: county tax records.
Cash-flow waterfall
monthlySold comps — $/sqft
last 12 mo · ≤1 miLoading sold comps…