160 Northcrest Acres · Avon, PA
Flood risk 1/10 · Minimal
- FEMA flood zone
- X (unshaded)
- Chance of flooding over 30 yrs
- 0.0%
- Est. flood insurance / yr
- $507 – $1,088
Fire risk 1/10 · Minimal
- Est. fire insurance / yr
- $511 – $949
Heat risk 5/10 · Moderate
- Hot days now (above 99°F)
- 7 days/yr
- Hot days in 30 yrs
- 15 days/yr
Wind risk 4/10 · Minor
- Chance of severe wind over 30 yrs
- 11.0%
Air-quality risk 3/10 · Minor
- Unhealthy air days now
- 2 days/yr
- Unhealthy air days in 30 yrs
- 3 days/yr
Risk factors via First Street. Map © Google.
Why this score? — see what drove the B grade
The composite is a weighted blend of 9 inputs, each scored 0–100. Each bar is that input's sub-score; the figure is the points it added to the 100-point composite (weight × sub-score).
- Cash flow +30.0/30.0
- 1% rule +10.0/10.0
- DSCR +10.0/10.0
- ARV discount +7.5/15.0
- Rent growth +4.3/5.0
- Schools +4.1/10.0
- Livability +3.7/5.0
- Condition / age +2.5/5.0
- Appreciation +0.0/10.0
$89,500
🖨 Deal sheet 📄 Offer letter ✓ Due diligence
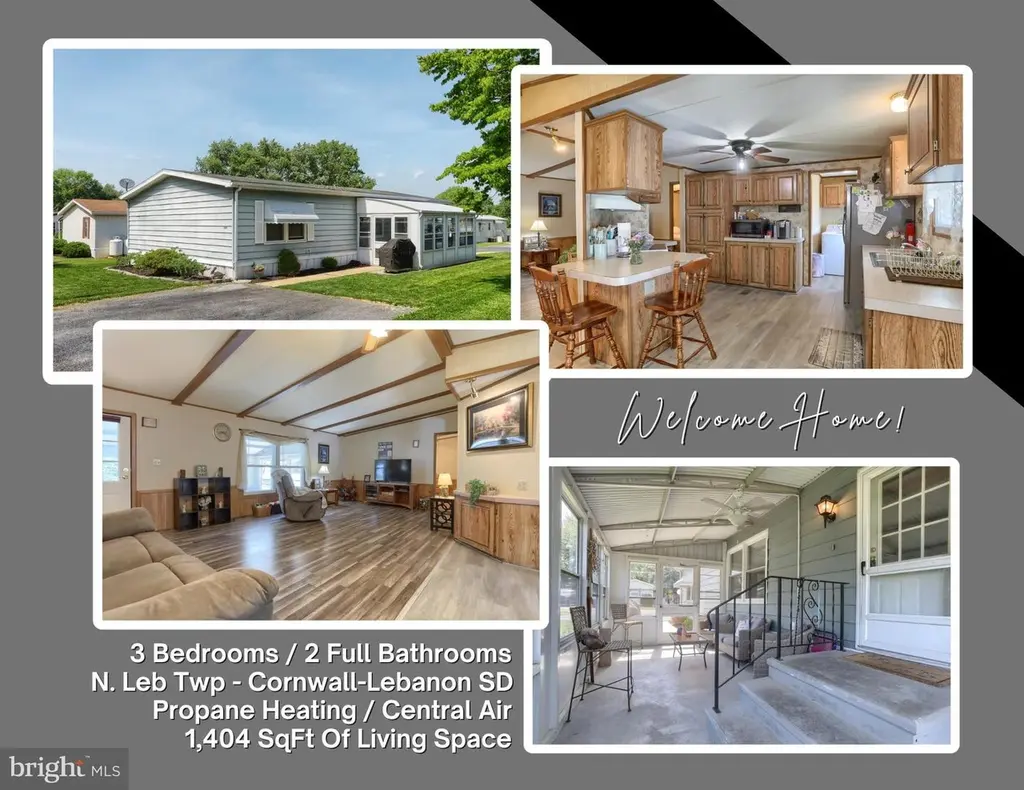
Listing remarks
Spacious and inviting, this 3-bedroom, 2 full bathroom double-wide offers 1,404 square feet of finished living space with an open floorplan concept and thoughtful updates throughout. Step inside to a bright living room featuring wood flooring and a cathedral ceiling that creates an airy, welcoming feel. The kitchen offers a breakfast bar and flows nicely into the dining area, making everyday living and entertaining easy. The large primary bedroom suite includes a walk-in closet and an updated private full bathroom, while two additional bedrooms and a second updated full bath provide flexibility for guests, hobbies, or home office needs. Enjoy your morning coffee in the front sunroom patio o
Key facts
- Wood flooring
- Walk-in closet
- Cathedral ceiling
Tags
Property features AI
Finance
- Other: Rented lot
- Financial info: Ownership interest: Ground rent
- HOA & community: Ground rent exists; $495 monthly
Exterior
- Parking: Asphalt driveway with 4 driveway spaces (4 total garage/parking spaces)
- Utilities: Public water; Shared septic; 200+ amp electric service; Electric hot water
- Home design: Manufactured double-wide home; Estimated year built; Not in a federal flood zone; Private road
- Construction: Vinyl siding; Composite and rubber roof; Crawl space foundation; Above-grade structure
- Exterior features: Deck(s); Enclosed outdoor living area; Patio(s)
Interior
- Kitchen: Refrigerator; Electric oven/range
- Bedrooms: Three bedrooms on the main level
- Bathrooms: Two full bathrooms on the main level
- Heating & cooling: Forced air heating; Propane (leased) heating fuel; Central A/C; Ceiling fan(s)
- Interior features: Breakfast area; Dining area; Exterior lighting
- Laundry & utility: Washer; Laundry room
Neighborhood map
What this means for you Summary
Snapshot
- This is a 2-bed/1.0-bath manufactured listed at $90k.
Deal economics
- At list price, monthly cash flow is $614 ($7k/yr) — positive.
- The deal already cash-flows at list — no discount required.
- Meets the 1% rule at list price ($2k rent vs $90k).
Location & tenants
- Location reads 74/100 on livability (#483 in PA, #4,457 nationally) — a middle-class / working-renter tenant base. Strengths: crime A+, employment A+, cost of living A+; Watch: amenities F, commute F, health & safety F.
- Cornwall-Lebanon SD (suburban): math 37% / reading 56% proficiency, ranked #219 of 539 in PA (top 41%) — families likely to look elsewhere, expect single-tenant / working-renter base with shorter leases.
- Zoned schools: Cedar Crest Hs (math 77% / reading 34%, grade C, #93 of 437 statewide, top 22%, 1,633 students, 34% FRL).
- Market conditions: Rents rising fast (+7.4%/yr); 121 active listings in the ZIP; 1 comparable units currently listed for rent nearby; 315 units permitted in Lebanon County in 2024 (36 in 5+ unit buildings).
Forward outlook
- Local home prices are declining (-3.0%/yr); year-one equity from $619 of loan paydown is wiped out by about $3k of value loss. Plan a longer hold.
- Lebanon County population projected at +10% by 2050 — modest demand growth; plan on rents tracking national, not racing it.
- At projected returns (-3.0% appreciation + 7.4% rent growth), your $25k cash investment doubles in ~4 years — after that, you're playing with house money.
Negotiation context
- Only 13 days on market — expect competitive offers; lowballing is unlikely to land.
- 3 sale attempts since 12y ago with the ask held roughly flat each time — persistent listings suggest the price (not the market) is what's stuck; bring a comps-based counter.
Risks & watch-outs
- Climate carrying-cost: extreme-heat days projected 7→15/yr by 2055 (HVAC capex compounding) — expect insurance premiums to compound above CPI over the hold.
Questions for the listing agent
- Is there a deadline driving the sale (1031 exchange, divorce, estate, relocation)? That informs how much negotiation room exists.
- Schools are F-rated, which usually means shorter tenancies and higher turnover. Who's the typical renter profile here, and what's been the actual vacancy rate?
- What's the average days-on-market for RENTAL listings here right now (not sales)? A rising rental-DOM trend means longer vacancies and softer asking-rent achievability than the comps imply.
- What's the recent tenant-quality profile in this submarket — average credit score on applications, eviction rate, late-payment / NSF rate, and stable-employment percentage? A property-management company in the area should have these aggregated.
- How much new for-sale + rental construction is in the pipeline within 1–3 miles? Heavy new supply typically softens prices + rents 12–24 months out; constrained supply supports both.
Investment metrics
- 1% rule
- 1.69% ✓
- Cap rate
- 14.52%
- Cash-on-cash
- 29.39%
- DSCR
- 2.31
- GRM
- 4.9
CMA / ARV
No comps found within radius.
Projected returns pro-forma
-3.0% appreciation · 7.36% rent growth · sell at horizon
- IRR
- 28.6%
- Equity multiple
- 2.26×
- Total profit
- $31,527
- Equity at exit
- $13,345
- IRR
- 38.4%
- Equity multiple
- 5.35×
- Total profit
- $108,945
- Equity at exit
- $7,738
Cash invested: $25,060 (down + closing). Projections, not guarantees.
Landlord ↔ Tenant lean methodology
- Overall (STATE)
- 62 Landlord-Friendly
- State Pennsylvania
- 62 Landlord-Friendly · EVEN
- County
- — inherits STATE
- City
- — inherits STATE
ZIP-level market 17046
- Rents YoY
- 7.4%
- Active inventory
- 121
- Price-to-rent
- 4.9×
Monthly cashflow live
- Estimated rent
- $1,515 medium interval (Pro) →
- Mortgage (P&I)
- −$469
- Tax from tax record
- −$76 /mo · $916/yr
- Insurance
- −$37
- HOA
- −$0
- Vacancy / Maint / Mgmt
- −$318
- Net cashflow
- $614
Break-even live
UW: 25.0% down · 7.5% · 30yr · 1.5% tax · 5.0% vac · 8.0% maint · 8.0% mgmt
Financing live
Cash to close
- Down payment
- $22,375
- Closing costs
- $2,685
- Reserves months
- —
- Total cash needed
- —
Loan-product check · same deal, 3 products live
Conventional
25% down · 7.5% · 30yr
- Down + closing
- —
- Monthly P&I
- —
- Monthly cashflow
- —
- DSCR
- —
- Eligible?
- —
Personal DTI + credit; lowest rate.
DSCR
20% down · 8.5% · 30yr
- Down + closing
- —
- Monthly P&I
- —
- Monthly cashflow
- —
- DSCR
- —
- Eligible?
- —
No personal income docs; deal must DSCR.
Hard money
10% down · 12.0% · 12mo
- Down + closing
- —
- Monthly P&I
- —
- Monthly cashflow
- —
- DSCR
- —
- Eligible?
- —
Short-term bridge; refi at stabilization.
Rent comps 1 comps
| Address | Beds | Baths | Sqft | Rent | $/sqft | DOM | Units | Dist |
|---|---|---|---|---|---|---|---|---|
| 160 Robert's Cir Lebanon, PA | 2.0 | 2.0 | 1320 | $1,625 | $1.23 | 43d | 1 | 1.12mi |
Listing history 12 events
-
2026-06-19days on market $89,500 Active 13 DOM
-
2026-06-18days on market $89,500 Active 12 DOM
-
2026-06-17days on market $89,500 Active 11 DOM
-
2026-06-16days on market $89,500 Active 10 DOM
-
2026-06-15days on market $89,500 Active 9 DOM
-
2026-06-14days on market $89,500 Active 7 DOM
-
2026-06-13days on market $89,500 Active 6 DOM
-
2026-06-10days on market $89,500 Active 4 DOM
-
2026-06-09days on market $89,500 Active 3 DOM
-
2026-06-08days on market $89,500 Active 2 DOM
-
2026-06-07remarks 699-char remark
-
2026-06-07$89,500 Active 1 DOM
ⓘ Source: listings_history table (triggers on properties + properties_extension) + one-shot
backfill from property_details.listing_events for pre-trigger history.
Tax reassessment forecast PA · Partial reset (capped growth)
- Current annual tax
- $916 · $76/mo
- Projected year-2 tax
- $1,165 · $97/mo
- Expected delta
- +$249/yr (+$21/mo · 27.2%)
ⓘ Screening estimate from a state-policy table — verify with the county assessor before closing.
Climate risk First Street
- Flood 1/10 Low FEMA zone X (unshaded) · 0% chance over 30 yrs
- Wildfire 1/10 Low
- Heat 5/10 Major 7 d/yr ≥99°F today · 15 d/yr by 30 yrs out
- Wind 4/10 Moderate 11% chance of damaging wind over 30 yrs
- Air quality 3/10 Moderate 2 unhealthy d/yr today · 3 by 30 yrs out
Nearby sold comps map
Loading sold comps map…
Walkable amenities ~0.75 mi
Loading nearby amenities…
Taxation est. · year 1
- Rental income
- $18,179
- − Mortgage interest
- −$5,013
- − Property taxes
- −$916
- − Insurance
- −$448
- − Repairs & maintenance
- −$1,454
- − Management
- −$1,454
- − Depreciation
- −$2,604
- Taxable income
- $6,289
- Est. tax owed @ 24.0%
- −$1,509
- After-tax cash flow
- $5,856/yr
For passive investors: Depreciation is non-cash, so a rental often shows a tax loss while cash-flowing — sheltering income. Rental losses are passive: they offset passive income freely, and up to $25,000/yr can offset ordinary (W-2) income if you actively participate and your MAGI is under $100k (phasing out to $0 by $150k); unused losses carry forward. On sale, claimed depreciation is recaptured at up to 25%, and gains may owe capital-gains tax (a 1031 exchange can defer both). Figures are a year-1 estimate at your 24.0% rate — not tax advice; consult a CPA.
Schools (NCES district)
- District
- Cornwall-Lebanon SD
- NCES district ID
- 4206840
- Math proficiency
- 37% ▼ -15.00%
- Reading proficiency
- 56% ▼ -15.00%
- Median HH income
- $62,483
- Composite
- 41.0/100
- National rank
- #3589
- State rank
- #219 of 539 in PA
Livability — Avon
- Score
- 74/100
- State rank
- #483
- US rank
- #4457
Category grades
Schools grade is shown separately in the Schools card above.
Census & demographics
- County
- Lebanon County · 95,836 people
- Metro
- Lebanon, PA
- Population (ZIP)
- 31,835
- Household income
- $62,221
- Rent vs Own
- Severe rent burden
- 905.0
Population outlook (Lebanon County) Hauer SSP2
- Today (2025)
- 144,806 people
- By 2030
- 147,534 · +1.9%
- By 2040
- 152,952 · +5.6%
- By 2050
- 159,406 · +10.1%
- By 2075
- 181,736 · +25.5%
- By 2100
- 198,402 · +37.0%
Race, ethnicity, and origin ACS 2023
- Neighborhood character
- Majority White (60%)
- Race & ethnicity
- White 60% Hispanic / Latino 34% Two or more races 12% Black 2% Asian 1%
- Hispanic origin (detail)
- Mexican 3% Puerto Rican 20% Dominican 9%
- Common ancestry
- Romanian 2% Polish 1% Lithuanian 1%
- Foreign-born
- 8% · Canada
- Languages at home
- 75% English-only · Spanish 23%
Political lean MEDSL · Lebanon
- 2024 margin
- Solid R (+32.0) · D 33.6% · R 65.5%
- 2008→2024 swing
- -13.1pp toward R · 2008: -18.9pp · 2024: -32.0pp
- All cycles
- 2024: R+32.0 2020: R+31.7 2016: R+35.5 2012: R+28.0 2008: R+18.9
Not yet ingested
- Civics
- —
Market trends
- HPI YoY
- ▼ -124.36%
- Current HPI
- 217.3106
- Rent YoY
- ▲ 7.36%
- Metro
- Lebanon, PA
- State GDP YoY
- ▲ 1.68%
- F500 in state
- 34
Industry mix (Fortune 500 HQ in PA)
| Industry | F500 HQs | Revenue |
|---|---|---|
| Healthcare | 2 | $309B |
|
||
| Insurance | 2 | $27B |
|
||
| Telecommunications / Media | 1 | $124B |
|
||
| Industrial Distribution | 1 | $22B |
|
||
| Financial Services | 1 | $20B |
|
||
| Chemicals / Materials | 1 | $18B |
|
||
Price history
+347.5% since first listed5 events — show timeline
- 2026-06-06 Listed $89,500 BRIGHT MLS
- 2016-01-22 Listing Removed — BRIGHT MLS
- 2015-01-05 Listing Removed — BRIGHT MLS
- 2014-08-11 Listed $20,000 BRIGHT MLS
- 2014-08-11 Listed $20,000 BRIGHT MLS
Property tax history
+3.3%/yrLatest (2026): $916 · +4.1% YoY. Source: county tax records.
Cash-flow waterfall
monthlySold comps — $/sqft
last 12 mo · ≤1 miLoading sold comps…