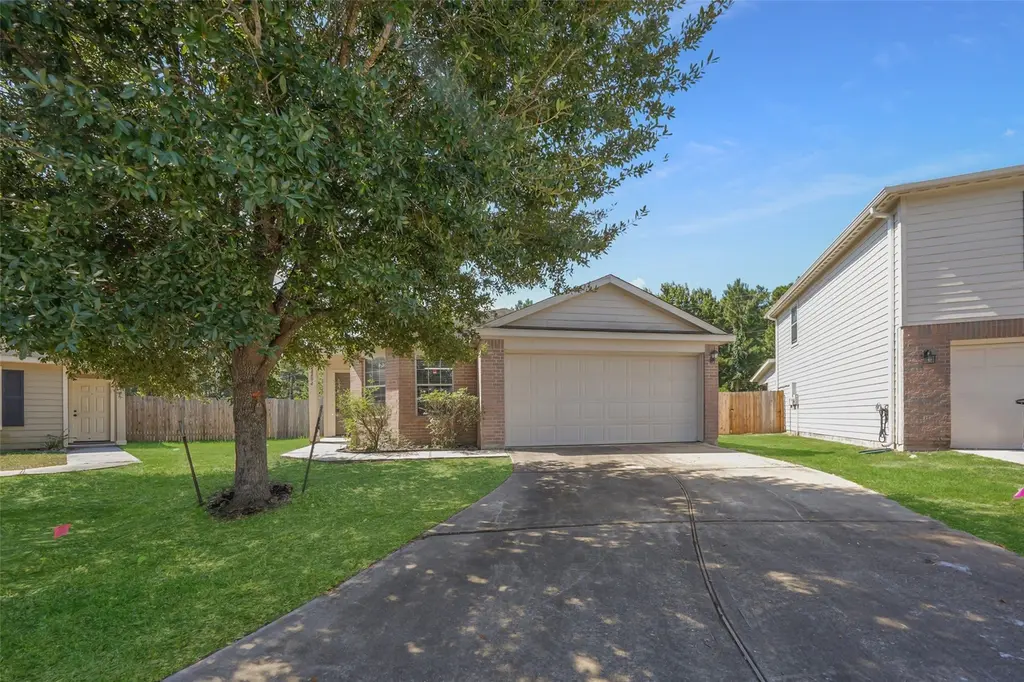
28894 Llano River Loop · Houston, TX
Flood risk 1/10 · Minimal
- FEMA flood zone
- X (unshaded)
- Chance of flooding over 30 yrs
- 0.0%
- Est. flood insurance / yr
- $507 – $1,088
Fire risk 3/10 · Minor
- Est. fire insurance / yr
- $1,222 – $2,270
Heat risk 8/10 · Major
- Hot days now (above 110°F)
- 7 days/yr
- Hot days in 30 yrs
- 22 days/yr
Wind risk 8/10 · Major
- Chance of severe wind over 30 yrs
- 99.0%
Air-quality risk 3/10 · Minor
- Unhealthy air days now
- 3 days/yr
- Unhealthy air days in 30 yrs
- 3 days/yr
Risk factors via First Street. Map © Google.
Why this score? — see what drove the D grade
The composite is a weighted blend of 9 inputs, each scored 0–100. Each bar is that input's sub-score; the figure is the points it added to the 100-point composite (weight × sub-score).
- ARV discount +12.3/15.0
- Cash flow +9.9/30.0
- Schools +5.1/10.0
- Livability +3.7/5.0
- 1% rule +3.3/10.0
- DSCR +2.8/10.0
- Rent growth +2.8/5.0
- Condition / age +2.5/5.0
- Appreciation +0.0/10.0
$269,000
🖨 Deal sheet (PDF) 📄 Offer letter ✓ Due diligence
Listing remarks MLS
OVERSIZED BACKYARD, NO BACKYARD NEIGHBORS & ZONED TO HIGHLY DESIRABLE SCHOOLS! Welcome to this spacious 4-bedroom, 2-bath home nestled in the sought-after Creekside Village community. Enjoy the miles of walking trails and amenities this neighborhood has to offer. Designed with both comfort and style, the open-concept layout seamlessly connects the kitchen, dining, and living areas, perfect for everyday living and entertaining. The primary suite offers a private retreat, while the expansive backyard on an oversized lot provides endless opportunities for outdoor fun, relaxation, and gatherings—all with the added privacy of no rear neighbors. Residents of Creekside Village enjoy family-friendly amenities including parks, playgrounds, and scenic walking trails. With quick access to Grand Parkway (99) and I-45, you’re just minutes from The Woodlands, Old Town Spring, premier shopping, dining, and top-rated schools. This home truly has it all—space, style, and location!
Key facts
- Private retreat
- Oversized backyard
- Open-concept layout
Tags
Neighborhood map
What this means for you Summary
Snapshot
- This is a 4-bed/2.0-bath single-family listed at $269k.
Deal economics
- At list price, monthly cash flow is $-165 ($-2k/yr) — negative.
- To cash-flow at today's rent, offer at most $240k (10.8% below list).
- To meet the 1% rule (rent ≥ 1% of price), the offer needs to be $223k (17.2% below list).
- Recommended offer: $223k (17.2% below list) — sets the bar for 1% rule.
- Cap rate 5.6% vs local median 3.2% in Houston — top-decile yield for the area; either an underpriced asset or a hidden risk that comps aren't pricing in. Stress-test before assuming the spread holds.
Location & tenants
- Location reads 74/100 on livability (#184 in TX, #4,771 nationally) — a middle-class / working-renter tenant base. Strengths: amenities A+, cost of living A+, housing A+; Watch: crime F.
- Conroe ISD (other): math 57% / reading 57% proficiency, ranked #69 of 826 in TX (top 8%) — acceptable for families but not a draw, mixed tenant base, ~2y average lease.
- Zoned schools: Birnham Woods El (math 62% / reading 66%, grade B, #283 of 4,322 statewide, top 7%, 996 students, 17% FRL); York J H (math 71% / reading 65%, grade A-, #73 of 1,662 statewide, top 5%, 2,015 students, 22% FRL); Conroe H S (math 32% / reading 51%, grade F, #767 of 1,632 statewide, top 47%, 4,915 students, 61% FRL) — zoned schools at 34% FRL track the district average.
- Market conditions: Rents rising (+1.4%/yr); 744 active listings in the ZIP; 12 comparable units currently listed for rent nearby; rentals at typical pace (median 24d on market — plan ~3-4 weeks tenant-placement turnaround); high-income renter base; 13,259 units permitted in Montgomery County in 2024 (1,402 in 5+ unit buildings).
Forward outlook
- Local home prices are declining (-3.0%/yr); year-one equity from $2k of loan paydown is wiped out by about $8k of value loss. Plan a longer hold.
- Montgomery County population projected at +65% by 2050 — long-run rental-demand tailwind backs the buy-and-hold thesis.
Negotiation context
- It's been on market 107 days — a 9% lower offer ($245k) is reasonable based on typical stale-listing flexibility.
- 2 sale attempts; this cycle's ask has dropped $16k (6%) from the opening price — seller is motivated, your offer sets the floor, not the list.
Risks & watch-outs
- Climate carrying-cost: severe wind risk, 99% chance of damaging wind over 30y; extreme-heat days projected 7→22/yr by 2055 (HVAC capex compounding) — expect insurance premiums to compound above CPI over the hold.
Questions for the listing agent
- What do current leases actually rent for vs. the listed asking? Can we see a recent rent roll and the last 12 months of T-12 income?
- It's been on market 107 days. Have you received any prior offers? Is the seller open to a 17% concession, seller financing, or rate buy-down credit?
- What does the HOA fee cover, when was the last increase, and are there any pending special assessments or reserve-fund shortfalls?
- Why hasn't it sold? Are there any deal-killer items the seller is aware of (foundation, flood, title, zoning, code violations)?
- Is there a deadline driving the sale (1031 exchange, divorce, estate, relocation)? That informs how much negotiation room exists.
- Schools are D-rated, which usually means shorter tenancies and higher turnover. Who's the typical renter profile here, and what's been the actual vacancy rate?
- Crime grade is F in this area — have there been break-ins, vandalism, or insurance claims at this property in the last 3 years? What carrier currently insures it and at what premium?
- The area grade is low — what's the realistic commute time and amenity access for the typical tenant pool here? Any planned neighborhood developments (good or bad) we should know about?
- What's the average days-on-market for RENTAL listings here right now (not sales)? A rising rental-DOM trend means longer vacancies and softer asking-rent achievability than the comps imply.
- What's the recent tenant-quality profile in this submarket — average credit score on applications, eviction rate, late-payment / NSF rate, and stable-employment percentage? A property-management company in the area should have these aggregated.
- How much new for-sale + rental construction is in the pipeline within 1–3 miles? Heavy new supply typically softens prices + rents 12–24 months out; constrained supply supports both.
Investment metrics
- 1% rule
- 0.83% ✗
- Cap rate
- 5.56%
- Cash-on-cash
- -2.63%
- DSCR
- 0.88
- GRM
- 10.1
CMA / ARV
- ARV (median comp)
- $300,905
- List price
- $269,000
- Delta
- -10.60%
- Verdict
- UNDERPRICED
- Comps
- 20 within 1.0 mi
Show comp detail 12 sales within ~0.75 mi
| Address | Dist | Beds/Ba | Sqft | Sold | Price | $/sf | Match |
|---|---|---|---|---|---|---|---|
| 29511 Water Willow Trace Dr | 0.29mi | 3/2.0 (-1) | 1,807 (-0%) | 1mo | $345,000 | $191 | 80 |
| 4075 Pedernales River Ln | 0.26mi | 3/2.0 (-1) | 1,888 (+4%) | 1mo | $249,900 | $132 | 75 |
| 29519 Crimson Beech Dr | 0.35mi | 3/2.0 (-1) | 1,879 (+4%) | 1mo | $330,000 | $176 | 72 |
| 30302 Castle Forest Dr | 0.45mi | 3/2.0 (-1) | 1,833 (+1%) | 0mo | $275,000 | $150 | 72 |
| 30318 Mesa Valley Dr | 0.47mi | 3/2.0 (-1) | 1,799 (-1%) | 2mo | $292,000 | $162 | 70 |
| 4331 Nueces River Loop | 0.50mi | 4/2.5 | 1,890 (+4%) | 0mo | $270,000 | $143 | 68 |
| 30426 Sunset Falls Dr | 0.40mi | 3/2.0 (-1) | 1,965 (+8%) | 1mo | $300,000 | $153 | 62 |
| 3518 Leaf Vines Dr | 0.50mi | 3/2.0 (-1) | 1,925 (+6%) | 1mo | $305,000 | $158 | 61 |
| 3118 Dunsmore Manor Ct | 0.31mi | 3/2.0 (-1) | 1,604 (-12%) | 1mo | $295,000 | $184 | 61 |
| 29702 Roland Orchard Ct | 0.67mi | 3/2.5 (-1) | 1,873 (+3%) | 0mo | $255,000 | $136 | 56 |
| 30411 Mesa Valley Dr | 0.44mi | 3/2.0 (-1) | 2,018 (+11%) | 1mo | $310,000 | $154 | 55 |
| 29703 Meridian Hill Dr | 0.52mi | 3/2.0 (-1) | 1,618 (-11%) | 2mo | $262,500 | $162 | 51 |
Match score weights: distance 35% · size 25% · config 20% · recency 20%. Top-matched comps best support the ARV.
Projected returns pro-forma
-3.0% appreciation · 1.35% rent growth · sell at horizon
- IRR
- -22.6%
- Equity multiple
- 0.23×
- Total profit
- $-57,655
- Equity at exit
- $40,109
- IRR
- -21.7%
- Equity multiple
- -0.03×
- Total profit
- $-77,868
- Equity at exit
- $23,258
Cash invested: $75,320 (down + closing). Projections, not guarantees.
Landlord ↔ Tenant lean methodology
- Overall (STATE)
- 87 Strongly Landlord-Friendly
- State Texas
- 87 Strongly Landlord-Friendly · R+5
- County
- — inherits STATE
- City
- — inherits STATE
ZIP-level market 77386
- Home prices YoY
- -13.6%
- Rents YoY
- 1.4%
- Active inventory
- 744
- Price-to-rent
- 10.1×
Monthly cashflow live
- Estimated rent
- $2,227 high interval (Pro) →
- Mortgage (P&I)
- −$1,411
- Tax from tax record
- −$377 /mo · $4,519/yr
- Insurance
- −$112
- HOA
- −$25
- Vacancy / Maint / Mgmt
- −$468
- Net cashflow
- $-165
Break-even live
Sensitivity live
| Price | -10% $-13 | -5% $-89 | +0% $-165 | +5% $-241 | +10% $-317 |
|---|---|---|---|---|---|
| Rent | -10% $-341 | -5% $-253 | +0% $-165 | +5% $-77 | +10% $11 |
| Rate | -1.0pp $-29 | -0.5pp $-96 | base $-165 | +0.5pp $-235 | +1.0pp $-305 |
UW: 25.0% down · 7.5% · 30yr · 1.5% tax · 5.0% vac · 8.0% maint · 8.0% mgmt
Financing live
Cash to close
- Down payment
- $67,250
- Closing costs
- $8,070
- Reserves months
- —
- Total cash needed
- —
Loan-product check · same deal, 3 products live
Conventional
25% down · 7.5% · 30yr
- Down + closing
- —
- Monthly P&I
- —
- Monthly cashflow
- —
- DSCR
- —
- Eligible?
- —
Personal DTI + credit; lowest rate.
DSCR
20% down · 8.5% · 30yr
- Down + closing
- —
- Monthly P&I
- —
- Monthly cashflow
- —
- DSCR
- —
- Eligible?
- —
No personal income docs; deal must DSCR.
Hard money
10% down · 12.0% · 12mo
- Down + closing
- —
- Monthly P&I
- —
- Monthly cashflow
- —
- DSCR
- —
- Eligible?
- —
Short-term bridge; refi at stabilization.
Rent comps 12 comps
| Address | Beds | Baths | Sqft | Rent | $/sqft | DOM | Units | Dist |
|---|---|---|---|---|---|---|---|---|
| 29726 Sullivan Oaks Dr Spring, TX | 3.0 | 3.0 | 1410 | $1,725 | $1.22 | 45d | 1 | 0.55mi |
| 3506 Cactus Creek Dr Spring, TX | 3.0 | 3.0 | 2000 | $1,950 | $0.97 | 45d | 1 | 0.68mi |
| 29635 Evergreen Hills Dr Spring, TX | 3.0 | 2.5 | 1433 | $1,836 | $1.28 | 0d | 1 | 0.71mi |
| 29735 Legends Green Dr Spring, TX | 3.0 | 2.0 | 2180 | $3,300 | $1.51 | 26d | 1 | 0.79mi |
| 3543 Garrison Run Dr Spring, TX | 3.0 | 2.0 | 1400 | $1,636 | $1.17 | 26d | 1 | 0.81mi |
| 3323 Orchid Trace Dr Spring, TX | 3.0 | 2.0 | 2180 | $1,200 | $0.55 | 0d | 1 | 0.83mi |
| 3330 Legends Mill Dr Spring, TX | 3.0 | 2.5 | 2310 | $2,175 | $0.94 | 14d | 1 | 0.99mi |
| 29311 Legends Hill Dr Spring, TX | 3.0 | 2.0 | 1768 | $1,901 | $1.08 | 0d | 1 | 1.04mi |
| 3122 Crescent Oaks Park Ln Spring, TX | 3.0 | 2.0 | 1745 | $2,100 | $1.20 | 23d | 1 | 1.20mi |
| 29418 Fox River Dr Spring, TX | 3.0 | 2.0 | 1907 | $1,779 | $0.93 | 4d | 1 | 1.35mi |
| 2815 Fox Mountain Dr Spring, TX | 3.0 | 2.0 | 1556 | $1,875 | $1.21 | 5d | 1 | 1.40mi |
| 3618 Avalon Spring Ln Spring, TX | 4.0 | 2.5 | 2419 | $2,445 | $1.01 | 45d | 1 | 1.44mi |
HOA detail
- Monthly dues
- $25 · $300/yr
- Likely covers
- landscaping
Listing history 21 events
-
2026-06-21days on market $269,000 Active 107 DOM
-
2026-06-18days on market $269,000 Active 104 DOM
-
2026-06-17days on market $269,000 Active 103 DOM
-
2026-06-16days on market $269,000 Active 102 DOM
-
2026-06-15days on market $269,000 Active 101 DOM
-
2026-06-13pricedays on market $269,000 Active 99 DOM
-
2026-06-09days on market $274,900 Active 95 DOM
-
2026-06-08days on market $274,900 Active 94 DOM
-
2026-06-07days on market $274,900 Active 93 DOM
-
2026-06-04days on market $274,900 Active 90 DOM
-
2026-06-03days on market $274,900 Active 89 DOM
-
2026-06-02days on market $274,900 Active 88 DOM
-
2026-06-01days on market $274,900 Active 87 DOM
-
2026-05-31days on market $274,900 Active 86 DOM
-
2026-03-06historical
Show marketing remark (1000 chars)
OVERSIZED BACKYARD, NO BACKYARD NEIGHBORS & ZONED TO HIGHLY DESIRABLE SCHOOLS! Welcome to this spacious 4-bedroom, 2-bath home nestled in the sought-after Creekside Village community. Enjoy the miles of walking trails and amenities this neighborhood has to offer. Designed with both comfort and style, the open-concept layout seamlessly connects the kitchen, dining, and living areas, perfect for everyday living and entertaining. The primary suite offers a private retreat, while the expansive backyard on an oversized lot provides endless opportunities for outdoor fun, relaxation, and gatherings—all with the added privacy of no rear neighbors. Residents of Creekside Village enjoy family-friendly amenities including parks, playgrounds, and scenic walking trails. With quick access to Grand Parkway (99) and I-45, you’re just minutes from The Woodlands, Old Town Spring, premier shopping, dining, and top-rated schools. This home truly has it all—space, style, and location!
-
2026-03-06$285,000 Active 1000-char remark
Show marketing remark (1000 chars)
OVERSIZED BACKYARD, NO BACKYARD NEIGHBORS & ZONED TO HIGHLY DESIRABLE SCHOOLS! Welcome to this spacious 4-bedroom, 2-bath home nestled in the sought-after Creekside Village community. Enjoy the miles of walking trails and amenities this neighborhood has to offer. Designed with both comfort and style, the open-concept layout seamlessly connects the kitchen, dining, and living areas, perfect for everyday living and entertaining. The primary suite offers a private retreat, while the expansive backyard on an oversized lot provides endless opportunities for outdoor fun, relaxation, and gatherings—all with the added privacy of no rear neighbors. Residents of Creekside Village enjoy family-friendly amenities including parks, playgrounds, and scenic walking trails. With quick access to Grand Parkway (99) and I-45, you’re just minutes from The Woodlands, Old Town Spring, premier shopping, dining, and top-rated schools. This home truly has it all—space, style, and location!
-
2026-02-05price $290,000
-
2025-11-06price $299,500
-
2025-10-30price $309,900
-
2025-09-30$315,000 Active
-
2025-09-15soldstatus
ⓘ Source: listings_history table (triggers on properties + properties_extension) + one-shot
backfill from property_details.listing_events for pre-trigger history.
Tax reassessment forecast TX · Resets to sale price
- Current annual tax
- $4,519 · $377/mo
- Projected year-2 tax
- $4,923 · $410/mo
- Expected delta
- +$404/yr (+$34/mo · 8.9%)
ⓘ Screening estimate from a state-policy table — verify with the county assessor before closing.
Climate risk First Street
- Flood 1/10 Low FEMA zone X (unshaded) · 0% chance over 30 yrs
- Wildfire 3/10 Moderate
- Heat 8/10 Severe 7 d/yr ≥110°F today · 22 d/yr by 30 yrs out
- Wind 8/10 Severe 99% chance of damaging wind over 30 yrs
- Air quality 3/10 Moderate 3 unhealthy d/yr today · 3 by 30 yrs out
Nearby sold comps map
Loading sold comps map…
Walkable amenities ~0.75 mi
Loading nearby amenities…
Taxation est. · year 1
- Rental income
- $26,725
- − Mortgage interest
- −$15,068
- − Property taxes
- −$4,519
- − Insurance
- −$1,345
- − Repairs & maintenance
- −$2,138
- − Management
- −$2,138
- − HOA
- −$300
- − Depreciation
- −$7,825
- Taxable loss
- −$6,608
- Est. tax savings @ 24.0%
- +$1,586
- After-tax cash flow
- $-393/yr
For passive investors: Depreciation is non-cash, so a rental often shows a tax loss while cash-flowing — sheltering income. Rental losses are passive: they offset passive income freely, and up to $25,000/yr can offset ordinary (W-2) income if you actively participate and your MAGI is under $100k (phasing out to $0 by $150k); unused losses carry forward. On sale, claimed depreciation is recaptured at up to 25%, and gains may owe capital-gains tax (a 1031 exchange can defer both). Figures are a year-1 estimate at your 24.0% rate — not tax advice; consult a CPA.
Schools (NCES district)
- District
- Conroe ISD
- NCES district ID
- 4815000
- Math proficiency
- 57% ▼ -6.00%
- Reading proficiency
- 57% ▼ -1.00%
- Median HH income
- $71,541
- Composite
- 50.65/100
- National rank
- #1833
- State rank
- #69 of 826 in TX
Livability — Houston
- Score
- 74/100
- State rank
- #184
- US rank
- #4771
Category grades
Schools grade is shown separately in the Schools card above.
Census & demographics
- County
- Montgomery County · 663,713 people
- City population
- 3,226,434
- Metro
- Houston-The Woodlands-Sugar Land, TX
- Population (ZIP)
- 69,980
- Household income
- $132,469
- Rent vs Own
- Severe rent burden
- 1115.0
Population outlook (Montgomery County) Hauer SSP2
- Today (2025)
- 713,896 people
- By 2030
- 805,263 · +12.8%
- By 2040
- 992,708 · +39.1%
- By 2050
- 1,179,590 · +65.2%
- By 2075
- 1,628,084 · +128.1%
- By 2100
- 1,937,880 · +171.5%
Race, ethnicity, and origin ACS 2023
- Neighborhood character
- Diverse neighborhood (Simpson 0.61)
- Race & ethnicity
- White 58% Hispanic / Latino 22% Two or more races 14% Black 9% Asian 6%
- Hispanic origin (detail)
- Mexican 11% Cuban 1%
- Common ancestry
- Lithuanian 4% Romanian 2% Slovak 2%
- Foreign-born
- 15% · Canada, China, South Korea
- Languages at home
- 79% English-only · Spanish 12% Other Indo-European 3% Russian/Polish/Slavic 1%
Political lean MEDSL · Montgomery
- 2024 margin
- Solid R (+45.5) · D 26.8% · R 72.3%
- 2008→2024 swing
- +7.2pp toward D · 2008: -52.7pp · 2024: -45.5pp
- All cycles
- 2024: R+45.5 2020: R+43.8 2016: R+51.4 2012: R+60.7 2008: R+52.7
Not yet ingested
- Civics
- —
Market trends
- HPI YoY
- ▼ -35.74%
- Current HPI
- 226.3729
- Rent YoY
- ▲ 1.35%
- Metro
- Houston-The Woodlands-Sugar Land, TX
- State GDP YoY
- ▲ 3.95%
- F500 in state
- 110
Industry mix (Fortune 500 HQ in TX)
| Industry | F500 HQs | Revenue |
|---|---|---|
| Energy | 16 | $1,198B |
|
||
| Technology | 5 | $198B |
|
||
| Engineering / Construction | 4 | $72B |
|
||
| Energy Services | 3 | $60B |
|
||
| Utilities | 3 | $41B |
|
||
| Healthcare | 2 | $330B |
|
||
Price history
-9.5% since first listed7 events — show timeline
- 2026-03-06 Listed $285,000 HARMLS
- 2026-03-06 Listing Removed — HARMLS
- 2026-02-05 Price Changed $290,000 HARMLS
- 2025-11-06 Price Changed $299,500 HARMLS
- 2025-10-30 Price Changed $309,900 HARMLS
- 2025-09-30 Listed $315,000 HARMLS
- 2025-09-15 Sold (Public Records) — Public Records
Property tax history
+12.3%/yrLatest (2025): $4,519 · +9.6% YoY. Source: county tax records.
Cash-flow waterfall
monthlySold comps — $/sqft
last 12 mo · ≤1 miLoading sold comps…