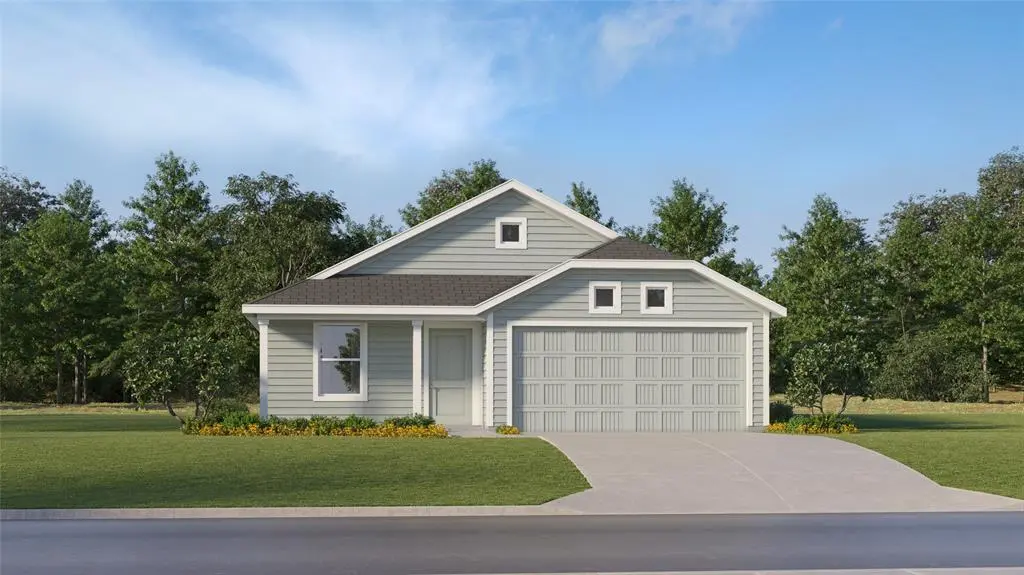
2217 Canteen St · Fort Worth, TX
Flood risk No data
- FEMA flood zone
- —
- Chance of flooding over 30 yrs
- —
- Est. flood insurance / yr
- —
Fire risk No data
- Est. fire insurance / yr
- —
Heat risk No data
- Hot days now (above threshold)
- —
- Hot days in 30 yrs
- —
Wind risk No data
- Chance of severe wind over 30 yrs
- —
Air-quality risk No data
- Unhealthy air days now
- —
- Unhealthy air days in 30 yrs
- —
Risk factors via First Street. Map © Google.
Why this score? — see what drove the D- grade
The composite is a weighted blend of 9 inputs, each scored 0–100. Each bar is that input's sub-score; the figure is the points it added to the 100-point composite (weight × sub-score).
- Cash flow +12.8/30.0
- ARV discount +7.5/15.0
- Livability +4.0/5.0
- DSCR +3.8/10.0
- 1% rule +2.9/10.0
- Rent growth +2.5/5.0
- Condition / age +2.5/5.0
- Schools +2.0/10.0
- Appreciation +0.0/10.0
$267,860
🖨 Deal sheet 📄 Offer letter ✓ Due diligence
Listing remarks
LENNAR - Carrell Hills - Newlin Floorplan - This single-level home showcases a spacious open floorplan shared between the kitchen, dining area and family room for easy entertaining. An owner’s suite enjoys a private location in a rear corner of the home, complemented by an en-suite bathroom and walk-in closet. There are two secondary bedrooms at the front of the home, which are comfortable spaces for household members and overnight guests.
Key facts
- Walk-in closet
- Open floorplan
- Secondary bedrooms
Tags
Property features AI
Finance
- Financial info: Acceptable financing: Cash, Conventional, FHA, VA
- HOA & community: Mandatory association; Annual association fee of $899; Association fee includes full use of facilities and management fees; HOA managed by CMA
Exterior
- Parking: Attached 2-car garage; Covered parking (2 spaces); Garage faces front
- Security: Carbon monoxide detector(s); Fire alarm
- Utilities: City water; City sewer; Curbs; Sidewalk
- Home design: Single-family residence; One story; Residential property; Property not attached; Builder listing
- Construction: Fiber cement exterior; Composition roof; Slab foundation; Built in 2026
- Exterior features: Covered porch(es); Wood fencing; Interior lot; Landscaped yard; Sprinkler system
Interior
- Kitchen: Dishwasher; Disposal; Gas cooktop; Microwave; Kitchen island; Natural stone/granite countertops; Walk-in pantry; Built-in cabinets
- Bedrooms: Primary bedroom on entry level with walk-in closet; Two additional bedrooms on entry level
- Flooring: Carpet; Luxury vinyl plank
- Bathrooms: Two full bathrooms
- Heating & cooling: Central heating; Central air
- Interior features: Built-in features; Cable TV available; Decorative lighting; High-speed internet available; Kitchen island; Open floorplan; Pantry; Walk-in closet(s); Six total rooms (living, kitchen, dining, primary bedroom, two additional bedrooms)
- Laundry & utility: Tankless water heater
Neighborhood map
What this means for you Summary
Snapshot
- This is a 3-bed/2.0-bath other listed at $268k.
Deal economics
- At list price, monthly cash flow is $-22 ($-266/yr) — negative.
- To cash-flow at today's rent, offer at most $264k (1.5% below list).
- To meet the 1% rule (rent ≥ 1% of price), the offer needs to be $211k (21.4% below list).
- Recommended offer: $211k (21.4% below list) — sets the bar for 1% rule.
- Cap rate 6.2% vs local median 3.9% in Fort Worth — top-decile yield for the area; either an underpriced asset or a hidden risk that comps aren't pricing in. Stress-test before assuming the spread holds.
Location & tenants
- Location reads 80/100 on livability (#49 in TX, #1,954 nationally) — a professional / high-income tenant draw. Strengths: amenities A+, cost of living A+, housing A+; Watch: crime F.
- Fort Worth ISD (urban): math 18% / reading 28% proficiency, ranked #742 of 826 in TX (top 90%) — low school quality limits family demand, transient renter base, plan for 1-2y turnover; 73% free/reduced lunch — lower-income household profile, screen leases tightly.
- Zoned schools: Waverly Park El (math 26% / reading 32%, grade F, #2,668 of 4,322 statewide, top 63%, 684 students, 78% FRL).
- Market conditions: Rents soft (-0.2%/yr); 548 active listings in the ZIP; 40 comparable units currently listed for rent nearby; rentals at typical pace (median 25d on market — plan ~3-4 weeks tenant-placement turnaround); 45% of comp listings sitting > 30 days — soft ceiling on asking rent; solid renter incomes; 18,938 units permitted in Tarrant County in 2024 (8,336 in 5+ unit buildings).
- This rent runs 31% of the median local income ($80k/yr) — at the standard rent-burdened threshold; future hikes will face affordability resistance.
Forward outlook
- Local home prices are declining (-3.0%/yr); year-one equity from $2k of loan paydown is wiped out by about $8k of value loss. Plan a longer hold.
- Tarrant County population projected at +41% by 2050 — long-run rental-demand tailwind backs the buy-and-hold thesis.
Negotiation context
- It's been on market 37 days — a 3% lower offer ($260k) is reasonable based on typical stale-listing flexibility.
- 2 sale attempts with the ask held roughly flat each time — persistent listings suggest the price (not the market) is what's stuck; bring a comps-based counter.
Questions for the listing agent
- What do current leases actually rent for vs. the listed asking? Can we see a recent rent roll and the last 12 months of T-12 income?
- It's been on market 37 days. Have you received any prior offers? Is the seller open to a 21% concession, seller financing, or rate buy-down credit?
- What does the HOA fee cover, when was the last increase, and are there any pending special assessments or reserve-fund shortfalls?
- Is there a deadline driving the sale (1031 exchange, divorce, estate, relocation)? That informs how much negotiation room exists.
- Schools are D-rated, which usually means shorter tenancies and higher turnover. Who's the typical renter profile here, and what's been the actual vacancy rate?
- Crime grade is F in this area — have there been break-ins, vandalism, or insurance claims at this property in the last 3 years? What carrier currently insures it and at what premium?
- The area grade is low — what's the realistic commute time and amenity access for the typical tenant pool here? Any planned neighborhood developments (good or bad) we should know about?
- What's the average days-on-market for RENTAL listings here right now (not sales)? A rising rental-DOM trend means longer vacancies and softer asking-rent achievability than the comps imply.
- What's the recent tenant-quality profile in this submarket — average credit score on applications, eviction rate, late-payment / NSF rate, and stable-employment percentage? A property-management company in the area should have these aggregated.
- How much new for-sale + rental construction is in the pipeline within 1–3 miles? Heavy new supply typically softens prices + rents 12–24 months out; constrained supply supports both.
Investment metrics
- 1% rule
- 0.79% ✗
- Cap rate
- 6.19%
- Cash-on-cash
- -0.35%
- DSCR
- 0.98
- GRM
- 10.6
CMA / ARV
No comps found within radius.
Projected returns pro-forma
-3.0% appreciation · 0.0% rent growth · sell at horizon
- IRR
- -20.0%
- Equity multiple
- 0.32×
- Total profit
- $-51,059
- Equity at exit
- $39,939
- IRR
- -20.4%
- Equity multiple
- 0.06×
- Total profit
- $-70,415
- Equity at exit
- $23,160
Cash invested: $75,001 (down + closing). Projections, not guarantees.
Landlord ↔ Tenant lean methodology
- Overall (STATE)
- 87 Strongly Landlord-Friendly
- State Texas
- 87 Strongly Landlord-Friendly · R+5
- County
- — inherits STATE
- City
- — inherits STATE
ZIP-level market 76108
- Home prices YoY
- -32.5%
- Rents YoY
- -0.2%
- Active inventory
- 548
- Price-to-rent
- 10.6×
Monthly cashflow live
- Estimated rent
- $2,106 high interval (Pro) →
- Mortgage (P&I)
- −$1,405
- Tax from tax record
- −$95 /mo · $1,135/yr
- Insurance
- −$112
- HOA
- −$75
- Vacancy / Maint / Mgmt
- −$442
- Net cashflow
- $-22
Break-even live
UW: 25.0% down · 7.5% · 30yr · 1.5% tax · 5.0% vac · 8.0% maint · 8.0% mgmt
Financing live
Cash to close
- Down payment
- $66,965
- Closing costs
- $8,036
- Reserves months
- —
- Total cash needed
- —
Loan-product check · same deal, 3 products live
Conventional
25% down · 7.5% · 30yr
- Down + closing
- —
- Monthly P&I
- —
- Monthly cashflow
- —
- DSCR
- —
- Eligible?
- —
Personal DTI + credit; lowest rate.
DSCR
20% down · 8.5% · 30yr
- Down + closing
- —
- Monthly P&I
- —
- Monthly cashflow
- —
- DSCR
- —
- Eligible?
- —
No personal income docs; deal must DSCR.
Hard money
10% down · 12.0% · 12mo
- Down + closing
- —
- Monthly P&I
- —
- Monthly cashflow
- —
- DSCR
- —
- Eligible?
- —
Short-term bridge; refi at stabilization.
Rent comps 40 comps
| Address | Beds | Baths | Sqft | Rent | $/sqft | DOM | Units | Dist |
|---|---|---|---|---|---|---|---|---|
| 2225 Canteen St Fort Worth, TX | 4.0 | 2.0 | 1667 | $2,300 | $1.38 | 20d | 1 | 0.01mi |
| 10721 Revolver Ln Fort Worth, TX | 3.0 | 2.0 | 1824 | $1,900 | $1.04 | 43d | 1 | 0.05mi |
| 2236 Crested Saguaro St Fort Worth, TX | 3.0 | 2.0 | 1824 | $1,900 | $1.04 | 43d | 1 | 0.08mi |
| 11028 Elata Dr Fort Worth, TX | 4.0 | 2.0 | 1760 | $2,425 | $1.38 | 5d | 1 | 0.49mi |
| 1144 Terrace View Dr Fort Worth, TX | 3.0 | 2.0 | 1680 | $1,975 | $1.18 | 12d | 1 | 0.50mi |
| 11100 Santana Dr Fort Worth, TX | 3.0 | 2.0 | 1229 | $2,340 | $1.90 | 44d | 1 | 0.59mi |
| 2516 Concina Way Fort Worth, TX | 3.0 | 2.0 | 1464 | $1,879 | $1.28 | 19d | 1 | 0.59mi |
| 10409 Pleasant Mound Dr Fort Worth, TX | 3.0 | 2.0 | 1441 | $1,925 | $1.34 | 43d | 1 | 0.59mi |
| 10529 Splitridge Ct Fort Worth, TX | 3.0 | 2.0 | 1543 | $2,145 | $1.39 | 19d | 1 | 0.63mi |
| 2521 Ensenada Ln Fort Worth, TX | 3.0 | 2.0 | 1600 | $1,950 | $1.22 | 43d | 1 | 0.67mi |
| 933 Burlington Ave Fort Worth, TX | 3.0 | 2.0 | 1316 | $2,010 | $1.53 | 43d | 1 | 0.68mi |
| 10241 Pleasant Mound Dr Fort Worth, TX | 3.0 | 2.0 | 1765 | $2,090 | $1.18 | 12d | 1 | 0.73mi |
| 904 Burlington Ave Fort Worth, TX | 3.0–5.0 | 2.0–2.5 | 1895 | $2,220 | $1.17 | 1d | 1 | 0.74mi |
| 11012 Gray Mare Dr Fort Worth, TX | 3.0 | 2.0 | 1316 | $2,010 | $1.53 | 24d | 1 | 0.78mi |
| 2732 Brea Canyon Rd Fort Worth, TX | 3.0 | 2.0 | 1582 | $2,100 | $1.33 | 17d | 1 | 0.79mi |
| 10909 Deauville Cir S Fort Worth, TX | 3.0 | 2.0 | 1360 | $1,900 | $1.40 | 20d | 1 | 0.79mi |
| 851 Village Point Ln Fort Worth, TX | 3.0 | 2.5 | 1322 | $1,799 | $1.36 | 22d | 1 | 0.80mi |
| 10240 Dawson Trl Fort Worth, TX | 3.0 | 2.5 | 1844 | $1,871 | $1.01 | 43d | 1 | 0.80mi |
| 2220 Barnwell Dr Fort Worth, TX | 3.0 | 2.0 | 1463 | $2,200 | $1.50 | 10d | 1 | 0.87mi |
| 10917 Ives St Fort Worth, TX | 4.0 | 2.0 | 1772 | $2,170 | $1.22 | 24d | 1 | 0.91mi |
| 10913 Ives St Fort Worth, TX | 3.0 | 2.0 | 1575 | $1,751 | $1.11 | 22d | 1 | 0.91mi |
| 10221 Dallam Ln Fort Worth, TX | 3.0 | 2.0 | 1464 | $1,969 | $1.34 | 43d | 1 | 0.93mi |
| 2656 Mistwood Dr Fort Worth, TX | 3.0 | 2.0 | 1260 | $2,245 | $1.78 | 2d | 1 | 0.98mi |
| 2712 Mistwood Dr Fort Worth, TX | 3.0 | 2.0 | 1474 | $2,295 | $1.56 | 19d | 1 | 0.99mi |
| 2712 Mistwood Dr Fort Worth, TX | 3.0 | 2.0 | 1474 | $2,309 | $1.57 | 43d | 1 | 0.99mi |
| 10140 Dalgreen Cir Fort Worth, TX | 4.0 | 2.0 | 1660 | $2,420 | $1.46 | 6d | 1 | 1.00mi |
| 10136 Dalgreen Cir Fort Worth, TX | 3.0–4.0 | 2.0–2.5 | 1575 | $2,165 | $1.37 | 1d | 1 | 1.01mi |
| 10258 Maverick Dr Unit 58 Fort Worth, TX | 3.0 | 2.0 | 940 | $1,595 | $1.70 | 2d | 1 | 1.01mi |
| 10217 Maverick Dr Fort Worth, TX | 3.0 | 2.0 | 1492 | $2,045 | $1.37 | 43d | 1 | 1.02mi |
| 10275 Aurora Dr Fort Worth, TX | 2.0 | 2.0 | 880 | $1,450 | $1.65 | 43d | 1 | 1.03mi |
| 10116 Dalgreen Cir Fort Worth, TX | 4.0 | 2.0 | 1667 | $2,420 | $1.45 | 43d | 1 | 1.06mi |
| 2757 Mistwood Dr Fort Worth, TX | 4.0 | 2.0 | 1707 | $2,375 | $1.39 | 2d | 1 | 1.06mi |
| 10258 Aurora Dr Fort Worth, TX | 2.0 | 2.0 | 1231 | $1,150 | $0.93 | 43d | 1 | 1.06mi |
| 2765 Mistwood Dr Fort Worth, TX | 3.0 | 2.0 | 1474 | $2,275 | $1.54 | 43d | 1 | 1.06mi |
| 2713 Center Creek Ln Fort Worth, TX | 3.0 | 2.0 | 1464 | $2,340 | $1.60 | 5d | 1 | 1.07mi |
| 10253 Sunset View Dr Fort Worth, TX | 4.0 | 2.0 | 1640 | $2,095 | $1.28 | 43d | 1 | 1.09mi |
| 2745 Center Creek Ln Fort Worth, TX | 3.0 | 2.0 | 1260 | $2,225 | $1.77 | 43d | 1 | 1.10mi |
| 613 Deauville Dr Unit rent one bd-one bath Fort Worth, TX | 3.0 | 2.0 | 1460 | $900 | $0.62 | 43d | 1 | 1.10mi |
| 2708 River Knoll Ln Fort Worth, TX | 4.0 | 2.0 | 1667 | $2,365 | $1.42 | 43d | 1 | 1.11mi |
| 2712 River Knoll Ln Fort Worth, TX | 3.0 | 2.0 | 1260 | $2,099 | $1.67 | 15d | 1 | 1.11mi |
HOA detail
- Monthly dues
- $75 · $900/yr
Listing history 18 events
-
2026-06-18days on market $267,860 Active 37 DOM
-
2026-06-17days on market $267,860 Active 36 DOM
-
2026-06-16days on market $267,860 Active 35 DOM
-
2026-06-15days on market $267,860 Active 34 DOM
-
2026-06-13days on market $267,860 Active 32 DOM
-
2026-06-10price $267,860 Active 28 DOM
-
2026-06-09days on market $269,860 Active 28 DOM
-
2026-06-08days on market $269,860 Active 27 DOM
-
2026-06-07days on market $269,860 Active 26 DOM
-
2026-06-04days on market $269,860 Active 23 DOM
-
2026-06-03days on market $269,860 Active 22 DOM
-
2026-06-02days on market $269,860 Active 21 DOM
-
2026-06-02price $269,860 Active 20 DOM
-
2026-06-01days on market $312,359 Active 20 DOM
-
2026-05-31days on market $312,359 Active 19 DOM
-
2026-05-20status Active
-
2026-05-01status Pending
-
2026-04-23$262,549 Active
ⓘ Source: listings_history table (triggers on properties + properties_extension) + one-shot
backfill from property_details.listing_events for pre-trigger history.
Tax reassessment forecast TX · Resets to sale price
- Current annual tax
- $1,135 · $95/mo
- Projected year-2 tax
- $4,902 · $408/mo
- Expected delta
- +$3,766/yr (+$314/mo · 331.7%)
ⓘ Screening estimate from a state-policy table — verify with the county assessor before closing.
Nearby sold comps map
Loading sold comps map…
Walkable amenities ~0.75 mi
Loading nearby amenities…
Taxation est. · year 1
- Rental income
- $25,272
- − Mortgage interest
- −$15,004
- − Property taxes
- −$1,135
- − Insurance
- −$1,339
- − Repairs & maintenance
- −$2,022
- − Management
- −$2,022
- − HOA
- −$900
- − Depreciation
- −$7,792
- Taxable loss
- −$4,943
- Est. tax savings @ 24.0%
- +$1,186
- After-tax cash flow
- $920/yr
For passive investors: Depreciation is non-cash, so a rental often shows a tax loss while cash-flowing — sheltering income. Rental losses are passive: they offset passive income freely, and up to $25,000/yr can offset ordinary (W-2) income if you actively participate and your MAGI is under $100k (phasing out to $0 by $150k); unused losses carry forward. On sale, claimed depreciation is recaptured at up to 25%, and gains may owe capital-gains tax (a 1031 exchange can defer both). Figures are a year-1 estimate at your 24.0% rate — not tax advice; consult a CPA.
Schools (NCES district)
- District
- Fort Worth ISD
- NCES district ID
- 4819700
- Math proficiency
- 18% ▼ -16.00%
- Reading proficiency
- 28% ▼ -6.00%
- Median HH income
- $42,109
- Composite
- 19.61/100
- National rank
- #8753
- State rank
- #742 of 826 in TX
Livability — Fort Worth
- Score
- 80/100
- State rank
- #49
- US rank
- #1954
Category grades
Schools grade is shown separately in the Schools card above.
Census & demographics
- Census place
- Fort Worth, TX
- County
- Tarrant County · 2,033,669 people
- City population
- 911,619
- Metro
- Dallas-Fort Worth-Arlington, TX
- Population (ZIP)
- 45,537
- Household income
- $80,412
- Rent vs Own
- Severe rent burden
- 774.0
Population outlook (Tarrant County) Hauer SSP2
- Today (2025)
- 2,380,417 people
- By 2030
- 2,578,900 · +8.3%
- By 2040
- 2,974,995 · +25.0%
- By 2050
- 3,350,489 · +40.8%
- By 2075
- 4,216,909 · +77.2%
- By 2100
- 4,741,527 · +99.2%
Race, ethnicity, and origin ACS 2023
- Neighborhood character
- Diverse neighborhood (Simpson 0.62)
- Race & ethnicity
- White 52% Hispanic / Latino 32% Two or more races 17% Black 8% Asian 3% Native American 1%
- Hispanic origin (detail)
- Mexican 26% Puerto Rican 1%
- Common ancestry
- Slovak 2% Lithuanian 1% Romanian 1%
- Foreign-born
- 11% · Canada, Vietnam
- Languages at home
- 76% English-only · Spanish 21% Vietnamese 1% Tagalog/Filipino 1%
Political lean MEDSL · Tarrant
- 2024 margin
- Lean R (+5.1) · D 46.7% · R 51.9% · Other 1.4%
- 2008→2024 swing
- +6.6pp toward D · 2008: -11.7pp · 2024: -5.1pp
- All cycles
- 2024: R+5.1 2020: D+0.2 2016: R+8.7 2012: R+15.7 2008: R+11.7
Not yet ingested
- Civics
- —
Market trends
- HPI YoY
- ▼ -141.39%
- Current HPI
- 294.2459
- Rent YoY
- ▼ -0.18%
- Metro
- Dallas-Fort Worth-Arlington, TX
- State GDP YoY
- ▲ 3.95%
- F500 in state
- 110
Industry mix (Fortune 500 HQ in TX)
| Industry | F500 HQs | Revenue |
|---|---|---|
| Energy | 16 | $1,198B |
|
||
| Technology | 5 | $198B |
|
||
| Engineering / Construction | 4 | $72B |
|
||
| Energy Services | 3 | $60B |
|
||
| Utilities | 3 | $41B |
|
||
| Healthcare | 2 | $330B |
|
||
Price history
3 events — show timeline
- 2026-05-20 Relisted — NTREIS
- 2026-05-01 Pending — NTREIS
- 2026-04-23 Listed $262,549 NTREIS
Cash-flow waterfall
monthlySold comps — $/sqft
last 12 mo · ≤1 miLoading sold comps…