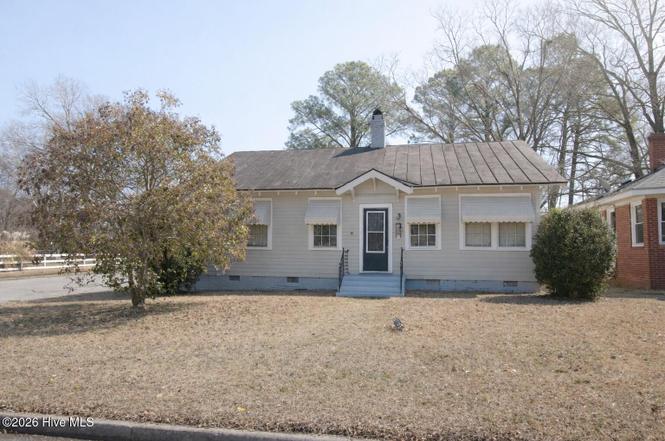
601 S Tillery St · Rocky Mount, NC
Flood risk 4/10 · Minor
- FEMA flood zone
- X (unshaded)
- Chance of flooding over 30 yrs
- 0.24%
- Est. flood insurance / yr
- $507 – $1,088
Fire risk 2/10 · Minimal
- Est. fire insurance / yr
- $906 – $1,684
Heat risk 8/10 · Major
- Hot days now (above 107°F)
- 7 days/yr
- Hot days in 30 yrs
- 16 days/yr
Wind risk 6/10 · Moderate
- Chance of severe wind over 30 yrs
- 72.0%
Air-quality risk 2/10 · Minimal
- Unhealthy air days now
- 1 days/yr
- Unhealthy air days in 30 yrs
- 2 days/yr
Risk factors via First Street. Map © Google.
Why this score? — see what drove the B- grade
The composite is a weighted blend of 9 inputs, each scored 0–100. Each bar is that input's sub-score; the figure is the points it added to the 100-point composite (weight × sub-score).
- Cash flow +30.0/30.0
- 1% rule +10.0/10.0
- DSCR +10.0/10.0
- ARV discount +7.5/15.0
- Rent growth +3.9/5.0
- Livability +3.5/5.0
- Condition / age +2.5/5.0
- Schools +2.2/10.0
- Appreciation +0.0/10.0
$44,900
🖨 Deal sheet (PDF) 📄 Offer letter ✓ Due diligence
Listing remarks
Take advantage of this great investment opportunity! Spacious 2-bedroom, 1.5-bath home available for under $50,000! Boasting 1,109 square ft, this property features a charming, covered side porch, perfect for relaxing or entertaining guests. The exterior has been recently updated. Don't miss your chance to invest in a property that combines affordability with recent improvements! Note: A home inspection was conducted prior to the previous buyer terminating. A list of the issues found can be provided upon request.
Key facts
- Covered side porch
- 7,841 sq ft lot
- Built 1924
Tags
Property features AI
Finance
- HOA & community: No association amenities
Exterior
- Parking: On-site parking (gravel/unpaved)
- Security: Smoke detector(s)
- Utilities: Public water; Natural gas connected; Sewer connected; Water connected
- Home design: Single family residence; One story; Entry on level 1; Residential zoning
- Construction: Wood siding / frame construction; Brick/mortar foundation; Metal roof (see remarks)
- Exterior features: Covered side porch; Corner lot; Has a view
Interior
- Kitchen: No appliances included
- Bedrooms: 5 total rooms (includes bedrooms and living spaces)
- Bathrooms: 1 full bathroom; 1 half bathroom
- Heating & cooling: Natural gas heating; Wall/window cooling unit(s)
- Interior features: Ceiling fan(s); Smoke detector(s)
- Laundry & utility: Washer hookup
Neighborhood map
What this means for you Summary
Snapshot
- This is a 2-bed/1.0-bath single-family listed at $45k.
Deal economics
- At list price, monthly cash flow is $670 ($8k/yr) — positive.
- The deal already cash-flows at list — no discount required.
- Meets the 1% rule at list price ($1k rent vs $45k).
- Recommended offer: $41k (9.0% below list) — sets the bar for market timing.
- Cap rate 24.2% vs local median 4.5% in Rocky Mount — top-decile yield for the area; either an underpriced asset or a hidden risk that comps aren't pricing in. Stress-test before assuming the spread holds.
Location & tenants
- Location reads 70/100 on livability (#134 in NC) — a middle-class / working-renter tenant base. Strengths: cost of living A+, housing A+, health & safety A+; Watch: crime F, amenities F, employment F.
- Nash-Rocky Mount Schools (rural): math 20% / reading 32% proficiency, ranked #155 of 178 in NC (top 87%) — low school quality limits family demand, transient renter base, plan for 1-2y turnover.
- Zoned schools: Bailey Elementary (math 24% / reading 28%, grade F, #1,085 of 1,410 statewide, top 77%, 538 students, 75% FRL); Rocky Mount Middle (math 7% / reading 26%, grade F, #449 of 475 statewide, top 96%, 407 students, 97% FRL); Rocky Mount High (math 27% / reading 36%, grade F, #449 of 535 statewide, top 85%, 1,072 students, 76% FRL) — zoned schools average 82% FRL vs 59% district-wide (23 pts higher); higher-poverty schools than district average — tighter screening recommended.
- Market conditions: Rents rising fast (+5.5%/yr); 175 active listings in the ZIP; 500 units permitted in Nash County in 2024 (0 in 5+ unit buildings).
Forward outlook
- Local home prices are declining (-3.0%/yr); year-one equity from $310 of loan paydown is wiped out by about $1k of value loss. Plan a longer hold.
- Nash County population projected at -12% by 2050 — secular population decline; favor cash flow + early exit over multi-decade hold.
- At projected returns (-3.0% appreciation + 5.5% rent growth), your $13k cash investment doubles in ~2 years — after that, you're playing with house money.
Negotiation context
- It's been on market 106 days — a 9% lower offer ($41k) is reasonable based on typical stale-listing flexibility.
- 2 sale attempts; this cycle's ask has dropped $5k (10%) from the opening price — seller is motivated, your offer sets the floor, not the list.
Risks & watch-outs
- Watch-outs: built in 1924 — expect roof / HVAC / electrical / plumbing capex.
- Climate carrying-cost: major wind risk, 72% chance of damaging wind over 30y; extreme-heat days projected 7→16/yr by 2055 (HVAC capex compounding) — expect insurance premiums to compound above CPI over the hold.
Questions for the listing agent
- It's been on market 106 days. Have you received any prior offers? Is the seller open to a 9% concession, seller financing, or rate buy-down credit?
- Built in 1924 — when were the roof, HVAC, electrical panel, plumbing, and water heater last replaced?
- Why hasn't it sold? Are there any deal-killer items the seller is aware of (foundation, flood, title, zoning, code violations)?
- Is there a deadline driving the sale (1031 exchange, divorce, estate, relocation)? That informs how much negotiation room exists.
- Schools are F-rated, which usually means shorter tenancies and higher turnover. Who's the typical renter profile here, and what's been the actual vacancy rate?
- Crime grade is F in this area — have there been break-ins, vandalism, or insurance claims at this property in the last 3 years? What carrier currently insures it and at what premium?
- What's the average days-on-market for RENTAL listings here right now (not sales)? A rising rental-DOM trend means longer vacancies and softer asking-rent achievability than the comps imply.
- What's the recent tenant-quality profile in this submarket — average credit score on applications, eviction rate, late-payment / NSF rate, and stable-employment percentage? A property-management company in the area should have these aggregated.
- How much new for-sale + rental construction is in the pipeline within 1–3 miles? Heavy new supply typically softens prices + rents 12–24 months out; constrained supply supports both.
Investment metrics
- 1% rule
- 2.66% ✓
- Cap rate
- 24.21%
- Cash-on-cash
- 63.99%
- DSCR
- 3.85
- GRM
- 3.1
CMA / ARV
- ARV (on-the-fly)
- $107,016
- Comps found
- 12
Show comp detail 12 sales within ~0.75 mi
| Address | Dist | Beds/Ba | Sqft | Sold | Price | $/sf | Match |
|---|---|---|---|---|---|---|---|
| 704 S Pine St | 0.12mi | 3/1.0 (+1) | 1,020 (-7%) | 7mo | $67,000 | $66 | 72 |
| 516 S Pine St | 0.10mi | 3/1.0 (+1) | 1,010 (-8%) | 7mo | $154,500 | $153 | 72 |
| 617 S Taylor St | 0.56mi | 2/1.0 | 1,117 (+2%) | 6mo | $146,000 | $131 | 64 |
| 1005 W Thomas St | 0.61mi | 2/1.0 | 1,150 (+5%) | 2mo | $118,000 | $103 | 61 |
| 835 Western Ave | 0.34mi | 2/1.0 | 988 (-10%) | 10mo | $56,000 | $57 | 60 |
| 513 Mullins St | 0.64mi | 3/1.0 (+1) | 1,056 (-3%) | 4mo | $103,000 | $98 | 56 |
| 623 Henry St | 0.46mi | 3/1.0 (+1) | 1,188 (+9%) | 4mo | $21,000 | $18 | 56 |
| 414 Dexter St | 0.56mi | 3/1.0 (+1) | 1,154 (+6%) | 8mo | $62,500 | $54 | 53 |
| 605 Dexter St | 0.52mi | 3/1.0 (+1) | 1,216 (+11%) | 2mo | $65,000 | $53 | 51 |
| 1112 Western Ave | 0.49mi | 3/1.5 (+1) | 1,176 (+8%) | 12mo | $178,000 | $151 | 47 |
| 1200 Calvary St | 0.75mi | 3/1.0 (+1) | 1,050 (-4%) | 10mo | $140,000 | $133 | 45 |
| 640 Beaman St | 0.70mi | 2/1.0 | 965 (-12%) | 5mo | $51,500 | $53 | 44 |
Match score weights: distance 35% · size 25% · config 20% · recency 20%. Top-matched comps best support the ARV.
Projected returns pro-forma
-3.0% appreciation · 5.51% rent growth · sell at horizon
- IRR
- 65.8%
- Equity multiple
- 4.06×
- Total profit
- $38,513
- Equity at exit
- $6,695
- IRR
- 70.8%
- Equity multiple
- 9.10×
- Total profit
- $101,867
- Equity at exit
- $3,882
Cash invested: $12,572 (down + closing). Projections, not guarantees.
Landlord ↔ Tenant lean methodology
- Overall (STATE)
- 85 Strongly Landlord-Friendly
- State North Carolina
- 85 Strongly Landlord-Friendly · R+3
- County
- — inherits STATE
- City
- — inherits STATE
ZIP-level market 27803
- Rents YoY
- 5.5%
- Active inventory
- 175
- Price-to-rent
- 3.1×
Monthly cashflow live
- Estimated rent
- $1,195 medium interval (Pro) →
- Mortgage (P&I)
- −$235
- Tax from tax record
- −$20 /mo · $236/yr
- Insurance
- −$19
- HOA
- −$0
- Vacancy / Maint / Mgmt
- −$251
- Net cashflow
- $670
Break-even live
Sensitivity live
| Price | -10% $696 | -5% $683 | +0% $670 | +5% $658 | +10% $645 |
|---|---|---|---|---|---|
| Rent | -10% $576 | -5% $623 | +0% $670 | +5% $718 | +10% $765 |
| Rate | -1.0pp $693 | -0.5pp $682 | base $670 | +0.5pp $659 | +1.0pp $647 |
UW: 25.0% down · 7.5% · 30yr · 1.5% tax · 5.0% vac · 8.0% maint · 8.0% mgmt
Financing live
Cash to close
- Down payment
- $11,225
- Closing costs
- $1,347
- Reserves months
- —
- Total cash needed
- —
Loan-product check · same deal, 3 products live
Conventional
25% down · 7.5% · 30yr
- Down + closing
- —
- Monthly P&I
- —
- Monthly cashflow
- —
- DSCR
- —
- Eligible?
- —
Personal DTI + credit; lowest rate.
DSCR
20% down · 8.5% · 30yr
- Down + closing
- —
- Monthly P&I
- —
- Monthly cashflow
- —
- DSCR
- —
- Eligible?
- —
No personal income docs; deal must DSCR.
Hard money
10% down · 12.0% · 12mo
- Down + closing
- —
- Monthly P&I
- —
- Monthly cashflow
- —
- DSCR
- —
- Eligible?
- —
Short-term bridge; refi at stabilization.
Listing history 23 events
-
2026-06-21days on market $44,900 Active 106 DOM
-
2026-06-19days on market $44,900 Active 104 DOM
-
2026-06-18days on market $44,900 Active 103 DOM
-
2026-06-17days on market $44,900 Active 102 DOM
-
2026-06-16days on market $44,900 Active 101 DOM
-
2026-06-15days on market $44,900 Active 100 DOM
-
2026-06-14days on market $44,900 Active 98 DOM
-
2026-06-13days on market $44,900 Active 97 DOM
-
2026-06-10days on market $44,900 Active 95 DOM
-
2026-06-09days on market $44,900 Active 94 DOM
-
2026-06-08days on market $44,900 Active 93 DOM
-
2026-06-07days on market $44,900 Active 92 DOM
-
2026-06-03days on market $44,900 Active 88 DOM
-
2026-06-02days on market $44,900 Active 87 DOM
-
2026-06-01days on market $44,900 Active 86 DOM
-
2026-06-01remarks 521-char remark
-
2026-05-31days on market $44,900 Active 85 DOM
-
2026-05-30days on market $44,900 Active 84 DOM
-
2026-05-12historical Active Under Contract
-
2026-04-24price $44,900
-
2026-04-07status Active
-
2026-03-25historical Active Under Contract
-
2026-03-06$49,900 Active
ⓘ Source: listings_history table (triggers on properties + properties_extension) + one-shot
backfill from property_details.listing_events for pre-trigger history.
Tax reassessment forecast NC · Resets to sale price
- Current annual tax
- $236 · $20/mo
- Projected year-2 tax
- $368 · $31/mo
- Expected delta
- +$132/yr (+$11/mo · 56.0%)
ⓘ Screening estimate from a state-policy table — verify with the county assessor before closing.
Climate risk First Street
- Flood 4/10 Moderate FEMA zone X (unshaded) · 24% chance over 30 yrs
- Wildfire 2/10 Low
- Heat 8/10 Severe 7 d/yr ≥107°F today · 16 d/yr by 30 yrs out
- Wind 6/10 Major 72% chance of damaging wind over 30 yrs
- Air quality 2/10 Low 1 unhealthy d/yr today · 2 by 30 yrs out
Nearby sold comps map
Loading sold comps map…
Walkable amenities ~0.75 mi
Loading nearby amenities…
Taxation est. · year 1
- Rental income
- $14,343
- − Mortgage interest
- −$2,515
- − Property taxes
- −$236
- − Insurance
- −$224
- − Repairs & maintenance
- −$1,147
- − Management
- −$1,147
- − Depreciation
- −$1,306
- Taxable income
- $7,766
- Est. tax owed @ 24.0%
- −$1,864
- After-tax cash flow
- $6,181/yr
For passive investors: Depreciation is non-cash, so a rental often shows a tax loss while cash-flowing — sheltering income. Rental losses are passive: they offset passive income freely, and up to $25,000/yr can offset ordinary (W-2) income if you actively participate and your MAGI is under $100k (phasing out to $0 by $150k); unused losses carry forward. On sale, claimed depreciation is recaptured at up to 25%, and gains may owe capital-gains tax (a 1031 exchange can defer both). Figures are a year-1 estimate at your 24.0% rate — not tax advice; consult a CPA.
Schools (NCES district)
- District
- Nash-Rocky Mount Schools
- NCES district ID
- 3703270
- Math proficiency
- 20% ▼ -3.00%
- Reading proficiency
- 32% ▲ 1.00%
- Median HH income
- $41,553
- Composite
- 22.04/100
- National rank
- #8198
- State rank
- #155 of 178 in NC
Livability — Rocky Mount
- Score
- 70/100
- State rank
- #134
- US rank
- #7692
Category grades
Schools grade is shown separately in the Schools card above.
Census & demographics
- Census place
- Rocky Mount, NC
- County
- Nash County · 50,768 people
- City population
- 70,300
- Metro
- Rocky Mount, NC
- Population (ZIP)
- 20,055
- Household income
- $60,124
- Rent vs Own
- Severe rent burden
- 641.0
Population outlook (Nash County) Hauer SSP2
- Today (2025)
- 91,107 people
- By 2030
- 89,193 · -2.1%
- By 2040
- 84,959 · -6.7%
- By 2050
- 80,517 · -11.6%
- By 2075
- 72,941 · -19.9%
- By 2100
- 63,602 · -30.2%
Race, ethnicity, and origin ACS 2023
- Neighborhood character
- Diverse neighborhood (Simpson 0.60)
- Race & ethnicity
- White 46% Black 44% Two or more races 6% Hispanic / Latino 5% Asian 1%
- Common ancestry
- Iranian 1% Italian 1% Slovak 1%
- Foreign-born
- 3% · Canada
- Languages at home
- 93% English-only · Spanish 5% Arabic 1% Other Indo-European 1%
Political lean MEDSL · Nash
- 2024 margin
- Toss-up / Even · D 48.7% · R 50.5%
- 2008→2024 swing
- -0.4pp no change · 2008: -1.3pp · 2024: -1.8pp
- All cycles
- 2024: R+1.8 2020: D+0.2 2016: R+0.2 2012: D+0.9 2008: R+1.3
Not yet ingested
- Civics
- —
Market trends
- HPI YoY
- ▼ -162.95%
- Current HPI
- 190.0204
- Rent YoY
- ▲ 5.51%
- Metro
- Rocky Mount, NC
- State GDP YoY
- ▲ 3.28%
- F500 in state
- 26
Industry mix (Fortune 500 HQ in NC)
| Industry | F500 HQs | Revenue |
|---|---|---|
| Financial Services | 2 | $213B |
|
||
| Retail | 2 | $95B |
|
||
| Industrial Conglomerate | 1 | $38B |
|
||
| Metals / Steel | 1 | $35B |
|
||
| Utilities | 1 | $30B |
|
||
| Industrial Machinery | 1 | $19B |
|
||
Price history
-10.0% since first listed5 events — show timeline
- 2026-05-12 Contingent — Hive MLS
- 2026-04-24 Price Changed $44,900 Hive MLS
- 2026-04-07 Relisted — Hive MLS
- 2026-03-25 Contingent — Hive MLS
- 2026-03-06 Listed $49,900 Hive MLS
Property tax history
+0.7%/yrLatest (2025): $236 · +0.0% YoY. Source: county tax records.
Cash-flow waterfall
monthlySold comps — $/sqft
last 12 mo · ≤1 miLoading sold comps…