 Duplex
None · New York, NY
Flood risk 8/10 · Major
- FEMA flood zone
- X (unshaded)
- Chance of flooding over 30 yrs
- 0.78%
- Est. flood insurance / yr
- $507 – $1,088
Fire risk 1/10 · Minimal
- Est. fire insurance / yr
- $691 – $1,283
Heat risk 7/10 · Major
- Hot days now (above 97°F)
- 7 days/yr
- Hot days in 30 yrs
- 16 days/yr
Wind risk 6/10 · Moderate
- Chance of severe wind over 30 yrs
- 65.0%
Air-quality risk 5/10 · Moderate
- Unhealthy air days now
- 6 days/yr
- Unhealthy air days in 30 yrs
- 8 days/yr
Risk factors via First Street. Map © Google.
Why this score? — see what drove the C- grade
The composite is a weighted blend of 9 inputs, each scored 0–100. Each bar is that input's sub-score; the figure is the points it added to the 100-point composite (weight × sub-score).
- Cash flow +17.9/30.0
- ARV discount +7.5/15.0
- DSCR +5.6/10.0
- Rent growth +5.0/5.0
- Schools +5.0/10.0
- 1% rule +4.1/10.0
- Livability +3.8/5.0
- Condition / age +2.5/5.0
- Appreciation +0.0/10.0
$900,000
🖨 Deal sheet 📄 Offer letter ✓ Due diligence
Multi-family units
County records classify this as Multi-Family (2-4 Unit). Listing-text estimate: 2 units. confirmed
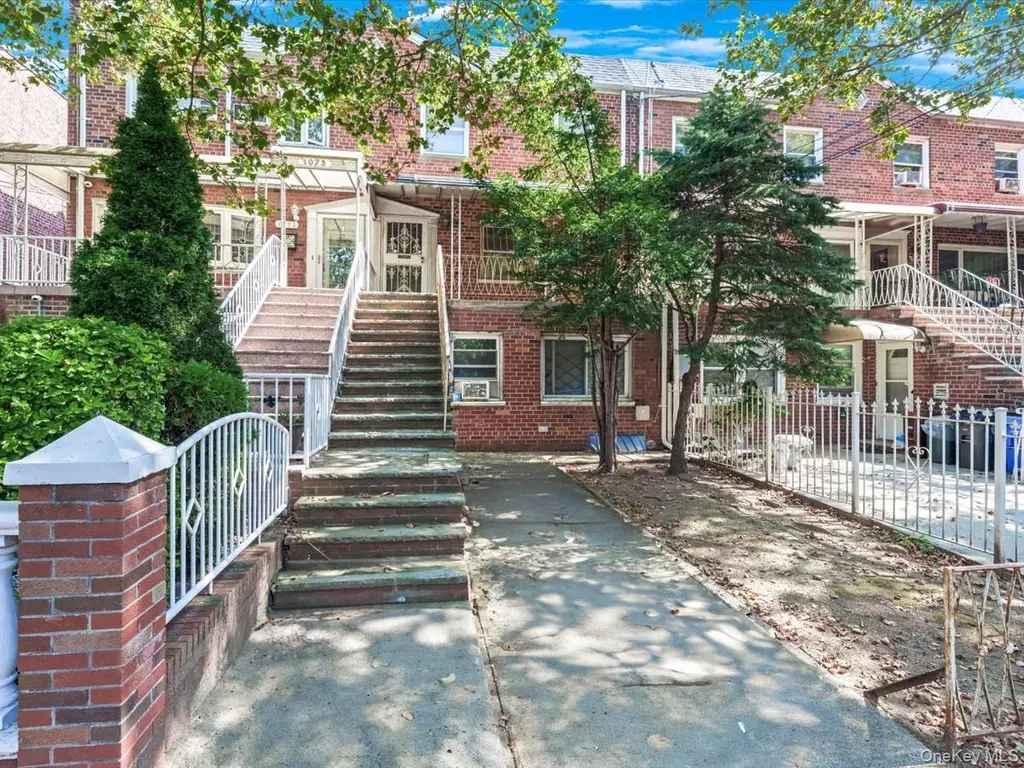
Listing remarks
* 203k loan or rehab loan required * * Huge Multi-Family Property over 3000+ interior sqft * * Buying As-Is * Discover the potential of this spacious two-family duplex (Possible Three family w/ proper permits) in the sought after Flatlands neighborhood of Brooklyn. Featuring 5 bedrooms (Plenty of room to expand), 2.5 bathrooms, an attached two-car garage, Full unfinished basement and a private carport, this property is a rare find. The first unit (ground level) is a recently updated 2-bedroom, 1-bath apartment with a dependable occupant. The second unit is currently vacant, needs some TLC yet offers endless possibilities, bring your vision and transform it into the perfect owner’
Key facts
- Two family duplex
- Private carport
- Prime location
Tags
Property features AI
Exterior
- Parking: Attached covered parking; Private carport (3 spaces); 1-car garage
- Utilities: Con-Edison electric service; Natural gas connected; Public sewer; Public water connected; Trash collection (public); Cable available
- Home design: Townhouse structure; Duplex property; Fixer condition
- Construction: Brick and frame construction; Full unfinished basement with storage
- Exterior features: Back yard; Near public transit; Near shops; Near school; Not waterfront
Interior
- Kitchen: Eat-in kitchen(s)
- Bedrooms: One 2-bedroom unit; One 3-bedroom unit
- Flooring: Hardwood floors
- Bathrooms: Three full bathrooms
- Heating & cooling: Natural gas heating; Wall/window air conditioning units
- Interior features: Eat-in kitchen; Entrance foyer; Storage; Covered porch/patio
- Laundry & utility: Utility/storage in basement
Neighborhood map
What this means for you Summary
Snapshot
- This is a 2 × 5-bed/?-bath units multifamily listed at $900k.
Deal economics
- At list price, monthly cash flow is $693 ($8k/yr) — positive. Per door: $346/mo.
- The deal already cash-flows at list — no discount required.
- To meet the 1% rule (rent ≥ 1% of price), the offer needs to be $817k (9.2% below list).
- Recommended offer: $817k (9.2% below list) — sets the bar for 1% rule.
- Cap rate 7.3% vs local median 2.6% in New York — top-decile yield for the area; either an underpriced asset or a hidden risk that comps aren't pricing in. Stress-test before assuming the spread holds.
Location & tenants
- Location reads 75/100 on livability (#268 in NY, #4,188 nationally) — a middle-class / working-renter tenant base. Strengths: amenities A+, commute A+, health & safety A; Watch: crime F, cost of living F.
- Market conditions: Rents rising fast (+16.2%/yr); 459 active listings in the ZIP; solid renter incomes; 10,063 units permitted in Kings County in 2024 (9,789 in 5+ unit buildings).
- At $8,171/mo this rent would consume 101% of the median local household income ($97k/yr) (locally 2384% of renters already pay >50% of income on rent) — very limited rent-growth headroom before tenants either downsize or default.
Forward outlook
- Local home prices are declining (-3.0%/yr); year-one equity from $6k of loan paydown is wiped out by about $27k of value loss. Plan a longer hold.
- Kings County population projected at +13% by 2050 — modest demand growth; plan on rents tracking national, not racing it.
- At projected returns (-3.0% appreciation + 8.0% rent growth), your $252k cash investment doubles in ~10 years — after that, you're playing with house money.
Negotiation context
- It's been on market 63 days — a 6% lower offer ($846k) is reasonable based on typical stale-listing flexibility.
Risks & watch-outs
- Watch-outs: flood insurance adds $66/mo.
- Climate carrying-cost: severe flood risk; major wind risk, 65% chance of damaging wind over 30y; extreme-heat days projected 7→16/yr by 2055 (HVAC capex compounding) — expect insurance premiums to compound above CPI over the hold.
Questions for the listing agent
- It's been on market 63 days. Have you received any prior offers? Is the seller open to a 9% concession, seller financing, or rate buy-down credit?
- Can we see the unit-by-unit rent roll, current vacancy, and any below-market leases? What's the average tenancy length?
- What capital expenditures (roof, boiler, parking lot, exteriors) have been made in the last 5 years, and what's planned in the next 2?
- Built in 1960 — when were the roof, HVAC, electrical panel, plumbing, and water heater last replaced?
- What's the actual annual flood-insurance premium (NFIP or private), and is the property in a SFHA with mandatory coverage?
- Why hasn't it sold? Are there any deal-killer items the seller is aware of (foundation, flood, title, zoning, code violations)?
- Is there a deadline driving the sale (1031 exchange, divorce, estate, relocation)? That informs how much negotiation room exists.
- Schools are B-rated — typically a magnet for longer-tenancy family renters. What's the average tenant stay here, and is there a school-zone premium baked into asking?
- Crime grade is F in this area — have there been break-ins, vandalism, or insurance claims at this property in the last 3 years? What carrier currently insures it and at what premium?
- What's the average days-on-market for RENTAL listings here right now (not sales)? A rising rental-DOM trend means longer vacancies and softer asking-rent achievability than the comps imply.
- What's the recent tenant-quality profile in this submarket — average credit score on applications, eviction rate, late-payment / NSF rate, and stable-employment percentage? A property-management company in the area should have these aggregated.
- How much new apartment / multifamily construction is in the pipeline within 1–3 miles? Heavy new supply (>2% of stock underway) typically softens rents 12–24 months out; light construction supports rent growth.
Investment metrics
- 1% rule
- 0.91% ✗
- Cap rate
- 7.31%
- Cash-on-cash
- 3.62%
- DSCR
- 1.16
- GRM
- 9.2
CMA / ARV
No comps found within radius.
Projected returns pro-forma
-3.0% appreciation · 8.0% rent growth · sell at horizon
- IRR
- -6.0%
- Equity multiple
- 0.77×
- Total profit
- $-58,694
- Equity at exit
- $134,193
- IRR
- 8.6%
- Equity multiple
- 1.80×
- Total profit
- $201,601
- Equity at exit
- $77,816
Cash invested: $252,000 (down + closing). Projections, not guarantees.
Landlord ↔ Tenant lean methodology
- Overall (CITY)
- 0 Strongly Tenant-Friendly
- State New York
- 15 Strongly Tenant-Friendly · D+10
- County
- — inherits STATE
- City New York
- 0 Strongly Tenant-Friendly · D+34
ZIP-level market 11234
- Rents YoY
- 16.2%
- Active inventory
- 459
- Price-to-rent
- 18.4×
Monthly cashflow live
- Estimated rent
- $8,171 medium interval (Pro) →
- Mortgage (P&I)
- −$4,720
- Tax from tax record
- −$601 /mo · $7,214/yr
- Insurance
- −$375
- Flood insurance flood zone
- −$66 /mo · $798/yr
- HOA
- −$0
- Vacancy / Maint / Mgmt
- −$1,716
- Net cashflow
- $693
Break-even live
2-unit breakdown (identical units grouped — click to expand)
| Units | Beds | Baths | Est. rent |
|---|---|---|---|
| 2× units | 5 | — | $8,172 |
| #1 | 5 | — | $4,086 |
| #2 | 5 | — | $4,086 |
| Total (2 units) | $8,171 | ||
UW: 25.0% down · 7.5% · 30yr · 1.5% tax · 5.0% vac · 8.0% maint · 8.0% mgmt
Financing live
Cash to close
- Down payment
- $225,000
- Closing costs
- $27,000
- Reserves months
- —
- Total cash needed
- —
Loan-product check · same deal, 3 products live
Conventional
25% down · 7.5% · 30yr
- Down + closing
- —
- Monthly P&I
- —
- Monthly cashflow
- —
- DSCR
- —
- Eligible?
- —
Personal DTI + credit; lowest rate.
DSCR
20% down · 8.5% · 30yr
- Down + closing
- —
- Monthly P&I
- —
- Monthly cashflow
- —
- DSCR
- —
- Eligible?
- —
No personal income docs; deal must DSCR.
Hard money
10% down · 12.0% · 12mo
- Down + closing
- —
- Monthly P&I
- —
- Monthly cashflow
- —
- DSCR
- —
- Eligible?
- —
Short-term bridge; refi at stabilization.
Listing history 12 events
-
2026-06-18days on market $900,000 Active 63 DOM
-
2026-06-17days on market $900,000 Active 62 DOM
-
2026-06-15days on market $900,000 Active 60 DOM
-
2026-06-13days on market $900,000 Active 58 DOM
-
2026-06-10days on market $900,000 Active 54 DOM
-
2026-06-08days on market $900,000 Active 53 DOM
-
2026-06-08days on market $900,000 Active 52 DOM
-
2026-06-04days on market $900,000 Active 49 DOM
-
2026-06-03days on market $900,000 Active 48 DOM
-
2026-06-01days on market $900,000 Active 46 DOM
-
2026-05-31days on market $900,000 Active 45 DOM
-
2025-09-30$900,000 Active
ⓘ Source: listings_history table (triggers on properties + properties_extension) + one-shot
backfill from property_details.listing_events for pre-trigger history.
Tax reassessment forecast NY · Partial reset (capped growth)
- Current annual tax
- $7,214 · $601/mo
- Projected year-2 tax
- $11,212 · $934/mo
- Expected delta
- +$3,998/yr (+$333/mo · 55.4%)
ⓘ Screening estimate from a state-policy table — verify with the county assessor before closing.
Climate risk First Street
- Flood 8/10 Severe FEMA zone X (unshaded) · 78% chance over 30 yrs
- Wildfire 1/10 Low
- Heat 7/10 Severe 7 d/yr ≥97°F today · 16 d/yr by 30 yrs out
- Wind 6/10 Major 65% chance of damaging wind over 30 yrs
- Air quality 5/10 Major 6 unhealthy d/yr today · 8 by 30 yrs out
Nearby sold comps map
Loading sold comps map…
Walkable amenities ~0.75 mi
Loading nearby amenities…
Taxation est. · year 1
- Rental income
- $98,052
- − Mortgage interest
- −$50,414
- − Property taxes
- −$7,214
- − Insurance
- −$5,298
- − Repairs & maintenance
- −$7,844
- − Management
- −$7,844
- − Depreciation
- −$26,182
- Taxable loss
- −$6,744
- Est. tax savings @ 24.0%
- +$1,619
- After-tax cash flow
- $9,931/yr
For passive investors: Depreciation is non-cash, so a rental often shows a tax loss while cash-flowing — sheltering income. Rental losses are passive: they offset passive income freely, and up to $25,000/yr can offset ordinary (W-2) income if you actively participate and your MAGI is under $100k (phasing out to $0 by $150k); unused losses carry forward. On sale, claimed depreciation is recaptured at up to 25%, and gains may owe capital-gains tax (a 1031 exchange can defer both). Figures are a year-1 estimate at your 24.0% rate — not tax advice; consult a CPA.
Schools (NCES district)
No district data.
Livability — New York
- Score
- 75/100
- State rank
- #268
- US rank
- #4188
Category grades
Schools grade is shown separately in the Schools card above.
Census & demographics
- Census place
- New York, NY
- County
- Kings County · 2,614,986 people
- City population
- 7,731,280
- Metro
- New York-Newark-Jersey City, NY-NJ-PA
- Population (ZIP)
- 83,187
- Household income
- $97,479
- Rent vs Own
- Severe rent burden
- 2384.0
Population outlook (Kings County) Hauer SSP2
- Today (2025)
- 2,847,441 people
- By 2030
- 2,937,006 · +3.1%
- By 2040
- 3,095,491 · +8.7%
- By 2050
- 3,228,968 · +13.4%
- By 2075
- 3,321,723 · +16.7%
- By 2100
- 3,111,387 · +9.3%
Race, ethnicity, and origin ACS 2023
- Neighborhood character
- Diverse neighborhood (Simpson 0.69)
- Race & ethnicity
- Black 42% White 35% Hispanic / Latino 10% Asian 8% Two or more races 7%
- Hispanic origin (detail)
- Mexican 1% Puerto Rican 4%
- Common ancestry
- Hispanic 8% Scotch-Irish 3% Romanian 2%
- Foreign-born
- 35% · Canada, China, Mexico
- Languages at home
- 65% English-only · French/Haitian/Cajun 9% Spanish 7% Russian/Polish/Slavic 6%
Political lean MEDSL · Kings
- 2024 margin
- Solid D (+44.0) · D 72.0% · R 28.0%
- 2008→2024 swing
- -15.5pp toward R · 2008: 59.4pp · 2024: 44.0pp
- All cycles
- 2024: D+44.0 2020: D+54.8 2016: D+61.8 2012: D+63.9 2008: D+59.4
Not yet ingested
- Civics
- —
Market trends
- HPI YoY
- ▼ -667.47%
- Current HPI
- 318.0416
- Rent YoY
- ▲ 16.21%
- Metro
- New York-Newark-Jersey City, NY-NJ-PA
- State GDP YoY
- ▲ 2.60%
- F500 in state
- 92
Industry mix (Fortune 500 HQ in NY)
| Industry | F500 HQs | Revenue |
|---|---|---|
| Financial Services | 10 | $950B |
|
||
| Consumer Goods | 9 | $162B |
|
||
| Insurance | 4 | $225B |
|
||
| Telecommunications | 2 | $144B |
|
||
| Pharmaceuticals | 2 | $112B |
|
||
| Media / Entertainment | 2 | $69B |
|
||
Price history
1 event — show timeline
- 2025-09-30 Listed $900,000 OneKey® MLS as Distributed by MLS Grid
Property tax history
+3.2%/yrLatest (2025): $7,214 · -2.4% YoY. Source: county tax records.
Cash-flow waterfall
monthlySold comps — $/sqft
last 12 mo · ≤1 miLoading sold comps…