 🏗️ New Construction
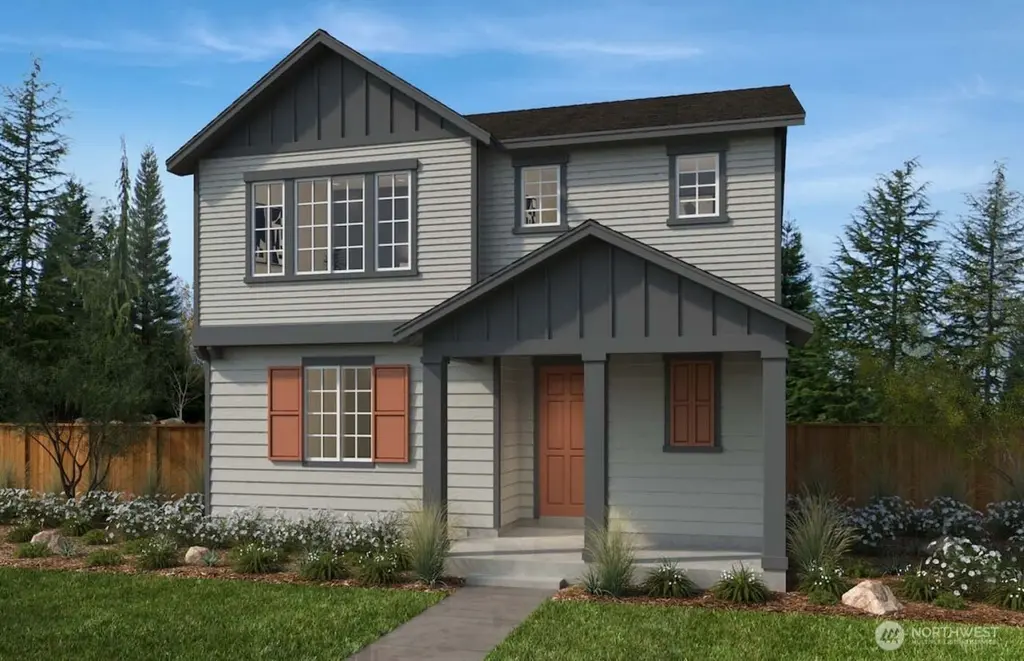
6281 Crestner Dr SW #392 · Port Orchard, WA
Flood risk No data
- FEMA flood zone
- —
- Chance of flooding over 30 yrs
- —
- Est. flood insurance / yr
- —
Fire risk No data
- Est. fire insurance / yr
- —
Heat risk No data
- Hot days now (above threshold)
- —
- Hot days in 30 yrs
- —
Wind risk No data
- Chance of severe wind over 30 yrs
- —
Air-quality risk No data
- Unhealthy air days now
- —
- Unhealthy air days in 30 yrs
- —
Risk factors via First Street. Map © Google.
Why this score? — see what drove the F grade
The composite is a weighted blend of 9 inputs, each scored 0–100. Each bar is that input's sub-score; the figure is the points it added to the 100-point composite (weight × sub-score).
- ARV discount +7.5/15.0
- Schools +5.2/10.0
- Cash flow +4.6/30.0
- Livability +4.0/5.0
- Rent growth +2.9/5.0
- Condition / age +2.5/5.0
- 1% rule +0.7/10.0
- DSCR +0.0/10.0
- Appreciation +0.0/10.0
$524,950
🖨 Deal sheet (PDF) 📄 Offer letter ✓ Due diligence
Listing remarks
Welcome to the Master Planned Community of McCormick Communities! This 2,457 SF home features 4 bedrooms plus a den and includes the ability to Personalize interior finishes through the Design Studio to create a one-of-a-kind home. This plan can also be personalized to include a wide range of structural features such as covered patio fireplace and other amenities. Enjoy open concept living, quartz countertops in kitchen and bathrooms, luxury vinyl plank flooring, white painted millwork, and stainless appliances. Fully fenced, landscaped backyard. ENERGY STAR® certified for comfort and efficiency. Minutes from freeways, trails, and parks. Lot premiums may apply.
Key facts
- Quartz countertops
- Stainless appliances
- Open-concept living
Tags
Property features AI
Finance
- Other: Lot features include plot-plan lot number 392; level topography
- Financial info: Acceptable financing: Cash, Conventional, FHA, VA
- HOA & community: Monthly HOA fee of $71 covering common area maintenance; Community features: athletic court, CCRs, golf, park, playground, trails
Exterior
- Parking: Attached garage with 2 covered spaces
- Utilities: Public water (Kitsap); Sewer connected (Kitsap); Electric service (PSE); Cable and internet: Comcast
- Home design: Single-family residence; Two-story home; Built on lot (new construction, presale); Composition roof; Has a view
- Construction: Cement plank construction; Poured concrete foundation; New construction by KB Home; Estimated completion: 2027-09-30
- Exterior features: Cement plank siding; Garden space; Alley access; Curbs and paved streets; Sidewalks
Interior
- Kitchen: Dishwasher; Garbage disposal; Microwave; Stove/Range
- Bedrooms: 4 bedrooms (all on upper level)
- Flooring: Vinyl plank; Carpet
- Bathrooms: 1 full bath; 1 three-quarter bath; 1 half bath; 1 bathtub; 2 showers
- Heating & cooling: Forced air heating; Heat pump; Central air conditioning
- Interior features: Dining room; High-tech cabling; Loft; Walk-in closets; Water heater
- Laundry & utility: Hybrid water heater located in the garage
Neighborhood map
What this means for you Summary
Snapshot
- This is a 4-bed/2.5-bath single-family listed at $525k.
Deal economics
- At list price, monthly cash flow is $-2k ($-20k/yr) — negative.
- To cash-flow at today's rent, offer at most $424k (19.2% below list).
- To meet the 1% rule (rent ≥ 1% of price), the offer needs to be $380k (27.6% below list).
- Recommended offer: $380k (27.6% below list) — sets the bar for 1% rule.
Location & tenants
- Location reads 79/100 on livability (#110 in WA, #2,167 nationally) — a middle-class / working-renter tenant base. Strengths: amenities A+, employment A+, housing A+; Watch: crime D-, commute F, cost of living F.
- South Kitsap School District (suburban): math 52% / reading 64% proficiency, ranked #71 of 291 in WA (top 24%) — acceptable for families but not a draw, mixed tenant base, ~2y average lease.
- Zoned schools: Sunnyslope Elementary School (437 students, 33% FRL); South Kitsap High School (2,389 students, 40% FRL).
- Market conditions: Rents rising (+1.6%/yr); 356 active listings in the ZIP; 4 comparable units currently listed for rent nearby; rentals at typical pace (median 23d on market — plan ~3-4 weeks tenant-placement turnaround); high-income renter base; 1,294 units permitted in Kitsap County in 2024 (302 in 5+ unit buildings).
- This rent runs 39% of the median local income ($115k/yr) — at the standard rent-burdened threshold; future hikes will face affordability resistance.
Forward outlook
- Local home prices are declining (-3.0%/yr); year-one equity from $5k of loan paydown is wiped out by about $20k of value loss. Plan a longer hold.
- Kitsap County population projected at +8% by 2050 — modest demand growth; plan on rents tracking national, not racing it.
Negotiation context
- Only 7 days on market — expect competitive offers; lowballing is unlikely to land.
Questions for the listing agent
- What do current leases actually rent for vs. the listed asking? Can we see a recent rent roll and the last 12 months of T-12 income?
- What does the HOA fee cover, when was the last increase, and are there any pending special assessments or reserve-fund shortfalls?
- Is there a deadline driving the sale (1031 exchange, divorce, estate, relocation)? That informs how much negotiation room exists.
- Schools are A-rated — typically a magnet for longer-tenancy family renters. What's the average tenant stay here, and is there a school-zone premium baked into asking?
- Crime grade is D in this area — have there been break-ins, vandalism, or insurance claims at this property in the last 3 years? What carrier currently insures it and at what premium?
- The area grade is low — what's the realistic commute time and amenity access for the typical tenant pool here? Any planned neighborhood developments (good or bad) we should know about?
- What's the average days-on-market for RENTAL listings here right now (not sales)? A rising rental-DOM trend means longer vacancies and softer asking-rent achievability than the comps imply.
- What's the recent tenant-quality profile in this submarket — average credit score on applications, eviction rate, late-payment / NSF rate, and stable-employment percentage? A property-management company in the area should have these aggregated.
- How much new for-sale + rental construction is in the pipeline within 1–3 miles? Heavy new supply typically softens prices + rents 12–24 months out; constrained supply supports both.
Investment metrics
- 1% rule
- 0.57% ✗
- Cap rate
- 3.24%
- Cash-on-cash
- -10.90%
- DSCR
- 0.51
- GRM
- 14.7
CMA / ARV
- ARV (median comp)
- $671,134
- List price
- $524,950
- Delta
- -21.78%
- Verdict
- UNDERPRICED
- Comps
- 20 within 1.0 mi
Show comp detail 12 sales within ~0.75 mi
| Address | Dist | Beds/Ba | Sqft | Sold | Price | $/sf | Match |
|---|---|---|---|---|---|---|---|
| 6141 Crestner Dr SW #406 | 0.11mi | 4/2.5 | 2,457 (0%) | 2mo | $600,000 | $244 | 93 |
| 6103 Trace Dr SW | 0.11mi | 4/2.5 | 2,758 (+12%) | 1mo | $661,800 | $240 | 74 |
| 6004 Trace Dr SW | 0.19mi | 3/2.5 (-1) | 2,281 (-7%) | 1mo | $769,950 | $338 | 74 |
| 6043 Trace Dr SW #453 | 0.15mi | 4/2.5 | 2,758 (+12%) | 1mo | $672,950 | $244 | 72 |
| 4360 SW Kerbin Ln #378 | 0.09mi | 4/3.0 | 2,809 (+14%) | 2mo | $739,900 | $263 | 69 |
| 6114 Lochan Rd SW #370 | 0.11mi | 4/3.0 | 2,809 (+14%) | 1mo | $842,346 | $300 | 68 |
| 6178 Telford Way SW Lot 412 | 0.14mi | 3/2.5 (-1) | 2,141 (-13%) | 2mo | $548,235 | $256 | 65 |
| 5733 Trace Dr SW | 0.39mi | 3/2.0 (-1) | 2,258 (-8%) | 1mo | $822,045 | $364 | 61 |
| 5991 Thornhill Ave SW | 0.24mi | 3/2.0 (-1) | 2,099 (-15%) | 2mo | $599,990 | $286 | 56 |
| 5980 Thornhill Ave SW | 0.27mi | 3/2.0 (-1) | 2,099 (-15%) | 1mo | $599,990 | $286 | 55 |
| 6010 SW Thornhill Ave | 0.26mi | 3/2.0 (-1) | 2,099 (-15%) | 2mo | $654,990 | $312 | 54 |
| 4145 SW Bigler Way | 0.38mi | 3/2.5 (-1) | 2,098 (-15%) | 2mo | $814,900 | $388 | 51 |
Match score weights: distance 35% · size 25% · config 20% · recency 20%. Top-matched comps best support the ARV.
Projected returns pro-forma
-3.0% appreciation · 1.6% rent growth · sell at horizon
- IRR
- -37.6%
- Equity multiple
- -0.18×
- Total profit
- $-222,652
- Equity at exit
- $100,068
- IRR
- -65.7%
- Equity multiple
- -0.89×
- Total profit
- $-354,529
- Equity at exit
- $58,027
Cash invested: $187,918 (down + closing). Projections, not guarantees.
Landlord ↔ Tenant lean methodology
- Overall (STATE)
- 28 Tenant-Leaning
- State Washington
- 28 Tenant-Leaning · D+8
- County
- — inherits STATE
- City
- — inherits STATE
ZIP-level market 98367
- Rents YoY
- 1.6%
- Active inventory
- 356
- Price-to-rent
- 11.5×
Monthly cashflow live
- Estimated rent
- $3,800 medium interval (Pro) →
- Mortgage (P&I)
- −$3,520
- Tax est. 1.5%
- −$839 /mo · $10,067/yr
- Insurance
- −$280
- HOA
- −$71
- Vacancy / Maint / Mgmt
- −$798
- Net cashflow
- $-1,707
Break-even live
Sensitivity live
| Price | -10% $-1,243 | -5% $-1,475 | +0% $-1,707 | +5% $-1,939 | +10% $-2,171 |
|---|---|---|---|---|---|
| Rent | -10% $-2,007 | -5% $-1,857 | +0% $-1,707 | +5% $-1,557 | +10% $-1,407 |
| Rate | -1.0pp $-1,369 | -0.5pp $-1,536 | base $-1,707 | +0.5pp $-1,881 | +1.0pp $-2,058 |
UW: 25.0% down · 7.5% · 30yr · 1.5% tax · 5.0% vac · 8.0% maint · 8.0% mgmt
Financing live
Cash to close
- Down payment
- $167,784
- Closing costs
- $20,134
- Reserves months
- —
- Total cash needed
- —
Loan-product check · same deal, 3 products live
Conventional
25% down · 7.5% · 30yr
- Down + closing
- —
- Monthly P&I
- —
- Monthly cashflow
- —
- DSCR
- —
- Eligible?
- —
Personal DTI + credit; lowest rate.
DSCR
20% down · 8.5% · 30yr
- Down + closing
- —
- Monthly P&I
- —
- Monthly cashflow
- —
- DSCR
- —
- Eligible?
- —
No personal income docs; deal must DSCR.
Hard money
10% down · 12.0% · 12mo
- Down + closing
- —
- Monthly P&I
- —
- Monthly cashflow
- —
- DSCR
- —
- Eligible?
- —
Short-term bridge; refi at stabilization.
Rent comps 4 comps
| Address | Beds | Baths | Sqft | Rent | $/sqft | DOM | Units | Dist |
|---|---|---|---|---|---|---|---|---|
| 5924 Trace Dr SW Port Orchard, WA | 4.0 | 4.0 | 2949 | $4,200 | $1.42 | 15d | 1 | 0.22mi |
| 6982 Marymac Dr SW Port Orchard, WA | 4.0 | 2.0 | 2336 | $3,600 | $1.54 | 23d | 1 | 0.94mi |
| 4467 Hibiscus Cir SW Port Orchard, WA | 4.0 | 3.0 | 2700 | $3,550 | $1.31 | 45d | 1 | 1.12mi |
| 4357 Wandering Way Port Orchard, WA | 4.0 | 3.0 | 2758 | $3,495 | $1.27 | 15d | 1 | 1.33mi |
HOA detail
- Monthly dues
- $71 · $852/yr
Listing history 19 events
-
2026-06-21days on market $524,950 Active 7 DOM
-
2026-06-18days on market $524,950 Active 4 DOM
-
2026-06-17days on market $524,950 Active 3 DOM
-
2026-06-16days on market $524,950 Active 2 DOM
-
2026-06-15days on market $524,950 Active 1 DOM
-
2026-06-07days on market $524,950 Active 207 DOM
-
2026-06-05days on market $524,950 Active 204 DOM
-
2026-06-03days on market $524,950 Active 203 DOM
-
2026-06-02days on market $524,950 Active 202 DOM
-
2026-06-01days on market $524,950 Active 201 DOM
-
2026-05-31days on market $524,950 Active 200 DOM
-
2026-05-30days on market $524,950 Active 199 DOM
-
2026-03-27price $524,950
-
2026-02-11price $544,950
-
2026-02-04price $539,950
-
2026-01-15price $559,950
-
2025-12-04price $579,950
-
2025-11-18price $578,950
-
2025-11-12$581,950 Active
ⓘ Source: listings_history table (triggers on properties + properties_extension) + one-shot
backfill from property_details.listing_events for pre-trigger history.
Nearby sold comps map
Loading sold comps map…
Walkable amenities ~0.75 mi
Loading nearby amenities…
Taxation est. · year 1
- Rental income
- $45,601
- − Mortgage interest
- −$37,594
- − Property taxes
- −$10,067
- − Insurance
- −$3,356
- − Repairs & maintenance
- −$3,648
- − Management
- −$3,648
- − HOA
- −$852
- − Depreciation
- −$19,524
- Taxable loss
- −$33,088
- Est. tax savings @ 24.0%
- +$7,941
- After-tax cash flow
- $-12,543/yr
For passive investors: Depreciation is non-cash, so a rental often shows a tax loss while cash-flowing — sheltering income. Rental losses are passive: they offset passive income freely, and up to $25,000/yr can offset ordinary (W-2) income if you actively participate and your MAGI is under $100k (phasing out to $0 by $150k); unused losses carry forward. On sale, claimed depreciation is recaptured at up to 25%, and gains may owe capital-gains tax (a 1031 exchange can defer both). Figures are a year-1 estimate at your 24.0% rate — not tax advice; consult a CPA.
Schools (NCES district)
- District
- South Kitsap School District
- NCES district ID
- 5308160
- Math proficiency
- 52% ▲ 2.00%
- Reading proficiency
- 64% ▲ 3.00%
- Median HH income
- $62,824
- Composite
- 52.31/100
- National rank
- #3445
- State rank
- #71 of 291 in WA
Livability — Port Orchard
- Score
- 79/100
- State rank
- #110
- US rank
- #2167
Category grades
Schools grade is shown separately in the Schools card above.
Census & demographics
- Census place
- Port Orchard, WA
- County
- Kitsap County · 243,099 people
- City population
- 68,721
- Metro
- Bremerton-Silverdale-Port Orchard, WA
- Population (ZIP)
- 31,756
- Household income
- $115,482
- Rent vs Own
- Severe rent burden
- 595.0
Population outlook (Kitsap County) Hauer SSP2
- Today (2025)
- 277,525 people
- By 2030
- 285,040 · +2.7%
- By 2040
- 294,957 · +6.3%
- By 2050
- 300,622 · +8.3%
- By 2075
- 315,580 · +13.7%
- By 2100
- 304,340 · +9.7%
Race, ethnicity, and origin ACS 2023
- Neighborhood character
- Predominantly White (78%)
- Race & ethnicity
- White 78% Two or more races 11% Hispanic / Latino 7% Asian 4% Pacific Islander 1%
- Hispanic origin (detail)
- Mexican 5%
- Common ancestry
- Italian 7% Portuguese 6% Slovak 4%
- Foreign-born
- 6% · Canada, South Korea, Vietnam
- Languages at home
- 91% English-only · Spanish 3% Tagalog/Filipino 2% Other Asian/Pacific 2%
Political lean MEDSL · Kitsap
- 2024 margin
- Strong D (+20.9) · D 58.8% · R 37.9% · Other 3.3%
- 2008→2024 swing
- +8.6pp toward D · 2008: 12.3pp · 2024: 20.9pp
- All cycles
- 2024: D+20.9 2020: D+18.1 2016: D+11.6 2012: D+11.1 2008: D+12.3
Not yet ingested
- Civics
- —
Market trends
- HPI YoY
- ▼ -441.02%
- Current HPI
- 351.671
- Rent YoY
- ▲ 1.60%
- Metro
- Bremerton-Silverdale-Port Orchard, WA
- State GDP YoY
- ▲ 4.65%
- F500 in state
- 22
Industry mix (Fortune 500 HQ in WA)
| Industry | F500 HQs | Revenue |
|---|---|---|
| Retail | 2 | $269B |
|
||
| Technology / Retail | 1 | $638B |
|
||
| Technology | 1 | $245B |
|
||
| Telecommunications | 1 | $38B |
|
||
| Food / Beverage | 1 | $36B |
|
||
| Automotive / Trucks | 1 | $34B |
|
||
Price history
1 event — show timeline
- 2026-06-14 Listed $524,950 NWMLS as Distributed by MLS Grid
Cash-flow waterfall
monthlySold comps — $/sqft
last 12 mo · ≤1 miLoading sold comps…