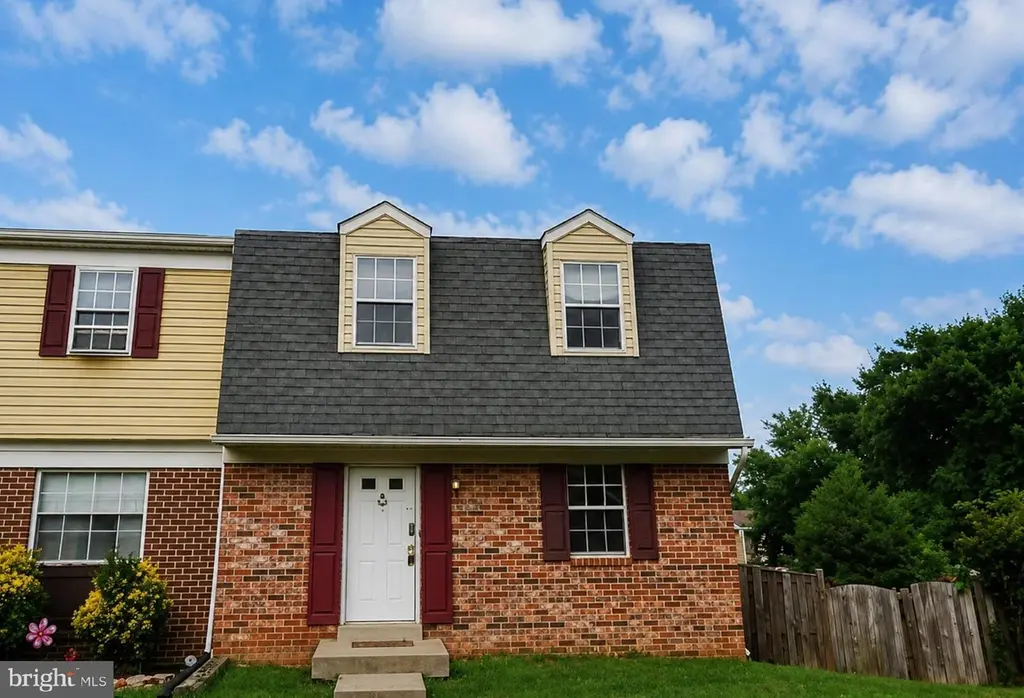
826 Holly Dr · La Plata, MD
Flood risk 1/10 · Minimal
- FEMA flood zone
- X (unshaded)
- Chance of flooding over 30 yrs
- 0.0%
- Est. flood insurance / yr
- $507 – $1,088
Fire risk 4/10 · Minor
- Est. fire insurance / yr
- $755 – $1,403
Heat risk 8/10 · Major
- Hot days now (above 102°F)
- 7 days/yr
- Hot days in 30 yrs
- 16 days/yr
Wind risk 5/10 · Moderate
- Chance of severe wind over 30 yrs
- 25.0%
Air-quality risk 2/10 · Minimal
- Unhealthy air days now
- 1 days/yr
- Unhealthy air days in 30 yrs
- 1 days/yr
Risk factors via First Street. Map © Google.
Why this score? — see what drove the D grade
The composite is a weighted blend of 9 inputs, each scored 0–100. Each bar is that input's sub-score; the figure is the points it added to the 100-point composite (weight × sub-score).
- ARV discount +12.7/15.0
- Cash flow +12.3/30.0
- Livability +3.7/5.0
- DSCR +3.6/10.0
- 1% rule +3.1/10.0
- Rent growth +2.5/5.0
- Condition / age +2.5/5.0
- Schools +2.3/10.0
- Appreciation +0.0/10.0
$299,900
🖨 Deal sheet 📄 Offer letter ✓ Due diligence
Listing remarks MLS
Time Limit Bid Property. REO/Bank Owned. Property sold As-Is w/ o repair, warranty or Seller Disclosure. The Listing Broker & Seller assume no responsibility & make no guarantees, warranties, or representations as to the availability or accuracy of info herein. Seller will accept cash or conventional offers only.
Key facts
- Built 1980
- Listed 2 days
Property features AI
Exterior
- Parking: Off-street parking
- Utilities: Public water; Public sewer; Cable TV available
- Home design: End of row townhouse; Three levels; Walkout-level basement; Not in a federal flood zone
- Construction: Composite roof; Concrete perimeter foundation; Double-pane windows with screens; Building not winterized
- Exterior features: Deck(s); Sidewalks; Rear fencing
Interior
- Kitchen: Dishwasher; Disposal; Electric oven/range; Exhaust fan
- Bedrooms: Three bedrooms on the upper level
- Flooring: Laminate plank flooring; Luxury vinyl plank flooring
- Bathrooms: Three full bathrooms; One half bathroom
- Heating & cooling: Heat pump(s); Central air conditioning; Electric heating and hot water
- Interior features: Stall shower and tub/shower combination; Breakfast area; Combination dining and living area; Walk-in closet(s); Window treatments
- Laundry & utility: Washer and dryer in unit (laundry in basement)
Neighborhood map
What this means for you Summary
Snapshot
- This is a 3-bed/1.5-bath townhouse listed at $300k.
Deal economics
- At list price, monthly cash flow is $-57 ($-683/yr) — negative.
- To cash-flow at today's rent, offer at most $290k (3.4% below list).
- To meet the 1% rule (rent ≥ 1% of price), the offer needs to be $244k (18.6% below list).
- Recommended offer: $244k (18.6% below list) — sets the bar for 1% rule.
- Cap rate 6.1% vs local median 3.6% in La Plata — top-decile yield for the area; either an underpriced asset or a hidden risk that comps aren't pricing in. Stress-test before assuming the spread holds.
Location & tenants
- Location reads 73/100 on livability (#132 in MD) — a middle-class / working-renter tenant base. Strengths: employment A+, housing A+, commute B; Watch: schools C-, health & safety C-, amenities F.
- Charles County Public Schools (suburban): math 13% / reading 29% proficiency, ranked #14 of 24 in MD (top 58%) — low school quality limits family demand, transient renter base, plan for 1-2y turnover.
- Market conditions: 213 active listings in the ZIP; 11 comparable units currently listed for rent nearby; rentals lingering (median 44d on market — plan ~5-8 weeks vacancy on turnover, expect pricing pressure); 64% of comp listings sitting > 30 days — soft ceiling on asking rent; 1,542 units permitted in Charles County in 2024 (516 in 5+ unit buildings).
Forward outlook
- Local home prices are declining (-3.0%/yr); year-one equity from $2k of loan paydown is wiped out by about $9k of value loss. Plan a longer hold.
- Charles County population projected at +27% by 2050 — long-run rental-demand tailwind backs the buy-and-hold thesis.
Negotiation context
- Only 2 days on market — expect competitive offers; lowballing is unlikely to land.
- 5 sale attempts since 24y ago with the ask held roughly flat each time — persistent listings suggest the price (not the market) is what's stuck; bring a comps-based counter.
- Current owner paid $72k; list at $300k implies a 314% gain — meaningful room to come down on a strong offer.
Risks & watch-outs
- Climate carrying-cost: moderate wind risk, 25% chance of damaging wind over 30y; extreme-heat days projected 7→16/yr by 2055 (HVAC capex compounding) — expect insurance premiums to compound above CPI over the hold.
Questions for the listing agent
- What do current leases actually rent for vs. the listed asking? Can we see a recent rent roll and the last 12 months of T-12 income?
- Is there a deadline driving the sale (1031 exchange, divorce, estate, relocation)? That informs how much negotiation room exists.
- The area grade is low — what's the realistic commute time and amenity access for the typical tenant pool here? Any planned neighborhood developments (good or bad) we should know about?
- What's the average days-on-market for RENTAL listings here right now (not sales)? A rising rental-DOM trend means longer vacancies and softer asking-rent achievability than the comps imply.
- What's the recent tenant-quality profile in this submarket — average credit score on applications, eviction rate, late-payment / NSF rate, and stable-employment percentage? A property-management company in the area should have these aggregated.
- How much new for-sale + rental construction is in the pipeline within 1–3 miles? Heavy new supply typically softens prices + rents 12–24 months out; constrained supply supports both.
Investment metrics
- 1% rule
- 0.81% ✗
- Cap rate
- 6.07%
- Cash-on-cash
- -0.81%
- DSCR
- 0.96
- GRM
- 10.2
CMA / ARV
- ARV (median comp)
- $338,853
- List price
- $299,900
- Delta
- -11.50%
- Verdict
- UNDERPRICED
- Comps
- 20 within 1.0 mi
Show comp detail 10 sales within ~0.75 mi
| Address | Dist | Beds/Ba | Sqft | Sold | Price | $/sf | Match |
|---|---|---|---|---|---|---|---|
| 815 Cedar Ct | 0.08mi | 3/2.0 | 1,482 (-3%) | 14mo | $330,000 | $223 | 78 |
| 235 Heather Ct | 0.52mi | 3/2.5 | 1,524 (-0%) | 10mo | $340,000 | $223 | 63 |
| 829 Laurel Ln | 0.06mi | 3/1.5 | 1,724 (+13%) | 22mo | $305,000 | $177 | 57 |
| 837 Laurel Ln | 0.06mi | 3/2.5 | 1,724 (+13%) | 18mo | $285,000 | $165 | 57 |
| 100 Edelen Station Pl #204 | 0.65mi | 2/2.0 (-1) | 1,515 (-1%) | 9mo | $345,000 | $228 | 54 |
| 221 Heather Ct | 0.52mi | 3/2.5 | 1,524 (-0%) | 23mo | $339,000 | $222 | 52 |
| 112 Huckleberry Dr | 0.56mi | 3/2.5 | 1,692 (+11%) | 2mo | $375,000 | $222 | 50 |
| 305 Centennial St Unit 207 E | 0.50mi | 2/2.5 (-1) | 1,466 (-4%) | 15mo | $295,000 | $201 | 49 |
| 200 Edelen Station Pl #205 | 0.63mi | 2/2.0 (-1) | 1,525 (-0%) | 21mo | $340,000 | $223 | 46 |
| 201 Heather Ct | 0.57mi | 2/1.5 (-1) | 1,360 (-11%) | 6mo | $353,000 | $260 | 45 |
Match score weights: distance 35% · size 25% · config 20% · recency 20%. Top-matched comps best support the ARV.
Projected returns pro-forma
-3.0% appreciation · 3.0% rent growth · sell at horizon
- IRR
- -17.6%
- Equity multiple
- 0.38×
- Total profit
- $-52,237
- Equity at exit
- $44,716
- IRR
- -9.8%
- Equity multiple
- 0.40×
- Total profit
- $-50,221
- Equity at exit
- $25,930
Cash invested: $83,972 (down + closing). Projections, not guarantees.
Landlord ↔ Tenant lean methodology
- Overall (STATE)
- 27 Tenant-Leaning
- State Maryland
- 27 Tenant-Leaning · D+14
- County
- — inherits STATE
- City
- — inherits STATE
ZIP-level market 20646
- Active inventory
- 213
- Price-to-rent
- 10.2×
Monthly cashflow live
- Estimated rent
- $2,441 high interval (Pro) →
- Mortgage (P&I)
- −$1,573
- Tax from tax record
- −$288 /mo · $3,456/yr
- Insurance
- −$125
- HOA
- −$0
- Vacancy / Maint / Mgmt
- −$513
- Net cashflow
- $-57
Break-even live
UW: 25.0% down · 7.5% · 30yr · 1.5% tax · 5.0% vac · 8.0% maint · 8.0% mgmt
Financing live
Cash to close
- Down payment
- $74,975
- Closing costs
- $8,997
- Reserves months
- —
- Total cash needed
- —
Loan-product check · same deal, 3 products live
Conventional
25% down · 7.5% · 30yr
- Down + closing
- —
- Monthly P&I
- —
- Monthly cashflow
- —
- DSCR
- —
- Eligible?
- —
Personal DTI + credit; lowest rate.
DSCR
20% down · 8.5% · 30yr
- Down + closing
- —
- Monthly P&I
- —
- Monthly cashflow
- —
- DSCR
- —
- Eligible?
- —
No personal income docs; deal must DSCR.
Hard money
10% down · 12.0% · 12mo
- Down + closing
- —
- Monthly P&I
- —
- Monthly cashflow
- —
- DSCR
- —
- Eligible?
- —
Short-term bridge; refi at stabilization.
Rent comps 11 comps
| Address | Beds | Baths | Sqft | Rent | $/sqft | DOM | Units | Dist |
|---|---|---|---|---|---|---|---|---|
| 219 Heather Ct La Plata, MD | 2.0 | 2.5 | 1650 | $2,400 | $1.45 | 43d | 1 | 0.54mi |
| 249 Heather Ct La Plata, MD | 2.0 | 2.5 | 1564 | $2,400 | $1.53 | 43d | 1 | 0.57mi |
| 303 Edelen Station Pl La Plata, MD | 4.0 | 3.5 | 2040 | $2,795 | $1.37 | 20d | 1 | 0.65mi |
| 201 Carol's Pl La Plata, MD | 2.0 | 2.0 | 1229 | $1,925 | $1.57 | 3d | 1 | 0.76mi |
| 327 Saint Marys Ave Unit 7K La Plata, MD | 2.0 | 2.0 | 1243 | $2,000 | $1.61 | 43d | 1 | 0.81mi |
| 103 Hibiscus Ct La Plata, MD | 2.0 | 2.5 | 1368 | $2,100 | $1.54 | 24d | 1 | 0.82mi |
| 9642 Charles St La Plata, MD | 3.0 | 1.0 | 1904 | $2,400 | $1.26 | 43d | 1 | 0.82mi |
| 14 Chesapeake St La Plata, MD | 3.0 | 2.5 | 1732 | $3,000 | $1.73 | 43d | 1 | 1.02mi |
| 128 Wood Duck Cir La Plata, MD | 3.0 | 2.5 | 1680 | $2,350 | $1.40 | 3d | 1 | 1.07mi |
| 1200 E Patuxent Dr La Plata, MD | 3.0 | 2.0 | 1962 | $3,500 | $1.78 | 43d | 1 | 1.17mi |
| 124 Madison St La Plata, MD | 2.0 | 2.0 | 1268 | $2,500 | $1.97 | 43d | 1 | 1.36mi |
Listing history 18 events
-
2026-05-15historical $299,900
-
2015-03-11historical 326-char remark
Show marketing remark (326 chars)
Time Limit Bid Property. REO/Bank Owned. Property sold As-Is w/ o repair, warranty or Seller Disclosure. The Listing Broker & Seller assume no responsibility & make no guarantees, warranties, or representations as to the availability or accuracy of info herein. Seller will accept cash or conventional offers only.
-
2015-03-09soldstatus $72,404 Sold 326-char remark
Show marketing remark (326 chars)
Time Limit Bid Property. REO/Bank Owned. Property sold As-Is w/ o repair, warranty or Seller Disclosure. The Listing Broker & Seller assume no responsibility & make no guarantees, warranties, or representations as to the availability or accuracy of info herein. Seller will accept cash or conventional offers only.
-
2015-03-09soldstatus $72,404
Show marketing remark (326 chars)
Time Limit Bid Property. REO/Bank Owned. Property sold As-Is w/ o repair, warranty or Seller Disclosure. The Listing Broker & Seller assume no responsibility & make no guarantees, warranties, or representations as to the availability or accuracy of info herein. Seller will accept cash or conventional offers only.
-
2014-11-16historical
Show marketing remark (326 chars)
Time Limit Bid Property. REO/Bank Owned. Property sold As-Is w/ o repair, warranty or Seller Disclosure. The Listing Broker & Seller assume no responsibility & make no guarantees, warranties, or representations as to the availability or accuracy of info herein. Seller will accept cash or conventional offers only.
-
2014-09-17status Contract 326-char remark
Show marketing remark (326 chars)
Time Limit Bid Property. REO/Bank Owned. Property sold As-Is w/ o repair, warranty or Seller Disclosure. The Listing Broker & Seller assume no responsibility & make no guarantees, warranties, or representations as to the availability or accuracy of info herein. Seller will accept cash or conventional offers only.
-
2014-07-28$77,000 Active 326-char remark
Show marketing remark (326 chars)
Time Limit Bid Property. REO/Bank Owned. Property sold As-Is w/ o repair, warranty or Seller Disclosure. The Listing Broker & Seller assume no responsibility & make no guarantees, warranties, or representations as to the availability or accuracy of info herein. Seller will accept cash or conventional offers only.
-
2014-07-28$77,000
Show marketing remark (326 chars)
Time Limit Bid Property. REO/Bank Owned. Property sold As-Is w/ o repair, warranty or Seller Disclosure. The Listing Broker & Seller assume no responsibility & make no guarantees, warranties, or representations as to the availability or accuracy of info herein. Seller will accept cash or conventional offers only.
-
2004-12-29soldstatus $179,000
-
2004-12-17soldstatus $179,000
-
2004-11-23historical
-
2004-11-05$179,000
-
2002-03-05soldstatus $94,000
-
2002-02-28soldstatus $93,900
-
2002-01-27historical
-
2002-01-07$93,900
-
1986-11-12soldstatus $61,500
-
1986-02-26soldstatus $62,750
ⓘ Source: listings_history table (triggers on properties + properties_extension) + one-shot
backfill from property_details.listing_events for pre-trigger history.
Tax reassessment forecast MD · Partial reset (capped growth)
- Current annual tax
- $3,456 · $288/mo
- Projected year-2 tax
- $3,456 · $288/mo
- Expected delta
- $0/yr ($0/mo · 0.0%)
ⓘ Screening estimate from a state-policy table — verify with the county assessor before closing.
Climate risk First Street
- Flood 1/10 Low FEMA zone X (unshaded) · 0% chance over 30 yrs
- Wildfire 4/10 Moderate
- Heat 8/10 Severe 7 d/yr ≥102°F today · 16 d/yr by 30 yrs out
- Wind 5/10 Major 25% chance of damaging wind over 30 yrs
- Air quality 2/10 Low 1 unhealthy d/yr today · 1 by 30 yrs out
Nearby sold comps map
Loading sold comps map…
Walkable amenities ~0.75 mi
Loading nearby amenities…
Taxation est. · year 1
- Rental income
- $29,297
- − Mortgage interest
- −$16,799
- − Property taxes
- −$3,456
- − Insurance
- −$1,500
- − Repairs & maintenance
- −$2,344
- − Management
- −$2,344
- − Depreciation
- −$8,724
- Taxable loss
- −$5,869
- Est. tax savings @ 24.0%
- +$1,409
- After-tax cash flow
- $726/yr
For passive investors: Depreciation is non-cash, so a rental often shows a tax loss while cash-flowing — sheltering income. Rental losses are passive: they offset passive income freely, and up to $25,000/yr can offset ordinary (W-2) income if you actively participate and your MAGI is under $100k (phasing out to $0 by $150k); unused losses carry forward. On sale, claimed depreciation is recaptured at up to 25%, and gains may owe capital-gains tax (a 1031 exchange can defer both). Figures are a year-1 estimate at your 24.0% rate — not tax advice; consult a CPA.
Schools (NCES district)
- District
- Charles County Public Schools
- NCES district ID
- 2400270
- Math proficiency
- 13% ▼ -19.00%
- Reading proficiency
- 29% ▼ -13.00%
- Median HH income
- $90,389
- Composite
- 22.54/100
- National rank
- #8087
- State rank
- #14 of 24 in MD
Livability — La Plata
- Score
- 73/100
- State rank
- #132
- US rank
- #5547
Category grades
Schools grade is shown separately in the Schools card above.
Census & demographics
- Census place
- La Plata, MD
- Population (ZIP)
- 21,601
Population outlook (Charles County) Hauer SSP2
- Today (2025)
- 176,616 people
- By 2030
- 186,471 · +5.6%
- By 2040
- 206,472 · +16.9%
- By 2050
- 224,883 · +27.3%
- By 2075
- 272,101 · +54.1%
- By 2100
- 303,564 · +71.9%
Race, ethnicity, and origin ACS 2023
- Neighborhood character
- Diverse neighborhood (Simpson 0.56)
- Race & ethnicity
- White 62% Black 24% Two or more races 8% Hispanic / Latino 4% Asian 3%
- Common ancestry
- Italian 3% Romanian 2% Iranian 2%
- Foreign-born
- 7% · Canada, China
- Languages at home
- 93% English-only · Spanish 2% Other Indo-European 2% Tagalog/Filipino 1%
Political lean MEDSL · Charles
- 2024 margin
- Solid D (+40.7) · D 69.2% · R 28.5% · Other 2.2%
- 2008→2024 swing
- +15.2pp toward D · 2008: 25.5pp · 2024: 40.7pp
- All cycles
- 2024: D+40.7 2020: D+40.9 2016: D+30.2 2012: D+31.3 2008: D+25.5
Not yet ingested
- Civics
- —
Market trends
- HPI YoY
- ▼ -150.48%
- Current HPI
- 238.0634
- Rent YoY
- —
- Metro
- —
- State GDP YoY
- ▲ 2.97%
- F500 in state
- 12
Industry mix (Fortune 500 HQ in MD)
| Industry | F500 HQs | Revenue |
|---|---|---|
| Aerospace / Defense | 1 | $71B |
|
||
| Utilities | 1 | $25B |
|
||
| Hotels | 1 | $24B |
|
||
| Consumer Goods | 1 | $7B |
|
||
| Real Estate | 1 | $6B |
|
||
| Chemicals | 1 | $2B |
|
||
Price history
+377.9% since first listed20 events — show timeline
- 2026-05-23 Pending — BRIGHT MLS
- 2026-05-21 Listed $299,900 BRIGHT MLS
- 2026-05-15 Coming Soon $299,900 BRIGHT MLS
- 2015-03-11 Delisted — MRIS
- 2015-03-09 Sold (MLS) $72,404 BRIGHT MLS
- 2015-03-09 Sold (MLS) $72,404 MRIS
- 2014-11-16 Listing Removed — BRIGHT MLS
- 2014-09-17 Pending — MRIS
- 2014-07-28 Listed $77,000 MRIS
- 2014-07-28 Listed $77,000 BRIGHT MLS
- 2004-12-29 Sold (Public Records) $179,000 Public Records
- 2004-12-17 Sold (MLS) $179,000 MRIS
- 2004-11-23 Delisted — MRIS
- 2004-11-05 Listed $179,000 MRIS
- 2002-03-05 Sold (Public Records) $94,000 Public Records
- 2002-02-28 Sold (MLS) $93,900 MRIS
- 2002-01-27 Delisted — MRIS
- 2002-01-07 Listed $93,900 MRIS
- 1986-11-12 Sold (Public Records) $61,500 Public Records
- 1986-02-26 Sold (Public Records) $62,750 Public Records
Property tax history
+4.1%/yrLatest (2025): $3,456 · +13.7% YoY. Source: county tax records.
Cash-flow waterfall
monthlySold comps — $/sqft
last 12 mo · ≤1 miLoading sold comps…