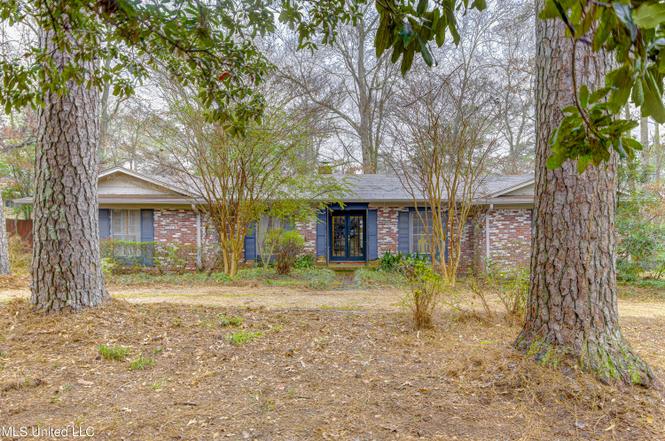
1735 Hillview Dr · Jackson, MS
Flood risk 1/10 · Minimal
- FEMA flood zone
- X (unshaded)
- Chance of flooding over 30 yrs
- 0.0%
- Est. flood insurance / yr
- $507 – $1,088
Fire risk 1/10 · Minimal
- Est. fire insurance / yr
- $1,241 – $2,305
Heat risk 7/10 · Major
- Hot days now (above 108°F)
- 7 days/yr
- Hot days in 30 yrs
- 19 days/yr
Wind risk 8/10 · Major
- Chance of severe wind over 30 yrs
- 80.0%
Air-quality risk 2/10 · Minimal
- Unhealthy air days now
- 0 days/yr
- Unhealthy air days in 30 yrs
- 1 days/yr
Risk factors via First Street. Map © Google.
Why this score? — see what drove the B grade
The composite is a weighted blend of 9 inputs, each scored 0–100. Each bar is that input's sub-score; the figure is the points it added to the 100-point composite (weight × sub-score).
- Cash flow +29.3/30.0
- ARV discount +15.0/15.0
- DSCR +10.0/10.0
- 1% rule +7.3/10.0
- Rent growth +4.5/5.0
- Livability +3.4/5.0
- Condition / age +2.5/5.0
- Schools +1.1/10.0
- Appreciation +0.0/10.0
$195,000
🖨 Deal sheet 📄 Offer letter ✓ Due diligence
Listing remarks MLS
REDUCED!!!! Great 3 bedroom 3 full bath home in Northeast Jackson. Huge Living areas including formal living and dining rooms, large den, huge kitchen and tons of closets. Over 2700 square feet. Located on a huge corner lot in a quiet family oriented area. Priced well below market value! Owner has already bought another home and is anxious to sell! Call your agent today!
Key facts
- Front porch
- Entry foyer
- Large sun room
Tags
Neighborhood map
What this means for you Summary
Snapshot
- This is a 3-bed/3.0-bath single-family listed at $195k.
Deal economics
- At list price, monthly cash flow is $683 ($8k/yr) — positive.
- The deal already cash-flows at list — no discount required.
- Meets the 1% rule at list price ($2k rent vs $195k).
- Recommended offer: $189k (3.0% below list) — sets the bar for market timing.
Location & tenants
- Location reads 68/100 on livability (#66 in MS) — a middle-class / working-renter tenant base. Strengths: commute A+, cost of living A+, housing A+; Watch: amenities F, employment F, health & safety F.
- Jackson Public School District (urban): math 9% / reading 18% proficiency, ranked #112 of 130 in MS (top 86%) — low school quality limits family demand, transient renter base, plan for 1-2y turnover; 88% free/reduced lunch — lower-income household profile, screen leases tightly.
- Zoned schools: Spann Elementary School (math 7% / reading 21%, grade F, #289 of 375 statewide, top 78%, 395 students, 100% FRL); Murrah High School (math 12% / reading 27%, grade F, #130 of 197 statewide, top 68%, 1,326 students, 100% FRL).
- Market conditions: Rents rising fast (+7.9%/yr); 221 active listings in the ZIP; 4 comparable units currently listed for rent nearby; rentals at typical pace (median 23d on market — plan ~3-4 weeks tenant-placement turnaround); 167 units permitted in Hinds County in 2024 (0 in 5+ unit buildings).
- This rent runs 41% of the median local income ($69k/yr) — at the standard rent-burdened threshold; future hikes will face affordability resistance.
Forward outlook
- Local home prices are declining (-3.0%/yr); year-one equity from $1k of loan paydown is wiped out by about $6k of value loss. Plan a longer hold.
- Hinds County population projected to shrink 6% by 2050 — rents likely to lag national; underwrite the cash flow, not the appreciation.
- At projected returns (-3.0% appreciation + 7.9% rent growth), your $55k cash investment doubles in ~6 years — after that, you're playing with house money.
Negotiation context
- It's been on market 34 days — a 3% lower offer ($189k) is reasonable based on typical stale-listing flexibility.
- 3 sale attempts since 27y ago with the ask held roughly flat each time — persistent listings suggest the price (not the market) is what's stuck; bring a comps-based counter.
Risks & watch-outs
- Watch-outs: built in 1959 — expect roof / HVAC / electrical / plumbing capex.
- Climate carrying-cost: severe wind risk, 80% chance of damaging wind over 30y; extreme-heat days projected 7→19/yr by 2055 (HVAC capex compounding) — expect insurance premiums to compound above CPI over the hold.
Questions for the listing agent
- It's been on market 34 days. Have you received any prior offers? Is the seller open to a 3% concession, seller financing, or rate buy-down credit?
- Built in 1959 — when were the roof, HVAC, electrical panel, plumbing, and water heater last replaced?
- Is there a deadline driving the sale (1031 exchange, divorce, estate, relocation)? That informs how much negotiation room exists.
- Schools are F-rated, which usually means shorter tenancies and higher turnover. Who's the typical renter profile here, and what's been the actual vacancy rate?
- What's the average days-on-market for RENTAL listings here right now (not sales)? A rising rental-DOM trend means longer vacancies and softer asking-rent achievability than the comps imply.
- What's the recent tenant-quality profile in this submarket — average credit score on applications, eviction rate, late-payment / NSF rate, and stable-employment percentage? A property-management company in the area should have these aggregated.
- How much new for-sale + rental construction is in the pipeline within 1–3 miles? Heavy new supply typically softens prices + rents 12–24 months out; constrained supply supports both.
Investment metrics
- 1% rule
- 1.23% ✓
- Cap rate
- 10.50%
- Cash-on-cash
- 15.01%
- DSCR
- 1.67
- GRM
- 6.8
CMA / ARV
- ARV (on-the-fly)
- $304,416
- Comps found
- 12
Show comp detail 12 sales within ~0.75 mi
| Address | Dist | Beds/Ba | Sqft | Sold | Price | $/sf | Match |
|---|---|---|---|---|---|---|---|
| 1903 Bellewood Rd | 0.16mi | 4/3.5 (+1) | 2,597 (-4%) | 4mo | $292,000 | $112 | 75 |
| 1641 Sheffield Dr | 0.27mi | 3/2.5 | 2,639 (-3%) | 9mo | $399,900 | $152 | 73 |
| 1508 Kimwood Cir | 0.39mi | 4/3.0 (+1) | 2,662 (-2%) | 1mo | $285,000 | $107 | 72 |
| 2017 Southwood Rd | 0.33mi | 4/3.0 (+1) | 2,599 (-4%) | 2mo | $325,000 | $125 | 71 |
| 1415 Winchester St | 0.46mi | 4/3.0 (+1) | 2,643 (-3%) | 3mo | $169,900 | $64 | 66 |
| 1534 Brecon Dr | 0.30mi | 4/2.0 (+1) | 2,512 (-8%) | 5mo | $275,000 | $109 | 60 |
| 2009 Southwood Rd | 0.33mi | 4/3.0 (+1) | 2,410 (-11%) | 3mo | $259,500 | $108 | 59 |
| 4550 Ridgewood Rd | 0.25mi | 3/2.5 | 2,315 (-15%) | 4mo | $190,350 | $82 | 58 |
| 1609 Sheffield Dr | 0.33mi | 3/2.0 | 2,320 (-15%) | 1mo | $375,000 | $162 | 55 |
| 1436 Kimwood Dr | 0.42mi | 3/2.0 | 2,450 (-10%) | 10mo | $240,000 | $98 | 52 |
| 2245 N Cheryl Dr | 0.71mi | 4/3.0 (+1) | 2,526 (-7%) | 2mo | $369,900 | $146 | 48 |
| 2256 N Cheryl Dr | 0.73mi | 4/2.5 (+1) | 2,860 (+5%) | 6mo | $339,000 | $119 | 46 |
Match score weights: distance 35% · size 25% · config 20% · recency 20%. Top-matched comps best support the ARV.
Projected returns pro-forma
-3.0% appreciation · 7.9% rent growth · sell at horizon
- IRR
- 10.6%
- Equity multiple
- 1.44×
- Total profit
- $24,220
- Equity at exit
- $29,075
- IRR
- 23.2%
- Equity multiple
- 3.44×
- Total profit
- $133,082
- Equity at exit
- $16,860
Cash invested: $54,600 (down + closing). Projections, not guarantees.
Landlord ↔ Tenant lean methodology
- Overall (STATE)
- 90 Strongly Landlord-Friendly
- State Mississippi
- 90 Strongly Landlord-Friendly · R+11
- County
- — inherits STATE
- City
- — inherits STATE
ZIP-level market 39211
- Rents YoY
- 7.9%
- Active inventory
- 221
- Price-to-rent
- 6.8×
Monthly cashflow live
- Estimated rent
- $2,391 medium interval (Pro) →
- Mortgage (P&I)
- −$1,023
- Tax from tax record
- −$102 /mo · $1,225/yr
- Insurance
- −$81
- HOA
- −$0
- Vacancy / Maint / Mgmt
- −$502
- Net cashflow
- $683
Break-even live
UW: 25.0% down · 7.5% · 30yr · 1.5% tax · 5.0% vac · 8.0% maint · 8.0% mgmt
Financing live
Cash to close
- Down payment
- $48,750
- Closing costs
- $5,850
- Reserves months
- —
- Total cash needed
- —
Loan-product check · same deal, 3 products live
Conventional
25% down · 7.5% · 30yr
- Down + closing
- —
- Monthly P&I
- —
- Monthly cashflow
- —
- DSCR
- —
- Eligible?
- —
Personal DTI + credit; lowest rate.
DSCR
20% down · 8.5% · 30yr
- Down + closing
- —
- Monthly P&I
- —
- Monthly cashflow
- —
- DSCR
- —
- Eligible?
- —
No personal income docs; deal must DSCR.
Hard money
10% down · 12.0% · 12mo
- Down + closing
- —
- Monthly P&I
- —
- Monthly cashflow
- —
- DSCR
- —
- Eligible?
- —
Short-term bridge; refi at stabilization.
Rent comps 4 comps
| Address | Beds | Baths | Sqft | Rent | $/sqft | DOM | Units | Dist |
|---|---|---|---|---|---|---|---|---|
| 4750 Old Canton Rd Jackson, MS | 4.0 | 3.0 | 2085 | $2,200 | $1.06 | 23d | 1 | 0.50mi |
| 5125 Old Canton Rd Jackson, MS | 3.0 | 3.0 | 2025 | $2,100 | $1.04 | 23d | 1 | 0.65mi |
| 1046 Newland St Jackson, MS | 4.0 | 2.5 | 2700 | $3,200 | $1.19 | 23d | 1 | 0.80mi |
| 246 Eastbrooke St Jackson, MS | 2.0 | 2.0 | 1777 | $2,750 | $1.55 | 43d | 1 | 1.48mi |
Listing history 11 events
-
2026-03-01status Pending
-
2026-01-26$195,000 Active
-
2021-10-08historical
-
2006-11-29soldstatus 373-char remark
Show marketing remark (373 chars)
REDUCED!!!! Great 3 bedroom 3 full bath home in Northeast Jackson. Huge Living areas including formal living and dining rooms, large den, huge kitchen and tons of closets. Over 2700 square feet. Located on a huge corner lot in a quiet family oriented area. Priced well below market value! Owner has already bought another home and is anxious to sell! Call your agent today!
-
2006-11-29soldstatus
Show marketing remark (373 chars)
REDUCED!!!! Great 3 bedroom 3 full bath home in Northeast Jackson. Huge Living areas including formal living and dining rooms, large den, huge kitchen and tons of closets. Over 2700 square feet. Located on a huge corner lot in a quiet family oriented area. Priced well below market value! Owner has already bought another home and is anxious to sell! Call your agent today!
-
2006-09-25$157,000 373-char remark
Show marketing remark (373 chars)
REDUCED!!!! Great 3 bedroom 3 full bath home in Northeast Jackson. Huge Living areas including formal living and dining rooms, large den, huge kitchen and tons of closets. Over 2700 square feet. Located on a huge corner lot in a quiet family oriented area. Priced well below market value! Owner has already bought another home and is anxious to sell! Call your agent today!
-
1999-10-28$162,500
-
1999-08-11soldstatus
-
1999-06-24soldstatus
-
1998-02-25soldstatus
-
1959-02-09soldstatus
ⓘ Source: listings_history table (triggers on properties + properties_extension) + one-shot
backfill from property_details.listing_events for pre-trigger history.
Tax reassessment forecast MS · Resets to sale price
- Current annual tax
- $1,225 · $102/mo
- Projected year-2 tax
- $1,541 · $128/mo
- Expected delta
- +$315/yr (+$26/mo · 25.7%)
ⓘ Screening estimate from a state-policy table — verify with the county assessor before closing.
Climate risk First Street
- Flood 1/10 Low FEMA zone X (unshaded) · 0% chance over 30 yrs
- Wildfire 1/10 Low
- Heat 7/10 Severe 7 d/yr ≥108°F today · 19 d/yr by 30 yrs out
- Wind 8/10 Severe 80% chance of damaging wind over 30 yrs
- Air quality 2/10 Low 0 unhealthy d/yr today · 1 by 30 yrs out
Nearby sold comps map
Loading sold comps map…
Walkable amenities ~0.75 mi
Loading nearby amenities…
Taxation est. · year 1
- Rental income
- $28,692
- − Mortgage interest
- −$10,923
- − Property taxes
- −$1,225
- − Insurance
- −$975
- − Repairs & maintenance
- −$2,295
- − Management
- −$2,295
- − Depreciation
- −$5,673
- Taxable income
- $5,306
- Est. tax owed @ 24.0%
- −$1,273
- After-tax cash flow
- $6,922/yr
For passive investors: Depreciation is non-cash, so a rental often shows a tax loss while cash-flowing — sheltering income. Rental losses are passive: they offset passive income freely, and up to $25,000/yr can offset ordinary (W-2) income if you actively participate and your MAGI is under $100k (phasing out to $0 by $150k); unused losses carry forward. On sale, claimed depreciation is recaptured at up to 25%, and gains may owe capital-gains tax (a 1031 exchange can defer both). Figures are a year-1 estimate at your 24.0% rate — not tax advice; consult a CPA.
Schools (NCES district)
- District
- Jackson Public School District
- NCES district ID
- 2802190
- Math proficiency
- 9% ▼ -14.00%
- Reading proficiency
- 18% ▼ -7.00%
- Median HH income
- $33,234
- Composite
- 10.89/100
- National rank
- #9755
- State rank
- #112 of 130 in MS
Livability — Jackson
- Score
- 68/100
- State rank
- #66
- US rank
- #9695
Category grades
Schools grade is shown separately in the Schools card above.
Census & demographics
- Census place
- Jackson, MS
- County
- Hinds County · 167,040 people
- City population
- 140,204
- Metro
- Jackson, MS
- Population (ZIP)
- 23,838
- Household income
- $69,426
- Rent vs Own
- Severe rent burden
- 736.0
Population outlook (Hinds County) Hauer SSP2
- Today (2025)
- 242,528 people
- By 2030
- 241,113 · -0.6%
- By 2040
- 235,557 · -2.9%
- By 2050
- 226,946 · -6.4%
- By 2075
- 199,995 · -17.5%
- By 2100
- 164,165 · -32.3%
Race, ethnicity, and origin ACS 2023
- Neighborhood character
- Majority Black (59%)
- Race & ethnicity
- Black 59% White 36% Hispanic / Latino 3% Two or more races 2%
- Common ancestry
- Serbian 2% Italian 2% Slovak 1%
- Foreign-born
- 2% · Canada, China
- Languages at home
- 96% English-only · Spanish 3% Chinese 1%
Political lean MEDSL · Hinds
- 2024 margin
- Solid D (+46.1) · D 72.4% · R 26.3% · Other 1.4%
- 2008→2024 swing
- +7.1pp toward D · 2008: 39.0pp · 2024: 46.1pp
- All cycles
- 2024: D+46.1 2020: D+48.3 2016: D+43.7 2012: D+45.1 2008: D+39.0
Not yet ingested
- Civics
- —
Market trends
- HPI YoY
- ▼ -135.99%
- Current HPI
- 145.5192
- Rent YoY
- ▲ 7.90%
- Metro
- Jackson, MS
- State GDP YoY
- —
- F500 in state
- 0
Price history
+20.0% since first listed11 events — show timeline
- 2026-03-01 Pending — MLSU
- 2026-01-26 Listed $195,000 MLSU
- 2021-10-08 Listing Removed — MLSU
- 2006-11-29 Sold (Public Records) — Public Records
- 2006-11-29 Sold (MLS) — MLSU
- 2006-09-25 Listed $157,000 MLSU
- 1999-10-28 Listed $162,500 MLSU
- 1999-08-11 Sold (Public Records) — Public Records
- 1999-06-24 Sold (Public Records) — Public Records
- 1998-02-25 Sold (Public Records) — Public Records
- 1959-02-09 Sold (Public Records) — Public Records
Property tax history
+1.3%/yrLatest (2025): $1,225 · +3.6% YoY. Source: county tax records.
Cash-flow waterfall
monthlySold comps — $/sqft
last 12 mo · ≤1 miLoading sold comps…