 Duplex
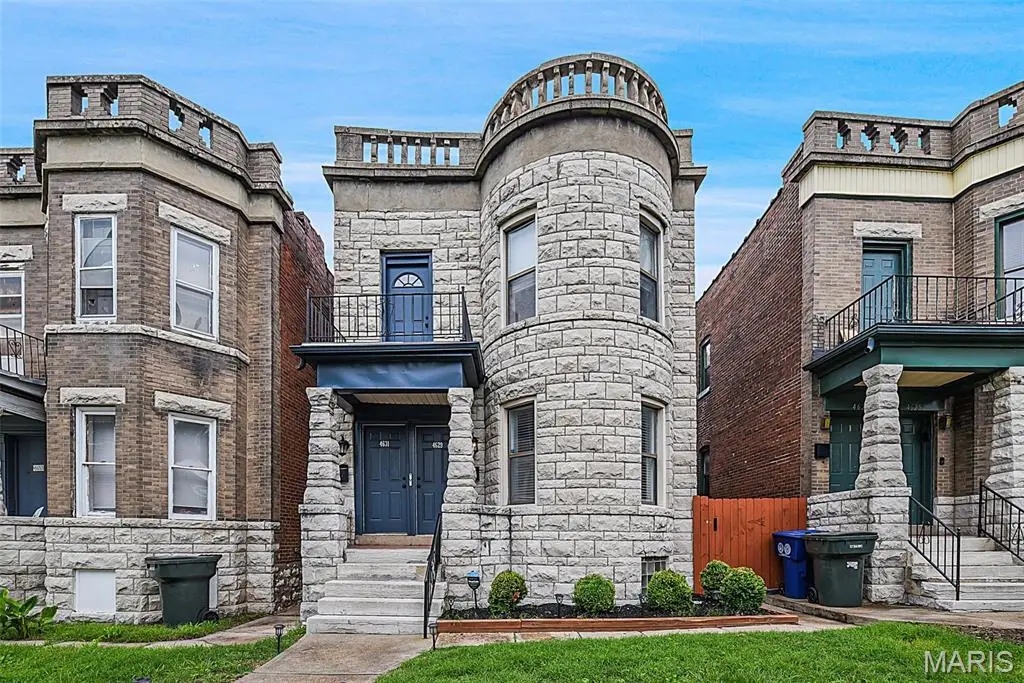
4629 Washington Blvd · St. Louis, MO
Flood risk 5/10 · Moderate
- FEMA flood zone
- X (unshaded)
- Chance of flooding over 30 yrs
- 0.24%
- Est. flood insurance / yr
- $507 – $1,088
Fire risk 1/10 · Minimal
- Est. fire insurance / yr
- $1,054 – $1,958
Heat risk 5/10 · Moderate
- Hot days now (above 107°F)
- 7 days/yr
- Hot days in 30 yrs
- 21 days/yr
Wind risk 2/10 · Minimal
- Chance of severe wind over 30 yrs
- 1.0%
Air-quality risk 4/10 · Minor
- Unhealthy air days now
- 4 days/yr
- Unhealthy air days in 30 yrs
- 5 days/yr
Risk factors via First Street. Map © Google.
Why this score? — see what drove the D+ grade
The composite is a weighted blend of 9 inputs, each scored 0–100. Each bar is that input's sub-score; the figure is the points it added to the 100-point composite (weight × sub-score).
- Cash flow +18.9/30.0
- ARV discount +7.5/15.0
- DSCR +6.0/10.0
- 1% rule +3.9/10.0
- Rent growth +3.3/5.0
- Livability +2.5/5.0
- Condition / age +2.5/5.0
- Schools +1.2/10.0
- Appreciation +0.0/10.0
$429,900
🖨 Deal sheet (PDF) 📄 Offer letter ✓ Due diligence
Multi-family units
County records classify this as Multi-Family (2-4 Unit). Listing-text estimate: 2 units. confirmed
Listing remarks MLS
Are you looking for an ALL BRICK HOME OR INVESTMENT PROPERTY IN THE CENTRAL WEST END? THEN LOOK NO FURTHER!! This stone building has endured its test in time and she is still standing strong. Some of her updates include, thermal windows, newer kitchen and baths, updated hot water heater and furnaces. This building is perfect if you want to live rent free by occupying one and renting out the other unit. Located near everything, shopping, grocery stores, eateries, highways and more. Each unit has 3 bedrms with a possible 4th. You have a full basement that's clean as a whistle and has an extra room for storage or completing your favorite DIY projects. HURRY!!!
Key facts
- 2,874 sq ft lot
- Built 1901
- Listed 16 days
Property features AI
Exterior
- Parking: No driveway; on-street parking
- Utilities: Public water
- Home design: Duplex (residential income, 2-4 units); Updated/remodeled condition; Flat roof
- Construction: Brick and stone construction; Stone foundation
- Exterior features: Fenced lot
Interior
- Bedrooms: One 2-bedroom unit; One 3-bedroom unit
- Flooring: Wood flooring
- Bathrooms: Each unit has 1 bathroom
- Heating & cooling: Forced air heating (natural gas); Central air conditioning; Electric cooling; Ceiling fan(s)
- Interior features: Gas water heater; Wood flooring; Full unfinished basement with interior entry, walk-up and walk-out access, and storage space
- Laundry & utility: In-unit laundry
Neighborhood map
What this means for you Summary
Snapshot
- This is a 1×2bd/1.0ba + 1×3bd/1.0ba units multifamily listed at $430k.
Deal economics
- At list price, monthly cash flow is $441 ($5k/yr) — positive. Per door: $221/mo.
- The deal already cash-flows at list — no discount required.
- To meet the 1% rule (rent ≥ 1% of price), the offer needs to be $382k (11.2% below list).
- Recommended offer: $382k (11.2% below list) — sets the bar for 1% rule.
- Cap rate 7.5% vs local median 5.0% in St. Louis — top-decile yield for the area; either an underpriced asset or a hidden risk that comps aren't pricing in. Stress-test before assuming the spread holds.
Location & tenants
- Location reads: area grade D — affects rentability + tenant quality, not the cash-flow math above.
- St. Louis City (urban): math 10% / reading 18% proficiency, ranked #312 of 324 in MO (top 96%) — low school quality limits family demand, transient renter base, plan for 1-2y turnover; 80% free/reduced lunch — lower-income household profile, screen leases tightly.
- Zoned schools: Hickey Elem. (math 2% / reading 8%, grade F, #1,072 of 1,115 statewide, top 98%, 273 students, 99% FRL); Gateway Middle (math 0% / reading 8%, grade F, #389 of 391 statewide, top 100%, 506 students, 99% FRL); Sumner High (math 2% / reading 2%, grade F, #520 of 521 statewide, top 100%, 264 students, 99% FRL) — zoned schools average 99% FRL vs 80% district-wide (19 pts higher); higher-poverty schools than district average — tighter screening recommended.
- Market conditions: Rents rising (+3.1%/yr); 153 active listings in the ZIP; 5 comparable units currently listed for rent nearby; rentals at typical pace (median 18d on market — plan ~3-4 weeks tenant-placement turnaround); 40% of comp listings sitting > 30 days — soft ceiling on asking rent; 294 units permitted in St. Louis city in 2024 (227 in 5+ unit buildings).
- At $3,816/mo this rent would consume 83% of the median local household income ($55k/yr) (locally 2180% of renters already pay >50% of income on rent) — very limited rent-growth headroom before tenants either downsize or default.
Forward outlook
- Local home prices are declining (-3.0%/yr); year-one equity from $3k of loan paydown is wiped out by about $13k of value loss. Plan a longer hold.
- St. Louis County population projected to shrink 6% by 2050 — rents likely to lag national; underwrite the cash flow, not the appreciation.
Negotiation context
- It's been on market 17 days — a 2% lower offer ($423k) is reasonable based on typical stale-listing flexibility.
- 3 sale attempts since 15y ago; this cycle's ask is 187% above the opening price — seller raised mid-cycle; expect resistance to lowballs.
- Current owner paid $140k; list at $430k implies a 207% gain — meaningful room to come down on a strong offer.
Risks & watch-outs
- Watch-outs: built in 1901 — expect roof / HVAC / electrical / plumbing capex.
- Climate carrying-cost: moderate flood risk; extreme-heat days projected 7→21/yr by 2055 (HVAC capex compounding) — expect insurance premiums to compound above CPI over the hold.
Questions for the listing agent
- Can we see the unit-by-unit rent roll, current vacancy, and any below-market leases? What's the average tenancy length?
- What capital expenditures (roof, boiler, parking lot, exteriors) have been made in the last 5 years, and what's planned in the next 2?
- Built in 1901 — when were the roof, HVAC, electrical panel, plumbing, and water heater last replaced?
- Is there a deadline driving the sale (1031 exchange, divorce, estate, relocation)? That informs how much negotiation room exists.
- The area grade is low — what's the realistic commute time and amenity access for the typical tenant pool here? Any planned neighborhood developments (good or bad) we should know about?
- What's the average days-on-market for RENTAL listings here right now (not sales)? A rising rental-DOM trend means longer vacancies and softer asking-rent achievability than the comps imply.
- What's the recent tenant-quality profile in this submarket — average credit score on applications, eviction rate, late-payment / NSF rate, and stable-employment percentage? A property-management company in the area should have these aggregated.
- How much new apartment / multifamily construction is in the pipeline within 1–3 miles? Heavy new supply (>2% of stock underway) typically softens rents 12–24 months out; light construction supports rent growth.
Investment metrics
- 1% rule
- 0.89% ✗
- Cap rate
- 7.53%
- Cash-on-cash
- 4.40%
- DSCR
- 1.20
- GRM
- 9.4
CMA / ARV
No comps found within radius.
Projected returns pro-forma
-3.0% appreciation · 3.1% rent growth · sell at horizon
- IRR
- -9.4%
- Equity multiple
- 0.66×
- Total profit
- $-41,352
- Equity at exit
- $64,099
- IRR
- 0.1%
- Equity multiple
- 1.01×
- Total profit
- $1,012
- Equity at exit
- $37,170
Cash invested: $120,372 (down + closing). Projections, not guarantees.
Landlord ↔ Tenant lean methodology
- Overall (STATE)
- 81 Strongly Landlord-Friendly
- State Missouri
- 81 Strongly Landlord-Friendly · R+10
- County
- — inherits STATE
- City
- — inherits STATE
ZIP-level market 63108
- Home prices YoY
- -33.1%
- Rents YoY
- 3.1%
- Active inventory
- 153
- Price-to-rent
- 20.1×
Monthly cashflow live
- Estimated rent
- $3,816 high interval (Pro) →
- Mortgage (P&I)
- −$2,254
- Tax from tax record
- −$140 /mo · $1,676/yr
- Insurance
- −$179
- HOA
- −$0
- Vacancy / Maint / Mgmt
- −$801
- Net cashflow
- $441
Break-even live
Sensitivity live
| Price | -10% $685 | -5% $563 | +0% $441 | +5% $320 | +10% $198 |
|---|---|---|---|---|---|
| Rent | -10% $140 | -5% $291 | +0% $441 | +5% $592 | +10% $743 |
| Rate | -1.0pp $658 | -0.5pp $551 | base $441 | +0.5pp $330 | +1.0pp $217 |
2-unit breakdown (identical units grouped — click to expand)
| Units | Beds | Baths | Est. rent |
|---|---|---|---|
| 1× unit | 2 | 1 | $1,784 |
| 1× unit | 3 | 1 | $2,032 |
| Total (2 units) | $3,816 | ||
UW: 25.0% down · 7.5% · 30yr · 1.5% tax · 5.0% vac · 8.0% maint · 8.0% mgmt
Financing live
Cash to close
- Down payment
- $107,475
- Closing costs
- $12,897
- Reserves months
- —
- Total cash needed
- —
Loan-product check · same deal, 3 products live
Conventional
25% down · 7.5% · 30yr
- Down + closing
- —
- Monthly P&I
- —
- Monthly cashflow
- —
- DSCR
- —
- Eligible?
- —
Personal DTI + credit; lowest rate.
DSCR
20% down · 8.5% · 30yr
- Down + closing
- —
- Monthly P&I
- —
- Monthly cashflow
- —
- DSCR
- —
- Eligible?
- —
No personal income docs; deal must DSCR.
Hard money
10% down · 12.0% · 12mo
- Down + closing
- —
- Monthly P&I
- —
- Monthly cashflow
- —
- DSCR
- —
- Eligible?
- —
Short-term bridge; refi at stabilization.
Rent comps 5 comps
| Address | Beds | Baths | Sqft | Rent | $/sqft | DOM | Units | Dist |
|---|---|---|---|---|---|---|---|---|
| 275 Union Blvd St. Louis, MO | 3.0 | 1.0–3.0 | 1317 | $4,686 | $3.56 | 0d | 63 | 0.97mi |
| 4133 Laclede Ave Unit 1 St. Louis, MO | 3.0 | 1.5 | 2775 | $1,999 | $0.72 | 45d | 1 | 0.98mi |
| 5345 Wells Ave Saint Louis, MO | 3.0 | 1.0 | 2254 | $1,295 | $0.57 | 45d | 1 | 1.29mi |
| 3717-3721 Westminster Pl St. Louis, MO | 3.0 | 1.0–3.0 | 1343 | $2,735 | $2.04 | 18d | 4 | 1.34mi |
| 3681 Lindell Blvd Saint Louis, MO | 3.0 | 1.0–2.5 | 1292 | $3,579 | $2.77 | 0d | 60 | 1.43mi |
Listing history 25 events
-
2026-06-21days on market $429,900 Active 17 DOM
-
2026-06-18days on market $429,900 Active 14 DOM
-
2026-06-17days on market $429,900 Active 13 DOM
-
2026-06-16days on market $429,900 Active 12 DOM
-
2026-06-15days on market $429,900 Active 11 DOM
-
2026-06-13days on market $429,900 Active 9 DOM
-
2026-06-09days on market $429,900 Active 5 DOM
-
2026-06-08days on market $429,900 Active 4 DOM
-
2026-06-07statusdays on market $429,900 Active 3 DOM
-
2026-06-05days on market $429,900 Coming Soon 12 DOM
-
2026-06-03days on market $429,900 Coming Soon 11 DOM
-
2026-06-02days on market $429,900 Coming Soon 10 DOM
-
2026-06-01days on market $429,900 Coming Soon 9 DOM
-
2026-05-31days on market $429,900 Coming Soon 8 DOM
-
2026-05-23historical $429,900
-
2022-07-14price $389,900
-
2022-06-10price $400,000
-
2018-06-06soldstatus $140,000
-
2018-05-11soldstatus Closed 667-char remark
Show marketing remark (667 chars)
Are you looking for an ALL BRICK HOME OR INVESTMENT PROPERTY IN THE CENTRAL WEST END? THEN LOOK NO FURTHER!! This stone building has endured its test in time and she is still standing strong. Some of her updates include, thermal windows, newer kitchen and baths, updated hot water heater and furnaces. This building is perfect if you want to live rent free by occupying one and renting out the other unit. Located near everything, shopping, grocery stores, eateries, highways and more. Each unit has 3 bedrms with a possible 4th. You have a full basement that's clean as a whistle and has an extra room for storage or completing your favorite DIY projects. HURRY!!!
-
2018-04-03status Pending 667-char remark
Show marketing remark (667 chars)
Are you looking for an ALL BRICK HOME OR INVESTMENT PROPERTY IN THE CENTRAL WEST END? THEN LOOK NO FURTHER!! This stone building has endured its test in time and she is still standing strong. Some of her updates include, thermal windows, newer kitchen and baths, updated hot water heater and furnaces. This building is perfect if you want to live rent free by occupying one and renting out the other unit. Located near everything, shopping, grocery stores, eateries, highways and more. Each unit has 3 bedrms with a possible 4th. You have a full basement that's clean as a whistle and has an extra room for storage or completing your favorite DIY projects. HURRY!!!
-
2018-03-29status Active 667-char remark
Show marketing remark (667 chars)
Are you looking for an ALL BRICK HOME OR INVESTMENT PROPERTY IN THE CENTRAL WEST END? THEN LOOK NO FURTHER!! This stone building has endured its test in time and she is still standing strong. Some of her updates include, thermal windows, newer kitchen and baths, updated hot water heater and furnaces. This building is perfect if you want to live rent free by occupying one and renting out the other unit. Located near everything, shopping, grocery stores, eateries, highways and more. Each unit has 3 bedrms with a possible 4th. You have a full basement that's clean as a whistle and has an extra room for storage or completing your favorite DIY projects. HURRY!!!
-
2018-03-23status Pending 667-char remark
Show marketing remark (667 chars)
Are you looking for an ALL BRICK HOME OR INVESTMENT PROPERTY IN THE CENTRAL WEST END? THEN LOOK NO FURTHER!! This stone building has endured its test in time and she is still standing strong. Some of her updates include, thermal windows, newer kitchen and baths, updated hot water heater and furnaces. This building is perfect if you want to live rent free by occupying one and renting out the other unit. Located near everything, shopping, grocery stores, eateries, highways and more. Each unit has 3 bedrms with a possible 4th. You have a full basement that's clean as a whistle and has an extra room for storage or completing your favorite DIY projects. HURRY!!!
-
2018-03-10$150,000 Active 667-char remark
Show marketing remark (667 chars)
Are you looking for an ALL BRICK HOME OR INVESTMENT PROPERTY IN THE CENTRAL WEST END? THEN LOOK NO FURTHER!! This stone building has endured its test in time and she is still standing strong. Some of her updates include, thermal windows, newer kitchen and baths, updated hot water heater and furnaces. This building is perfect if you want to live rent free by occupying one and renting out the other unit. Located near everything, shopping, grocery stores, eateries, highways and more. Each unit has 3 bedrms with a possible 4th. You have a full basement that's clean as a whistle and has an extra room for storage or completing your favorite DIY projects. HURRY!!!
-
2012-05-18soldstatus
-
2011-09-27$130,000
ⓘ Source: listings_history table (triggers on properties + properties_extension) + one-shot
backfill from property_details.listing_events for pre-trigger history.
Tax reassessment forecast MO · Resets to sale price
- Current annual tax
- $1,676 · $140/mo
- Projected year-2 tax
- $4,170 · $348/mo
- Expected delta
- +$2,494/yr (+$208/mo · 148.8%)
ⓘ Screening estimate from a state-policy table — verify with the county assessor before closing.
Climate risk First Street
- Flood 5/10 Major FEMA zone X (unshaded) · 24% chance over 30 yrs
- Wildfire 1/10 Low
- Heat 5/10 Major 7 d/yr ≥107°F today · 21 d/yr by 30 yrs out
- Wind 2/10 Low 100% chance of damaging wind over 30 yrs
- Air quality 4/10 Moderate 4 unhealthy d/yr today · 5 by 30 yrs out
Nearby sold comps map
Loading sold comps map…
Walkable amenities ~0.75 mi
Loading nearby amenities…
Taxation est. · year 1
- Rental income
- $45,792
- − Mortgage interest
- −$24,081
- − Property taxes
- −$1,676
- − Insurance
- −$2,150
- − Repairs & maintenance
- −$3,663
- − Management
- −$3,663
- − Depreciation
- −$12,506
- Taxable loss
- −$1,948
- Est. tax savings @ 24.0%
- +$467
- After-tax cash flow
- $5,764/yr
For passive investors: Depreciation is non-cash, so a rental often shows a tax loss while cash-flowing — sheltering income. Rental losses are passive: they offset passive income freely, and up to $25,000/yr can offset ordinary (W-2) income if you actively participate and your MAGI is under $100k (phasing out to $0 by $150k); unused losses carry forward. On sale, claimed depreciation is recaptured at up to 25%, and gains may owe capital-gains tax (a 1031 exchange can defer both). Figures are a year-1 estimate at your 24.0% rate — not tax advice; consult a CPA.
Schools (NCES district)
- District
- St. Louis City
- NCES district ID
- 2929280
- Math proficiency
- 10% ▼ -6.00%
- Reading proficiency
- 18% ▼ -3.00%
- Median HH income
- $35,685
- Composite
- 11.54/100
- National rank
- #9699
- State rank
- #312 of 324 in MO
Livability — St. Louis
No livability data for this city. (Only ~50 U.S. cities are tracked.)
Census & demographics
- Census place
- St. Louis, MO
- County
- Saint Louis City · 254,015 people
- City population
- 283,259
- Metro
- St. Louis, MO-IL
- Population (ZIP)
- 21,336
- Household income
- $55,147
- Rent vs Own
- Severe rent burden
- 2180.0
Population outlook (St. Louis County) Hauer SSP2
- Today (2025)
- 315,737 people
- By 2030
- 313,865 · -0.6%
- By 2040
- 305,439 · -3.3%
- By 2050
- 296,529 · -6.1%
- By 2075
- 271,028 · -14.2%
- By 2100
- 255,359 · -19.1%
Race, ethnicity, and origin ACS 2023
- Neighborhood character
- Diverse neighborhood (Simpson 0.62)
- Race & ethnicity
- White 54% Black 26% Asian 13% Hispanic / Latino 4% Two or more races 4%
- Common ancestry
- Lithuanian 4% Romanian 3% Iranian 2%
- Foreign-born
- 13% · China, Canada, South Korea
- Languages at home
- 85% English-only · Chinese 3% Other Asian/Pacific 3% Spanish 3%
Political lean MEDSL · St. Louis
- 2024 margin
- Solid D (+64.7) · D 81.4% · R 16.7% · Other 2.0%
- 2008→2024 swing
- -3.5pp toward R · 2008: 68.2pp · 2024: 64.7pp
- All cycles
- 2024: D+64.7 2020: D+66.2 2016: D+63.7 2012: D+66.6 2008: D+68.2
Not yet ingested
- Civics
- —
Market trends
- HPI YoY
- ▼ -111.22%
- Current HPI
- 225.1081
- Rent YoY
- ▲ 3.10%
- Metro
- St. Louis, MO-IL
- State GDP YoY
- ▲ 1.84%
- F500 in state
- 20
Industry mix (Fortune 500 HQ in MO)
| Industry | F500 HQs | Revenue |
|---|---|---|
| Healthcare | 1 | $163B |
|
||
| Insurance | 1 | $21B |
|
||
| Industrial Technology | 1 | $17B |
|
||
| Retail | 1 | $16B |
|
||
| Industrial Distribution | 1 | $10B |
|
||
| Utilities | 1 | $9B |
|
||
Price history
+230.7% since first listed11 events — show timeline
- 2026-05-23 Coming Soon $429,900 MARIS as Distributed by MLS Grid
- 2022-07-14 Price Changed $389,900 MARIS as Distributed by MLS Grid
- 2022-06-10 Price Changed $400,000 MARIS as Distributed by MLS Grid
- 2018-06-06 Sold (Public Records) $140,000 Public Records
- 2018-05-11 Sold (MLS) — MARIS as Distributed by MLS Grid
- 2018-04-03 Pending — MARIS as Distributed by MLS Grid
- 2018-03-29 Relisted — MARIS as Distributed by MLS Grid
- 2018-03-23 Pending — MARIS as Distributed by MLS Grid
- 2018-03-10 Listed $150,000 MARIS as Distributed by MLS Grid
- 2012-05-18 Sold (MLS) — MARIS as Distributed by MLS Grid
- 2011-09-27 Listed $130,000 MARIS as Distributed by MLS Grid
Property tax history
+17.3%/yrLatest (2024): $1,676 · +5.1% YoY. Source: county tax records.
Cash-flow waterfall
monthlySold comps — $/sqft
last 12 mo · ≤1 miLoading sold comps…