 🏷️ Likely Rental
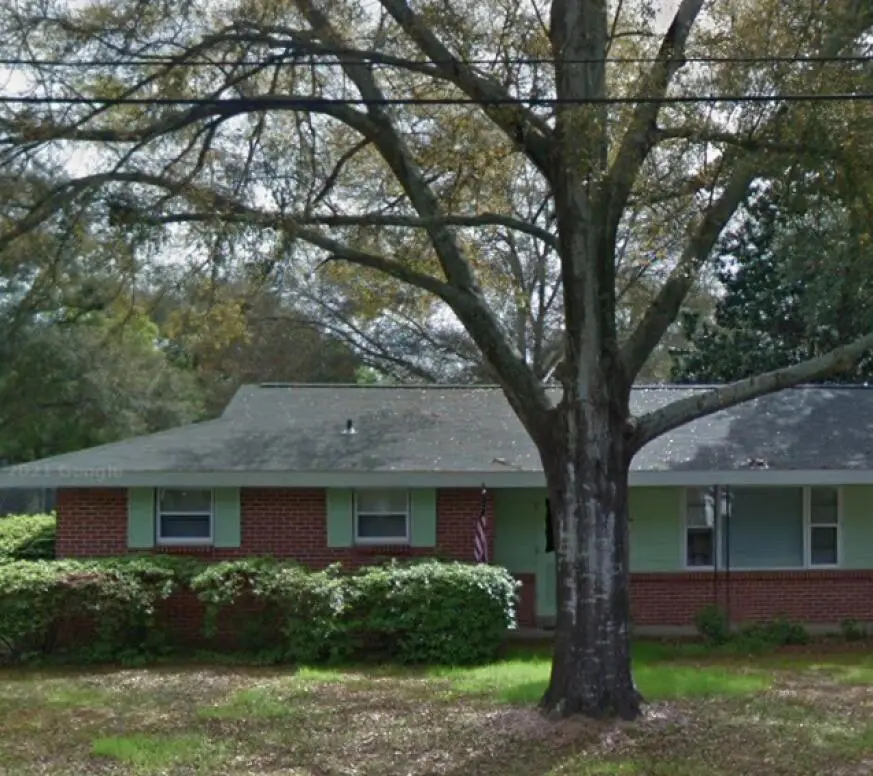
12 Magnolia Dr · Mary Esther, FL
Flood risk 1/10 · Minimal
- FEMA flood zone
- X (unshaded)
- Chance of flooding over 30 yrs
- 0.0%
- Est. flood insurance / yr
- $507 – $1,088
Fire risk 1/10 · Minimal
- Est. fire insurance / yr
- $947 – $1,759
Heat risk 10/10 · Severe
- Hot days now (above 104°F)
- 7 days/yr
- Hot days in 30 yrs
- 22 days/yr
Wind risk 9/10 · Severe
- Chance of severe wind over 30 yrs
- 99.0%
Air-quality risk 2/10 · Minimal
- Unhealthy air days now
- 1 days/yr
- Unhealthy air days in 30 yrs
- 2 days/yr
Risk factors via First Street. Map © Google.
Why this score? — see what drove the C grade
The composite is a weighted blend of 9 inputs, each scored 0–100. Each bar is that input's sub-score; the figure is the points it added to the 100-point composite (weight × sub-score).
- Cash flow +18.4/30.0
- ARV discount +15.0/15.0
- DSCR +5.8/10.0
- Schools +5.2/10.0
- 1% rule +4.6/10.0
- Livability +4.5/5.0
- Condition / age +2.5/5.0
- Rent growth +2.4/5.0
- Appreciation +0.0/10.0
$200,000
🖨 Deal sheet (PDF) 📄 Offer letter ✓ Due diligence
Listing remarks
Investor Special - Tenant in Place - Assignment Opportunity!. Solid opportunity in Mary Esther! This 3-bedroom, 1-bath home offers approximately 1,165 square feet and is in livable, original condition, making it a great candidate for a light renovation or rental hold. Major systems have already been addressed; Roof replaced in 2018 and HVAC updated in 2022. This home is being offered AS IS and presents strong upside potential with cosmetic updates. Ideal for investors looking for a fix-and-flip, buy-and-hold, or portfolio addition in a steadily growing area. Property is offered for assignment of contract. Don't miss this value-add opportunity!
Key facts
- Hvac updated
- Light renovation
- Roof replaced
Tags
Property features AI
Exterior
- Parking: Carport (1 space)
- Utilities: Public water; Public sewer; Electric service
- Home design: Ranch-style single-story home; Entry level: First floor; Zoned for single-family residence
- Construction: Brick construction; Composite shingle roof; Slab foundation; Built in 1957
- Exterior features: Lot about 0.24 acre (approx. 102 x 102); Subdivision: ROSEWOOD HOMES; No pool
Interior
- Kitchen: First-floor kitchen
- Bedrooms: 3 bedrooms (all on the first floor)
- Flooring: Tile
- Bathrooms: 1 full bathroom
- Heating & cooling: Central electric air conditioning
- Interior features: Tile flooring; Central air conditioning
Neighborhood map
What this means for you Summary
Snapshot
- This is a 3-bed/1.0-bath single-family listed at $200k.
Deal economics
- At list price, monthly cash flow is $186 ($2k/yr) — positive.
- The deal already cash-flows at list — no discount required.
- To meet the 1% rule (rent ≥ 1% of price), the offer needs to be $192k (4.1% below list).
- Recommended offer: $192k (4.1% below list) — sets the bar for 1% rule.
- Cap rate 7.4% vs local median 4.8% in Mary Esther — top-decile yield for the area; either an underpriced asset or a hidden risk that comps aren't pricing in. Stress-test before assuming the spread holds.
Location & tenants
- Location reads 89/100 on livability (#2 in FL, #137 nationally) — a professional / high-income tenant draw. Strengths: crime A+, commute A+, cost of living A+.
- Okaloosa (other): math 60% / reading 60% proficiency, ranked #12 of 73 in FL (top 16%) — acceptable for families but not a draw, mixed tenant base, ~2y average lease.
- Zoned schools: Mary Esther Elementary School (math 53% / reading 51%, grade C-, #990 of 2,144 statewide, top 48%, 441 students, 70% FRL); Fort Walton Beach High School (math 54% / reading 58%, grade C, #131 of 667 statewide, top 20%, 1,620 students, 42% FRL) — zoned schools average 56% FRL vs 36% district-wide (20 pts higher); higher-poverty schools than district average — tighter screening recommended.
- Market conditions: Rents soft (-0.5%/yr); 178 active listings in the ZIP; 27 comparable units currently listed for rent nearby; rentals at typical pace (median 23d on market — plan ~3-4 weeks tenant-placement turnaround); solid renter incomes; 1,268 units permitted in Okaloosa County in 2024 (175 in 5+ unit buildings).
Forward outlook
- Local home prices are declining (-3.0%/yr); year-one equity from $1k of loan paydown is wiped out by about $6k of value loss. Plan a longer hold.
- Okaloosa County population projected at +37% by 2050 — long-run rental-demand tailwind backs the buy-and-hold thesis.
Negotiation context
- It's been on market 39 days — a 3% lower offer ($194k) is reasonable based on typical stale-listing flexibility.
- 2 sale attempts with the ask held roughly flat each time — persistent listings suggest the price (not the market) is what's stuck; bring a comps-based counter.
Risks & watch-outs
- Watch-outs: built in 1957 — expect roof / HVAC / electrical / plumbing capex.
- Climate carrying-cost: severe wind risk, 99% chance of damaging wind over 30y; extreme-heat days projected 7→22/yr by 2055 (HVAC capex compounding) — expect insurance premiums to compound above CPI over the hold.
Questions for the listing agent
- It's been on market 39 days. Have you received any prior offers? Is the seller open to a 4% concession, seller financing, or rate buy-down credit?
- Built in 1957 — when were the roof, HVAC, electrical panel, plumbing, and water heater last replaced?
- Is there a deadline driving the sale (1031 exchange, divorce, estate, relocation)? That informs how much negotiation room exists.
- Schools are B-rated — typically a magnet for longer-tenancy family renters. What's the average tenant stay here, and is there a school-zone premium baked into asking?
- What's the average days-on-market for RENTAL listings here right now (not sales)? A rising rental-DOM trend means longer vacancies and softer asking-rent achievability than the comps imply.
- What's the recent tenant-quality profile in this submarket — average credit score on applications, eviction rate, late-payment / NSF rate, and stable-employment percentage? A property-management company in the area should have these aggregated.
- How much new for-sale + rental construction is in the pipeline within 1–3 miles? Heavy new supply typically softens prices + rents 12–24 months out; constrained supply supports both.
Investment metrics
- 1% rule
- 0.96% ✗
- Cap rate
- 7.41%
- Cash-on-cash
- 3.99%
- DSCR
- 1.18
- GRM
- 8.7
CMA / ARV
- ARV (median comp)
- $279,949
- List price
- $200,000
- Delta
- -28.56%
- Verdict
- UNDERPRICED
- Comps
- 20 within 1.0 mi
Show comp detail 12 sales within ~0.75 mi
| Address | Dist | Beds/Ba | Sqft | Sold | Price | $/sf | Match |
|---|---|---|---|---|---|---|---|
| 500 Bryn Mawr Blvd | 0.41mi | 3/2.0 | 1,200 (+3%) | 1mo | $315,000 | $263 | 71 |
| 715 Crestwood St | 0.28mi | 3/2.0 | 1,120 (-4%) | 9mo | $285,000 | $254 | 69 |
| 345 Avon Ln | 0.28mi | 3/2.5 | 1,235 (+6%) | 6mo | $290,000 | $235 | 66 |
| 129 Bryn Mawr Blvd | 0.05mi | 3/1.0 | 1,000 (-14%) | 10mo | $170,000 | $170 | 66 |
| 607 Hollywood Blvd E | 0.19mi | 3/1.0 | 1,000 (-14%) | 3mo | $264,000 | $264 | 65 |
| 431 Stonehenge Dr | 0.39mi | 4/2.0 (+1) | 1,200 (+3%) | 7mo | $291,000 | $243 | 62 |
| 640 Cornwall Ter | 0.54mi | 3/2.0 | 1,102 (-5%) | 0mo | $150,000 | $136 | 62 |
| 451 Stonehenge Dr Dr | 0.42mi | 4/2.0 (+1) | 1,209 (+4%) | 8mo | $300,000 | $248 | 59 |
| 641 Cornwall Ter | 0.54mi | 4/2.0 (+1) | 1,200 (+3%) | 3mo | $290,000 | $242 | 58 |
| 408 NW Adam St | 0.55mi | 2/2.0 (-1) | 1,122 (-4%) | 3mo | $281,000 | $250 | 57 |
| 650 Bryn Mawr Blvd | 0.55mi | 2/1.0 (-1) | 1,240 (+6%) | 9mo | $269,000 | $217 | 51 |
| 387 NW Canterbury Cir | 0.68mi | 3/2.0 | 1,294 (+11%) | 1mo | $384,900 | $297 | 45 |
Match score weights: distance 35% · size 25% · config 20% · recency 20%. Top-matched comps best support the ARV.
Projected returns pro-forma
-3.0% appreciation · 0.0% rent growth · sell at horizon
- IRR
- -13.4%
- Equity multiple
- 0.53×
- Total profit
- $-26,172
- Equity at exit
- $29,821
- IRR
- -9.8%
- Equity multiple
- 0.48×
- Total profit
- $-29,251
- Equity at exit
- $17,292
Cash invested: $56,000 (down + closing). Projections, not guarantees.
Landlord ↔ Tenant lean methodology
- Overall (STATE)
- 87 Strongly Landlord-Friendly
- State Florida
- 87 Strongly Landlord-Friendly · R+3
- County
- — inherits STATE
- City
- — inherits STATE
ZIP-level market 32569
- Home prices YoY
- -26.5%
- Rents YoY
- -0.5%
- Active inventory
- 178
- Price-to-rent
- 8.7×
Monthly cashflow live
- Estimated rent
- $1,917 high interval (Pro) →
- Mortgage (P&I)
- −$1,049
- Tax from tax record
- −$196 /mo · $2,357/yr
- Insurance
- −$83
- HOA
- −$0
- Vacancy / Maint / Mgmt
- −$403
- Net cashflow
- $186
Break-even live
Sensitivity live
| Price | -10% $299 | -5% $243 | +0% $186 | +5% $130 | +10% $73 |
|---|---|---|---|---|---|
| Rent | -10% $35 | -5% $110 | +0% $186 | +5% $262 | +10% $338 |
| Rate | -1.0pp $287 | -0.5pp $237 | base $186 | +0.5pp $134 | +1.0pp $82 |
UW: 25.0% down · 7.5% · 30yr · 1.5% tax · 5.0% vac · 8.0% maint · 8.0% mgmt
Financing live
Cash to close
- Down payment
- $50,000
- Closing costs
- $6,000
- Reserves months
- —
- Total cash needed
- —
Loan-product check · same deal, 3 products live
Conventional
25% down · 7.5% · 30yr
- Down + closing
- —
- Monthly P&I
- —
- Monthly cashflow
- —
- DSCR
- —
- Eligible?
- —
Personal DTI + credit; lowest rate.
DSCR
20% down · 8.5% · 30yr
- Down + closing
- —
- Monthly P&I
- —
- Monthly cashflow
- —
- DSCR
- —
- Eligible?
- —
No personal income docs; deal must DSCR.
Hard money
10% down · 12.0% · 12mo
- Down + closing
- —
- Monthly P&I
- —
- Monthly cashflow
- —
- DSCR
- —
- Eligible?
- —
Short-term bridge; refi at stabilization.
Rent comps 27 comps
| Address | Beds | Baths | Sqft | Rent | $/sqft | DOM | Units | Dist |
|---|---|---|---|---|---|---|---|---|
| 413 Sea Rover Ln NW Unit F Fort Walton Beach, FL | 2.0 | 1.5 | 1035 | $1,600 | $1.55 | 15d | 1 | 0.48mi |
| 413 Sea Rover Ln NW Unit F Fort Walton Beach, FL | 2.0 | 1.5 | 1035 | $1,600 | $1.55 | 22d | 1 | 0.48mi |
| 17 Cape Dr NW Unit B Fort Walton Beach, FL | 3.0 | 2.0 | 1462 | $1,995 | $1.36 | 15d | 1 | 0.66mi |
| 28 E Lane Dr Mary Esther, FL | 2.0 | 2.0 | 1134 | $1,500 | $1.32 | 45d | 1 | 0.69mi |
| 27 E Lane Dr Mary Esther, FL | 2.0 | 2.0 | 1134 | $1,695 | $1.49 | 15d | 1 | 0.69mi |
| 200 Page Bacon Rd Mary Esther, FL | 1.0–3.0 | 1.0–2.0 | 1030 | $2,588 | $2.51 | 15d | 18 | 0.72mi |
| 358 Coral Dr SW Fort Walton Beach, FL | 3.0 | 2.0 | 1350 | $1,800 | $1.33 | 45d | 1 | 0.82mi |
| 44 Wright Pkwy NW Fort Walton Beach, FL | 2.0 | 1.0 | 1000 | $1,350 | $1.35 | 22d | 1 | 0.87mi |
| 209 W Miracle Strip Pkwy Unit A203 Mary Esther, FL | 2.0 | 1.0 | 900 | $1,350 | $1.50 | 22d | 1 | 1.01mi |
| 280 Anderson Dr Mary Esther, FL | 3.0 | 1.0 | 1066 | $1,695 | $1.59 | 45d | 1 | 1.08mi |
| 1851 Stella Ln Unit 5-538 Fort Walton Beach, FL | 2.0 | 2.0 | 980 | $1,650 | $1.68 | 15d | 1 | 1.28mi |
| 1855 Stella Ln Unit 6-617 Fort Walton Beach, FL | 2.0 | 2.0 | 980 | $1,650 | $1.68 | 15d | 1 | 1.28mi |
| 1850 Stella Ln Unit 4-411 Fort Walton Beach, FL | 2.0 | 2.0 | 980 | $1,650 | $1.68 | 15d | 1 | 1.28mi |
| 1850 Stella Ln Unit 4-417 Fort Walton Beach, FL | 2.0 | 2.0 | 980 | $1,800 | $1.84 | 45d | 1 | 1.28mi |
| 405 Marshall Ct Fort Walton Beach, FL | 2.0 | 2.0 | 1000 | $1,495 | $1.50 | 45d | 1 | 1.30mi |
| 1861 Stella Ln Fort Walton Beach, FL | 2.0 | 2.0 | 980 | $1,650 | $1.68 | 15d | 5 | 1.30mi |
| 402 Marshall Ct NW #6 Fort Walton Beach, FL | 2.0 | 2.0 | 1050 | $1,500 | $1.43 | 22d | 1 | 1.33mi |
| 305 Leah Miller Dr NW Fort Walton Beach, FL | 3.0 | 1.5 | 1334 | $2,000 | $1.50 | 22d | 1 | 1.35mi |
| 909 Santa Rosa Blvd #328 Fort Walton Beach, FL | 2.0 | 2.0 | 1035 | $2,600 | $2.51 | 45d | 1 | 1.37mi |
| 218 Rose Marie Ln SW Fort Walton Beach, FL | 3.0 | 1.0 | 1208 | $1,750 | $1.45 | 22d | 1 | 1.39mi |
| 940 Santa Rosa Blvd Fort Walton Beach, FL | 2.0 | 2.0 | 1000 | $2,200 | $2.20 | 22d | 4 | 1.41mi |
| 646 Virginia Oak Ct Fort Walton Beach, FL | 2.0 | 1.5 | 1278 | $1,545 | $1.21 | 15d | 1 | 1.41mi |
| 645 Virginia Oak Ct Fort Walton Beach, FL | 2.0 | 1.5 | 1254 | $1,900 | $1.52 | 15d | 1 | 1.44mi |
| 1850 Norwood Ct Unit 2 Fort Walton Beach, FL | 2.0 | 2.0 | 960 | $1,350 | $1.41 | 22d | 1 | 1.46mi |
| 1851 Norwood Ct Unit 4 Fort Walton Beach, FL | 2.0 | 2.0 | 960 | $1,350 | $1.41 | 22d | 1 | 1.48mi |
| 1855 Norwood Ct Fort Walton Beach, FL | 2.0 | 2.0 | 960 | $1,400 | $1.46 | 45d | 1 | 1.49mi |
| 1855 Norwood Ct #5 Fort Walton Beach, FL | 2.0 | 2.0 | 960 | $1,350 | $1.41 | 45d | 1 | 1.49mi |
Listing history 17 events
-
2026-06-21days on market $200,000 Active 39 DOM
-
2026-06-18days on market $200,000 Active 36 DOM
-
2026-06-17days on market $200,000 Active 35 DOM
-
2026-06-16days on market $200,000 Active 34 DOM
-
2026-06-15days on market $200,000 Active 33 DOM
-
2026-06-14days on market $200,000 Active 31 DOM
-
2026-06-13days on market $200,000 Active 30 DOM
-
2026-06-10days on market $200,000 Active 28 DOM
-
2026-06-09days on market $200,000 Active 27 DOM
-
2026-06-08days on market $200,000 Active 26 DOM
-
2026-06-07days on market $200,000 Active 25 DOM
-
2026-06-05days on market $200,000 Active 22 DOM
-
2026-06-02days on market $200,000 Active 20 DOM
-
2026-06-01days on market $200,000 Active 19 DOM
-
2026-05-31days on market $200,000 Active 18 DOM
-
2026-05-30days on market $200,000 Active 17 DOM
-
2026-05-12$200,000 Active
ⓘ Source: listings_history table (triggers on properties + properties_extension) + one-shot
backfill from property_details.listing_events for pre-trigger history.
Tax reassessment forecast FL · Resets to sale price
- Current annual tax
- $2,357 · $196/mo
- Projected year-2 tax
- $2,357 · $196/mo
- Expected delta
- $0/yr ($0/mo · 0.0%)
ⓘ Screening estimate from a state-policy table — verify with the county assessor before closing.
Climate risk First Street
- Flood 1/10 Low FEMA zone X (unshaded) · 0% chance over 30 yrs
- Wildfire 1/10 Low
- Heat 10/10 Extreme 7 d/yr ≥104°F today · 22 d/yr by 30 yrs out
- Wind 9/10 Extreme 99% chance of damaging wind over 30 yrs
- Air quality 2/10 Low 1 unhealthy d/yr today · 2 by 30 yrs out
Nearby sold comps map
Loading sold comps map…
Walkable amenities ~0.75 mi
Loading nearby amenities…
Taxation est. · year 1
- Rental income
- $23,009
- − Mortgage interest
- −$11,203
- − Property taxes
- −$2,357
- − Insurance
- −$1,000
- − Repairs & maintenance
- −$1,841
- − Management
- −$1,841
- − Depreciation
- −$5,818
- Taxable loss
- −$1,050
- Est. tax savings @ 24.0%
- +$252
- After-tax cash flow
- $2,487/yr
For passive investors: Depreciation is non-cash, so a rental often shows a tax loss while cash-flowing — sheltering income. Rental losses are passive: they offset passive income freely, and up to $25,000/yr can offset ordinary (W-2) income if you actively participate and your MAGI is under $100k (phasing out to $0 by $150k); unused losses carry forward. On sale, claimed depreciation is recaptured at up to 25%, and gains may owe capital-gains tax (a 1031 exchange can defer both). Figures are a year-1 estimate at your 24.0% rate — not tax advice; consult a CPA.
Schools (NCES district)
- District
- Okaloosa
- NCES district ID
- 1201380
- Math proficiency
- 60% ▼ -12.00%
- Reading proficiency
- 60% ▼ -4.00%
- Median HH income
- $55,601
- Composite
- 51.62/100
- National rank
- #1705
- State rank
- #12 of 73 in FL
Livability — Mary Esther
- Score
- 89/100
- State rank
- #2
- US rank
- #137
Category grades
Schools grade is shown separately in the Schools card above.
Census & demographics
- Census place
- Mary Esther, FL
- County
- Okaloosa County · 194,352 people
- City population
- 12,063
- Metro
- Crestview-Fort Walton Beach-Destin, FL
- Population (ZIP)
- 12,063
- Household income
- $77,718
- Rent vs Own
- Severe rent burden
- 416.0
Population outlook (Okaloosa County) Hauer SSP2
- Today (2025)
- 235,133 people
- By 2030
- 253,483 · +7.8%
- By 2040
- 289,537 · +23.1%
- By 2050
- 322,954 · +37.3%
- By 2075
- 399,624 · +70.0%
- By 2100
- 425,311 · +80.9%
Race, ethnicity, and origin ACS 2023
- Neighborhood character
- Diverse neighborhood (Simpson 0.58)
- Race & ethnicity
- White 63% Two or more races 12% Black 12% Hispanic / Latino 9% Asian 8%
- Hispanic origin (detail)
- Mexican 3% Puerto Rican 2%
- Common ancestry
- Slovak 5% Romanian 2% Lithuanian 2%
- Foreign-born
- 5% · Canada, South Korea, China
- Languages at home
- 89% English-only · Other Indo-European 4% Spanish 3% Tagalog/Filipino 1%
Political lean MEDSL · Okaloosa
- 2024 margin
- Solid R (+42.4) · D 28.2% · R 70.7% · Other 1.1%
- 2008→2024 swing
- +2.5pp toward D · 2008: -44.9pp · 2024: -42.4pp
- All cycles
- 2024: R+42.4 2020: R+39.1 2016: R+47.8 2012: R+49.4 2008: R+44.9
Not yet ingested
- Civics
- —
Market trends
- HPI YoY
- ▼ -97.13%
- Current HPI
- 269.266
- Rent YoY
- ▼ -0.45%
- Metro
- Crestview-Fort Walton Beach-Destin, FL
- State GDP YoY
- ▲ 3.28%
- F500 in state
- 36
Industry mix (Fortune 500 HQ in FL)
| Industry | F500 HQs | Revenue |
|---|---|---|
| Industrial Technology | 2 | $29B |
|
||
| Insurance | 2 | $17B |
|
||
| Retail | 1 | $60B |
|
||
| Technology Distribution | 1 | $58B |
|
||
| Homebuilding | 1 | $35B |
|
||
| Technology Manufacturing | 1 | $35B |
|
||
Price history
2 events — show timeline
- 2026-05-19 Relisted — ECAR
- 2026-05-12 Listed $200,000 ECAR
Property tax history
+7.7%/yrLatest (2025): $2,357 · +1.3% YoY. Source: county tax records.
Cash-flow waterfall
monthlySold comps — $/sqft
last 12 mo · ≤1 miLoading sold comps…