5055 NE Elliott Cir #217 · Corvallis, OR
Flood risk 1/10 · Minimal
- FEMA flood zone
- X (unshaded)
- Chance of flooding over 30 yrs
- 0.0%
- Est. flood insurance / yr
- $507 – $1,088
Fire risk 4/10 · Minor
- Est. fire insurance / yr
- $498 – $926
Heat risk 4/10 · Minor
- Hot days now (above 92°F)
- 7 days/yr
- Hot days in 30 yrs
- 14 days/yr
Wind risk 1/10 · Minimal
- Chance of severe wind over 30 yrs
- —
Air-quality risk 9/10 · Severe
- Unhealthy air days now
- 12 days/yr
- Unhealthy air days in 30 yrs
- 12 days/yr
Risk factors via First Street. Map © Google.
Why this score? — see what drove the C- grade
The composite is a weighted blend of 9 inputs, each scored 0–100. Each bar is that input's sub-score; the figure is the points it added to the 100-point composite (weight × sub-score).
- Cash flow +21.3/30.0
- DSCR +6.8/10.0
- 1% rule +5.6/10.0
- Schools +4.9/10.0
- Livability +4.1/5.0
- Condition / age +4.0/5.0
- Rent growth +3.9/5.0
- ARV discount +0.0/15.0
- Appreciation +0.0/10.0
$229,900
🖨 Deal sheet 📄 Offer letter ✓ Due diligence
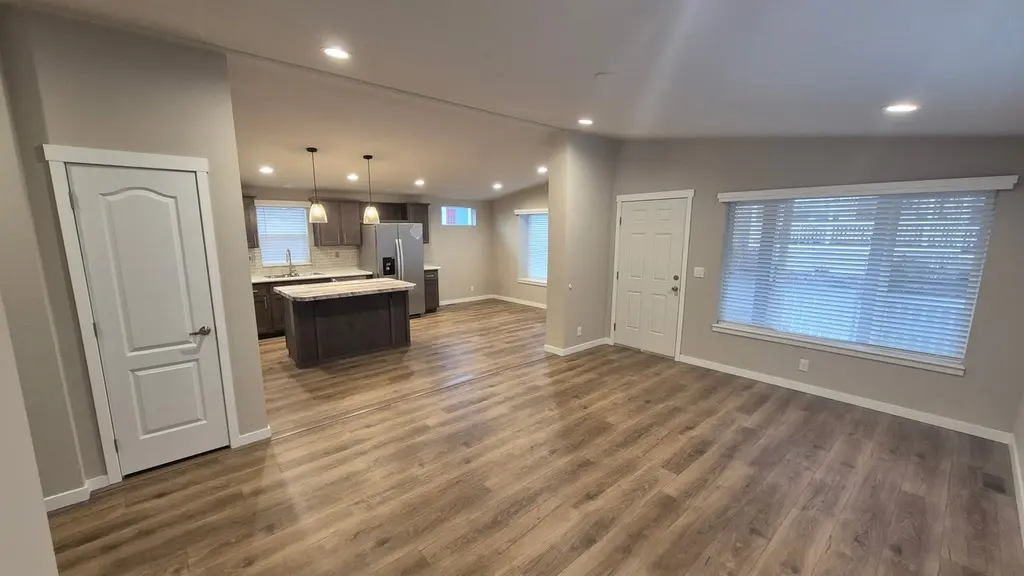
Listing remarks
FOR SALE IN A MANUFACTURED HOME COMMUNITY: Brand new home is under construction at lot #217. Many upgrades, photos are of similar home. Full package includes home, concrete driveway, carport awning and Tuff Shed. Factory warranty and two year space rent discount on new homes. All-age, pet friendly community in N. Corvallis. Energy efficient homes. Financing is available.
Key facts
- Tuff shed
- Carport awning
- Concrete driveway
Tags
Property features AI
Finance
- Other: Active listing (last modified 2026-06-08)
- Financial info: List price: $229,900
Exterior
- Utilities: Electric heating (forced air)
- Home design: Condo / unit (Spec inventory); Unit address: 5055 NE Elliott Cir #217, Corvallis, OR
Interior
- Kitchen: Includes dishwasher and refrigerator
- Bedrooms: 3 bedrooms
- Bathrooms: 2 bathrooms
- Heating & cooling: Electric forced-air heating
- Interior features: Dishwasher; Refrigerator
Neighborhood map
What this means for you Summary
Snapshot
- This is a 3-bed/2.0-bath manufactured listed at $230k. Condition is rated good.
Deal economics
- At list price, monthly cash flow is $335 ($4k/yr) — positive.
- The deal already cash-flows at list — no discount required.
- Meets the 1% rule at list price ($2k rent vs $230k).
- Cap rate 8.0% vs local median 2.6% in Corvallis — top-decile yield for the area; either an underpriced asset or a hidden risk that comps aren't pricing in. Stress-test before assuming the spread holds.
Location & tenants
- Location reads 82/100 on livability (#45 in OR, #1,113 nationally) — a professional / high-income tenant draw. Strengths: amenities A+, commute A+, health & safety A+; Watch: cost of living F.
- Corvallis SD 509J (urban): math 49% / reading 62% proficiency, ranked #15 of 183 in OR (top 8%) — acceptable for families but not a draw, mixed tenant base, ~2y average lease.
- Market conditions: Rents rising fast (+5.7%/yr); 229 active listings in the ZIP; 116 units permitted in Benton County in 2024 (0 in 5+ unit buildings).
- This rent runs 41% of the median local income ($71k/yr) — at the standard rent-burdened threshold; future hikes will face affordability resistance.
Forward outlook
- Local home prices are declining (-3.0%/yr); year-one equity from $2k of loan paydown is wiped out by about $7k of value loss. Plan a longer hold.
- Benton County population projected at +23% by 2050 — long-run rental-demand tailwind backs the buy-and-hold thesis.
- At projected returns (-3.0% appreciation + 5.7% rent growth), your $64k cash investment doubles in ~10 years — after that, you're playing with house money.
Negotiation context
- Only 12 days on market — expect competitive offers; lowballing is unlikely to land.
Questions for the listing agent
- Is there a deadline driving the sale (1031 exchange, divorce, estate, relocation)? That informs how much negotiation room exists.
- Schools are A-rated — typically a magnet for longer-tenancy family renters. What's the average tenant stay here, and is there a school-zone premium baked into asking?
- What's the average days-on-market for RENTAL listings here right now (not sales)? A rising rental-DOM trend means longer vacancies and softer asking-rent achievability than the comps imply.
- What's the recent tenant-quality profile in this submarket — average credit score on applications, eviction rate, late-payment / NSF rate, and stable-employment percentage? A property-management company in the area should have these aggregated.
- How much new for-sale + rental construction is in the pipeline within 1–3 miles? Heavy new supply typically softens prices + rents 12–24 months out; constrained supply supports both.
Investment metrics
- 1% rule
- 1.06% ✓
- Cap rate
- 8.04%
- Cash-on-cash
- 6.25%
- DSCR
- 1.28
- GRM
- 7.9
CMA / ARV
- ARV (on-the-fly)
- $159,600
- Comps found
- 5
Show comp detail 5 sales within ~0.75 mi
| Address | Dist | Beds/Ba | Sqft | Sold | Price | $/sf | Match |
|---|---|---|---|---|---|---|---|
| 5055 NE Elliott Cir #51 | 0.26mi | 4/2.0 (+1) | 1,404 (+0%) | 9mo | $160,000 | $114 | 75 |
| 5055 NE Elliott Cir #35 | 0.26mi | 3/2.0 | 1,512 (+8%) | 6mo | $125,000 | $83 | 69 |
| 5055 NE Elliott Cir #8 | 0.26mi | 2/2.0 (-1) | 1,344 (-4%) | 10mo | $100,000 | $74 | 68 |
| 5055 NE Elliott Cir #30 | 0.26mi | 3/2.0 | 1,512 (+8%) | 19mo | $173,750 | $115 | 59 |
| 5055 NE Elliott Cir #20 | 0.26mi | 3/2.0 | 1,224 (-13%) | 23mo | $174,900 | $143 | 48 |
Match score weights: distance 35% · size 25% · config 20% · recency 20%. Top-matched comps best support the ARV.
Projected returns pro-forma
-3.0% appreciation · 5.74% rent growth · sell at horizon
- IRR
- -3.6%
- Equity multiple
- 0.86×
- Total profit
- $-8,969
- Equity at exit
- $34,279
- IRR
- 9.0%
- Equity multiple
- 1.77×
- Total profit
- $49,773
- Equity at exit
- $19,878
Cash invested: $64,372 (down + closing). Projections, not guarantees.
Landlord ↔ Tenant lean methodology
- Overall (STATE)
- 28 Tenant-Leaning
- State Oregon
- 28 Tenant-Leaning · D+6
- County
- — inherits STATE
- City
- — inherits STATE
ZIP-level market 97330
- Rents YoY
- 5.7%
- Active inventory
- 229
- Price-to-rent
- 7.9×
Monthly cashflow live
- Estimated rent
- $2,435 medium interval (Pro) →
- Mortgage (P&I)
- −$1,206
- Tax est. 1.5%
- −$287 /mo · $3,448/yr
- Insurance
- −$96
- HOA
- −$0
- Vacancy / Maint / Mgmt
- −$511
- Net cashflow
- $335
Break-even live
UW: 25.0% down · 7.5% · 30yr · 1.5% tax · 5.0% vac · 8.0% maint · 8.0% mgmt
Financing live
Cash to close
- Down payment
- $57,475
- Closing costs
- $6,897
- Reserves months
- —
- Total cash needed
- —
Loan-product check · same deal, 3 products live
Conventional
25% down · 7.5% · 30yr
- Down + closing
- —
- Monthly P&I
- —
- Monthly cashflow
- —
- DSCR
- —
- Eligible?
- —
Personal DTI + credit; lowest rate.
DSCR
20% down · 8.5% · 30yr
- Down + closing
- —
- Monthly P&I
- —
- Monthly cashflow
- —
- DSCR
- —
- Eligible?
- —
No personal income docs; deal must DSCR.
Hard money
10% down · 12.0% · 12mo
- Down + closing
- —
- Monthly P&I
- —
- Monthly cashflow
- —
- DSCR
- —
- Eligible?
- —
Short-term bridge; refi at stabilization.
Listing history 10 events
-
2026-06-19days on market $229,900 Active 12 DOM
-
2026-06-18days on market $229,900 Active 11 DOM
-
2026-06-17days on market $229,900 Active 10 DOM
-
2026-06-16days on market $229,900 Active 9 DOM
-
2026-06-15days on market $229,900 Active 8 DOM
-
2026-06-14days on market $229,900 Active 6 DOM
-
2026-06-10days on market $229,900 Active 3 DOM
-
2026-06-09days on market $229,900 Active 2 DOM
-
2026-06-08remarks 373-char remark
-
2026-06-08$229,900 Active 1 DOM
ⓘ Source: listings_history table (triggers on properties + properties_extension) + one-shot
backfill from property_details.listing_events for pre-trigger history.
Climate risk First Street
- Flood 1/10 Low FEMA zone X (unshaded) · 0% chance over 30 yrs
- Wildfire 4/10 Moderate
- Heat 4/10 Moderate 7 d/yr ≥92°F today · 14 d/yr by 30 yrs out
- Wind 1/10 Low
- Air quality 9/10 Extreme 12 unhealthy d/yr today · 12 by 30 yrs out
Nearby sold comps map
Loading sold comps map…
Walkable amenities ~0.75 mi
Loading nearby amenities…
Taxation est. · year 1
- Rental income
- $29,225
- − Mortgage interest
- −$12,878
- − Property taxes
- −$3,448
- − Insurance
- −$1,150
- − Repairs & maintenance
- −$2,338
- − Management
- −$2,338
- − Depreciation
- −$6,688
- Taxable income
- $385
- Est. tax owed @ 24.0%
- −$92
- After-tax cash flow
- $3,930/yr
For passive investors: Depreciation is non-cash, so a rental often shows a tax loss while cash-flowing — sheltering income. Rental losses are passive: they offset passive income freely, and up to $25,000/yr can offset ordinary (W-2) income if you actively participate and your MAGI is under $100k (phasing out to $0 by $150k); unused losses carry forward. On sale, claimed depreciation is recaptured at up to 25%, and gains may owe capital-gains tax (a 1031 exchange can defer both). Figures are a year-1 estimate at your 24.0% rate — not tax advice; consult a CPA.
Condition & rehab AI · 12 photos
This manufactured home is in excellent condition with modern finishes and a well-maintained exterior. It is move-in ready and offers a good return on investment.
Value-add opportunities
- Both Painting the exterior and interior walls — Fresh paint can enhance curb appeal and interior aesthetics.
- Both Adding smart home features — Smart home features can increase both resale and rental value.
- Resale Upgrading the kitchen appliances — Upgrading to more modern or energy-efficient appliances can boost resale value.
- Rental Landscaping the front yard — A well-maintained front yard can attract more renters and increase rental value.
Renovation cost estimate screening
Value-add ROI direction
- Both Painting the exterior and interior walls — Fresh paint can enhance curb appeal and interior aesthetics. ↑
- Both Adding smart home features — Smart home features can increase both resale and rental value. ↑
- Resale Upgrading the kitchen appliances — Upgrading to more modern or energy-efficient appliances can boost resale value. ↑
- Rental Landscaping the front yard — A well-maintained front yard can attract more renters and increase rental value. ↑
ⓘ Cost ranges are severity-bucket heuristics (US national rule-of-thumb). Get contractor quotes + a written scope before underwriting a rehab budget.
Schools (NCES district)
- District
- Corvallis SD 509J
- NCES district ID
- 4103480
- Math proficiency
- 49% ▼ -3.00%
- Reading proficiency
- 62% ▼ -1.00%
- Median HH income
- $44,820
- Composite
- 48.62/100
- National rank
- #4584
- State rank
- #15 of 183 in OR
Livability — Corvallis
- Score
- 82/100
- State rank
- #45
- US rank
- #1113
Category grades
Schools grade is shown separately in the Schools card above.
Census & demographics
- County
- Benton County · 98,484 people
- City population
- 67,812
- Metro
- Corvallis, OR
- Population (ZIP)
- 43,878
- Household income
- $70,742
- Rent vs Own
- Severe rent burden
- 3416.0
Population outlook (Benton County) Hauer SSP2
- Today (2025)
- 96,963 people
- By 2030
- 101,658 · +4.8%
- By 2040
- 110,157 · +13.6%
- By 2050
- 119,275 · +23.0%
- By 2075
- 145,172 · +49.7%
- By 2100
- 165,349 · +70.5%
Race, ethnicity, and origin ACS 2023
- Neighborhood character
- Predominantly White (75%)
- Race & ethnicity
- White 75% Hispanic / Latino 9% Asian 9% Two or more races 7% Black 2%
- Hispanic origin (detail)
- Mexican 6%
- Common ancestry
- Italian 4% Portuguese 4% Slovak 3%
- Foreign-born
- 13% · Canada, China, South Korea
- Languages at home
- 84% English-only · Spanish 6% Chinese 3% Korean 2%
Political lean MEDSL · Benton
- 2024 margin
- Solid D (+39.6) · D 68.1% · R 28.5% · Other 3.5%
- 2008→2024 swing
- +8.1pp toward D · 2008: 31.5pp · 2024: 39.6pp
- All cycles
- 2024: D+39.6 2020: D+39.7 2016: D+33.8 2012: D+28.8 2008: D+31.5
Not yet ingested
- Civics
- —
Market trends
- HPI YoY
- ▼ -420.12%
- Current HPI
- 298.7746
- Rent YoY
- ▲ 5.74%
- Metro
- Corvallis, OR
- State GDP YoY
- ▲ 2.05%
- F500 in state
- 2
Industry mix (Fortune 500 HQ in OR)
| Industry | F500 HQs | Revenue |
|---|---|---|
| Consumer Goods | 1 | $51B |
|
||
Cash-flow waterfall
monthlySold comps — $/sqft
last 12 mo · ≤1 miLoading sold comps…