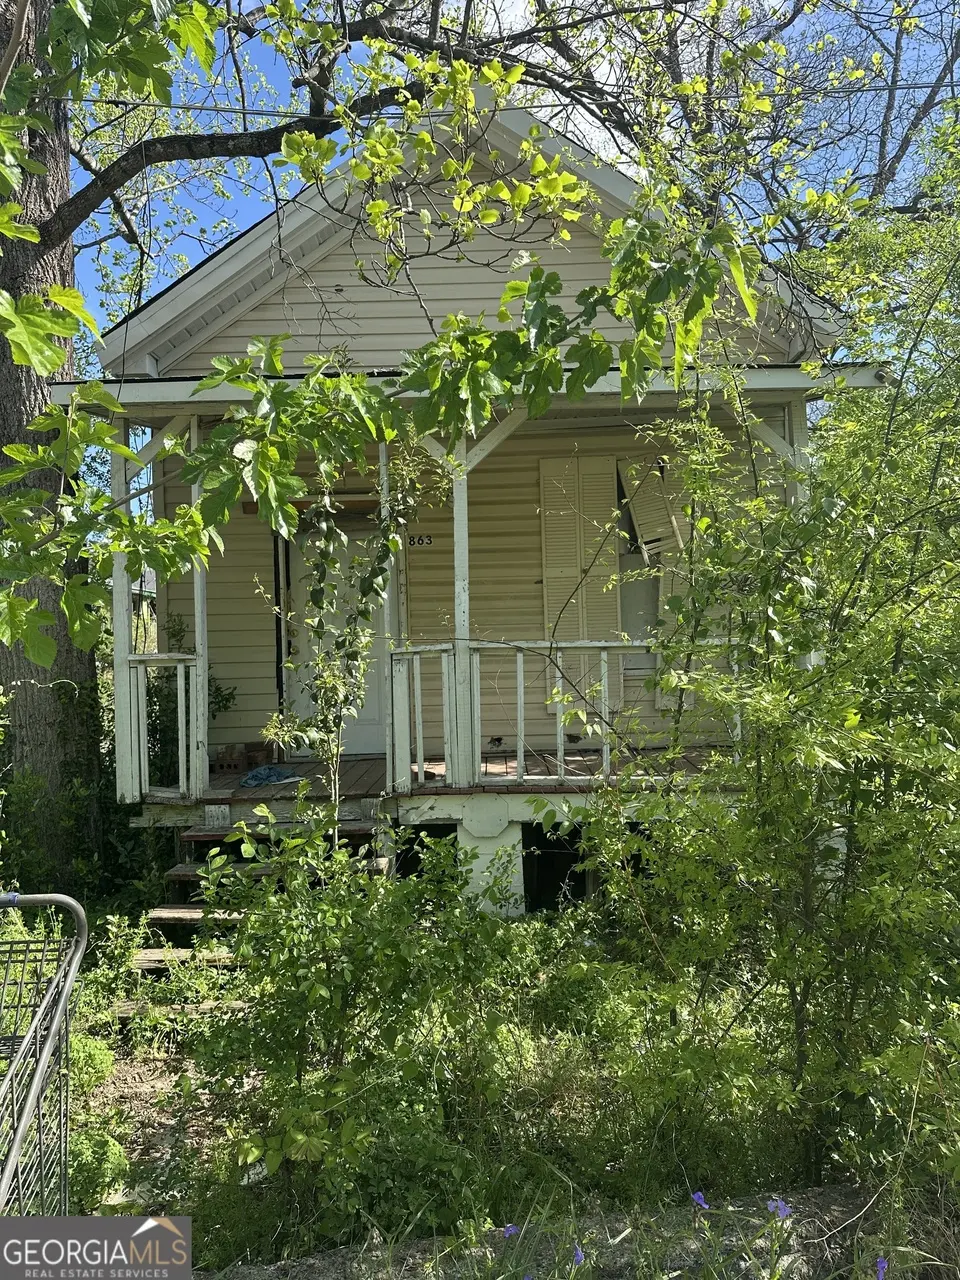
863 Edgewood Ave · Macon-Bibb County, GA
Flood risk 7/10 · Major
- FEMA flood zone
- X (unshaded)
- Chance of flooding over 30 yrs
- 0.76%
- Est. flood insurance / yr
- $507 – $1,088
Fire risk 1/10 · Minimal
- Est. fire insurance / yr
- $963 – $1,789
Heat risk 7/10 · Major
- Hot days now (above 108°F)
- 7 days/yr
- Hot days in 30 yrs
- 17 days/yr
Wind risk 6/10 · Moderate
- Chance of severe wind over 30 yrs
- 65.0%
Air-quality risk 4/10 · Minor
- Unhealthy air days now
- 5 days/yr
- Unhealthy air days in 30 yrs
- 5 days/yr
Risk factors via First Street. Map © Google.
Why this score? — see what drove the D grade
The composite is a weighted blend of 9 inputs, each scored 0–100. Each bar is that input's sub-score; the figure is the points it added to the 100-point composite (weight × sub-score).
- Cash flow +15.0/30.0
- ARV discount +7.5/15.0
- 1% rule +5.0/10.0
- DSCR +5.0/10.0
- Rent growth +3.3/5.0
- Livability +2.5/5.0
- Condition / age +2.5/5.0
- Schools +1.2/10.0
- Appreciation +0.0/10.0
$16,000
🖨 Deal sheet 📄 Offer letter ✓ Due diligence
Listing remarks MLS
Great investment opportunity!!
Key facts
- 5,662 sq ft lot
- Built 1930
- Listed 6 days
Property features AI
Finance
- Other: Property listed as fixer; Corner lot approximately 0.13 acres
- HOA & community: No HOA
Exterior
- Parking: Off-street parking
- Utilities: Public water available; Public sewer (connected); Sewer connected; Water available
- Home design: Single family residence (house); Built in 1930
- Construction: Vinyl siding; Composition roof; Built in 1930; Crawl space foundation
- Exterior features: Corner lot
Interior
- Kitchen: No appliances listed
- Bedrooms: 1 bedroom on the main level
- Flooring: Other flooring
- Bathrooms: 1 full bathroom on the main level
- Heating & cooling: No heating; No cooling
- Interior features: Other interior features; One level (single-story); Crawl space basement; Office
- Laundry & utility: No laundry features listed
Neighborhood map
What this means for you Summary
Snapshot
- This is a 1-bed/1.0-bath single-family listed at $16k.
Deal economics
- At list price, monthly cash flow is $637 ($8k/yr) — positive.
- The deal already cash-flows at list — no discount required.
- Meets the 1% rule at list price ($1k rent vs $16k).
- Cap rate 59.1% vs local median 5.4% in Macon-Bibb County — top-decile yield for the area; either an underpriced asset or a hidden risk that comps aren't pricing in. Stress-test before assuming the spread holds.
Location & tenants
- Location reads: area grade D — affects rentability + tenant quality, not the cash-flow math above.
- Bibb County (urban): math 11% / reading 18% proficiency, ranked #161 of 174 in GA (top 92%) — low school quality limits family demand, transient renter base, plan for 1-2y turnover; 75% free/reduced lunch — lower-income household profile, screen leases tightly.
- Zoned schools: Central High School (math 8% / reading 2%, grade F, #394 of 424 statewide, top 97%, 844 students, 100% FRL) — zoned schools average 100% FRL vs 75% district-wide (25 pts higher); higher-poverty schools than district average — tighter screening recommended.
- Market conditions: Rents rising (+3.1%/yr); 75 active listings in the ZIP; 37 comparable units currently listed for rent nearby; rentals lingering (median 44d on market — plan ~5-8 weeks vacancy on turnover, expect pricing pressure); 57% of comp listings sitting > 30 days — soft ceiling on asking rent; lower-income renter base — watch delinquency; 154 units permitted in Bibb County in 2024 (0 in 5+ unit buildings).
- This rent runs 42% of the median local income ($29k/yr) — at the standard rent-burdened threshold; future hikes will face affordability resistance.
Forward outlook
- Local home prices are declining (-3.0%/yr); year-one equity from $111 of loan paydown is wiped out by about $480 of value loss. Plan a longer hold.
- Bibb County population projected at -12% by 2050 — secular population decline; favor cash flow + early exit over multi-decade hold.
- At projected returns (-3.0% appreciation + 3.1% rent growth), your $4k cash investment doubles in ~1 year — after that, you're playing with house money.
Negotiation context
- Only 6 days on market — expect competitive offers; lowballing is unlikely to land.
- 3 sale attempts since 9y ago with the ask held roughly flat each time — persistent listings suggest the price (not the market) is what's stuck; bring a comps-based counter.
- Current owner paid $11k; list at $16k implies a 51% gain — meaningful room to come down on a strong offer.
Risks & watch-outs
- Watch-outs: flood insurance adds $66/mo; built in 1930 — expect roof / HVAC / electrical / plumbing capex.
- Climate carrying-cost: major flood risk; major wind risk, 65% chance of damaging wind over 30y; extreme-heat days projected 7→17/yr by 2055 (HVAC capex compounding) — expect insurance premiums to compound above CPI over the hold.
Questions for the listing agent
- Built in 1930 — when were the roof, HVAC, electrical panel, plumbing, and water heater last replaced?
- What's the actual annual flood-insurance premium (NFIP or private), and is the property in a SFHA with mandatory coverage?
- Is there a deadline driving the sale (1031 exchange, divorce, estate, relocation)? That informs how much negotiation room exists.
- The area grade is low — what's the realistic commute time and amenity access for the typical tenant pool here? Any planned neighborhood developments (good or bad) we should know about?
- What's the average days-on-market for RENTAL listings here right now (not sales)? A rising rental-DOM trend means longer vacancies and softer asking-rent achievability than the comps imply.
- What's the recent tenant-quality profile in this submarket — average credit score on applications, eviction rate, late-payment / NSF rate, and stable-employment percentage? A property-management company in the area should have these aggregated.
- How much new for-sale + rental construction is in the pipeline within 1–3 miles? Heavy new supply typically softens prices + rents 12–24 months out; constrained supply supports both.
Investment metrics
- 1% rule
- 6.44% ✓
- Cap rate
- 59.05%
- Cash-on-cash
- 188.43%
- DSCR
- 9.38
- GRM
- 1.3
CMA / ARV
No comps found within radius.
Projected returns pro-forma
-3.0% appreciation · 3.11% rent growth · sell at horizon
- IRR
- —
- Equity multiple
- 9.52×
- Total profit
- $38,149
- Equity at exit
- $2,386
- IRR
- —
- Equity multiple
- 20.23×
- Total profit
- $86,159
- Equity at exit
- $1,383
Cash invested: $4,480 (down + closing). Projections, not guarantees.
Landlord ↔ Tenant lean methodology
- Overall (STATE)
- 90 Strongly Landlord-Friendly
- State Georgia
- 90 Strongly Landlord-Friendly · R+3
- County
- — inherits STATE
- City
- — inherits STATE
ZIP-level market 31201
- Rents YoY
- 3.1%
- Active inventory
- 75
- Price-to-rent
- 1.3×
Monthly cashflow live
- Estimated rent
- $1,030 high interval (Pro) →
- Mortgage (P&I)
- −$84
- Tax est. 1.5%
- −$20 /mo · $240/yr
- Insurance
- −$7
- Flood insurance flood zone
- −$66 /mo · $798/yr
- HOA
- −$0
- Vacancy / Maint / Mgmt
- −$216
- Net cashflow
- $637
Break-even live
UW: 25.0% down · 7.5% · 30yr · 1.5% tax · 5.0% vac · 8.0% maint · 8.0% mgmt
Financing live
Cash to close
- Down payment
- $4,000
- Closing costs
- $480
- Reserves months
- —
- Total cash needed
- —
Loan-product check · same deal, 3 products live
Conventional
25% down · 7.5% · 30yr
- Down + closing
- —
- Monthly P&I
- —
- Monthly cashflow
- —
- DSCR
- —
- Eligible?
- —
Personal DTI + credit; lowest rate.
DSCR
20% down · 8.5% · 30yr
- Down + closing
- —
- Monthly P&I
- —
- Monthly cashflow
- —
- DSCR
- —
- Eligible?
- —
No personal income docs; deal must DSCR.
Hard money
10% down · 12.0% · 12mo
- Down + closing
- —
- Monthly P&I
- —
- Monthly cashflow
- —
- DSCR
- —
- Eligible?
- —
Short-term bridge; refi at stabilization.
Rent comps 37 comps
| Address | Beds | Baths | Sqft | Rent | $/sqft | DOM | Units | Dist |
|---|---|---|---|---|---|---|---|---|
| 781 Spring St Unit 1356283P Macon, GA | — | 1.0 | 398 | $1,732 | $4.35 | 21d | 1 | 0.64mi |
| 864 Tattnall St Macon, GA | 2.0 | 1.0 | 640 | $800 | $1.25 | 43d | 1 | 0.70mi |
| 805 Martin Luther King Junior Blvd Apt 13 Macon, GA | 1.0 | 1.0 | 640 | $1,200 | $1.88 | 21d | 1 | 0.73mi |
| 1249 Duncan Ave Unit B Macon, GA | 2.0 | 2.0 | 700 | $1,095 | $1.56 | 43d | 1 | 0.86mi |
| 1874 Moore St Macon, GA | 1.0 | 1.0 | 470 | $799 | $1.70 | 13d | 1 | 0.90mi |
| 1890 Moore St Macon, GA | 1.0 | 1.0 | 470 | $799 | $1.70 | 13d | 1 | 0.90mi |
| 524 2nd St Macon, GA | — | 1.0 | 700 | $945 | $1.35 | 43d | 1 | 0.95mi |
| 618 Poplar St Unit 202 Macon, GA | — | 1.0 | 623 | $1,125 | $1.81 | 21d | 1 | 0.95mi |
| 946 Magnolia St Apt 3 Macon, GA | 1.0 | 1.0 | 489 | $725 | $1.48 | 43d | 1 | 1.01mi |
| 482 Poplar St Macon, GA | 1.0–2.0 | 1.0–2.0 | 850 | $1,195 | $1.41 | 21d | 4 | 1.01mi |
| 470 Poplar St Unit 201 Macon, GA | 1.0 | 1.0 | 700 | $1,295 | $1.85 | 43d | 1 | 1.02mi |
| 928 Magnolia St Macon, GA | 1.0 | 1.0 | 600 | $925 | $1.54 | 43d | 1 | 1.02mi |
| 476 3rd St Macon, GA | 2.0 | 1.0 | 942 | $1,535 | $1.63 | 13d | 8 | 1.05mi |
| 450 3rd St Macon, GA | 1.0 | 1.0 | 700 | $1,300 | $1.86 | 43d | 1 | 1.08mi |
| 363 New St Macon, GA | 1.0 | 1.0 | 475 | $795 | $1.67 | 13d | 1 | 1.11mi |
| 587 Cherry St Unit 6 Macon, GA | 1.0 | 1.0 | 585 | $1,050 | $1.79 | 43d | 1 | 1.11mi |
| 587 Cherry St Unit 3 Macon, GA | 1.0 | 1.0 | 540 | $995 | $1.84 | 43d | 1 | 1.11mi |
| 462 Cherry St Macon, GA | 2.0 | 1.0–2.0 | 988 | $2,224 | $2.25 | 13d | 25 | 1.12mi |
| 876 Mulberry St Macon, GA | 1.0 | 1.0 | 520 | $850 | $1.63 | 43d | 2 | 1.15mi |
| 347 College St Macon, GA | 2.0 | 1.0–2.0 | 725 | $1,725 | $2.38 | 13d | 4 | 1.16mi |
| 331 College St Macon, GA | 1.0 | 1.0 | 610 | $1,000 | $1.64 | 43d | 1 | 1.18mi |
| 1408 2nd Ave Macon, GA | 2.0 | 1.5 | 600 | $1,095 | $1.82 | 43d | 1 | 1.18mi |
| 582 Mulberry St Unit 306 Macon, GA | 1.0 | 1.0 | 678 | $1,475 | $2.18 | 21d | 1 | 1.18mi |
| 582 Mulberry St Unit 302 Macon, GA | 1.0 | 1.0 | 641 | $1,495 | $2.33 | 21d | 1 | 1.18mi |
| 582 Mulberry St Unit 308 Macon, GA | — | 1.0 | 549 | $1,185 | $2.16 | 43d | 1 | 1.18mi |
| 2020 Vineville Ave Apt 31 Macon, GA | 1.0 | 1.0 | 550 | $800 | $1.45 | 13d | 1 | 1.19mi |
| 883 Mulberry St Unit C Macon, GA | 1.0 | 1.0 | 601 | $895 | $1.49 | 43d | 1 | 1.20mi |
| 883 Mulberry St Unit B Macon, GA | 1.0 | 1.0 | 443 | $750 | $1.69 | 43d | 1 | 1.20mi |
| 855 Mulberry St Macon, GA | 1.0 | 1.0 | 590 | $850 | $1.44 | 43d | 1 | 1.21mi |
| 614 Cleveland St Macon, GA | 1.0 | 1.0 | 650 | $800 | $1.23 | 43d | 1 | 1.23mi |
| 2349 Mason St Macon, GA | 1.0 | 1.0 | 552 | $625 | $1.13 | 43d | 1 | 1.24mi |
| 2056 Vineville Ave Unit 25 Macon, GA | 1.0 | 1.0 | 621 | $825 | $1.33 | 13d | 1 | 1.26mi |
| 340 6th St Macon, GA | — | 1.0 | 500 | $1,250 | $2.50 | 21d | 1 | 1.31mi |
| 2585 Napier Ave Unit B Macon, GA | 2.0 | 2.0 | 644 | $850 | $1.32 | 21d | 1 | 1.33mi |
| 2585 Napier Ave Unit C Macon, GA | — | 1.0 | 454 | $650 | $1.43 | 43d | 1 | 1.33mi |
| 260 Ryals Ave Macon, GA | 2.0 | 1.0 | 690 | $875 | $1.27 | 43d | 1 | 1.35mi |
| 171 Orange St Unit 1 Macon, GA | 1.0 | 2.0 | 612 | $840 | $1.37 | 43d | 1 | 1.38mi |
Listing history 10 events
-
2026-04-14status Under Contract
-
2026-04-11status Back On Market
-
2026-04-10status Under Contract
-
2026-04-06$16,000 New
-
2017-08-31soldstatus $10,575 30-char remark
Show marketing remark (30 chars)
Great investment opportunity!!
-
2017-07-19$12,000 30-char remark
Show marketing remark (30 chars)
Great investment opportunity!!
-
2007-02-12soldstatus $12,000
-
2007-02-12soldstatus $25,000
-
2006-03-08soldstatus $30,000
-
2002-10-28soldstatus $6,000
ⓘ Source: listings_history table (triggers on properties + properties_extension) + one-shot
backfill from property_details.listing_events for pre-trigger history.
Climate risk First Street
- Flood 7/10 Severe FEMA zone X (unshaded) · 76% chance over 30 yrs
- Wildfire 1/10 Low
- Heat 7/10 Severe 7 d/yr ≥108°F today · 17 d/yr by 30 yrs out
- Wind 6/10 Major 65% chance of damaging wind over 30 yrs
- Air quality 4/10 Moderate 5 unhealthy d/yr today · 5 by 30 yrs out
Nearby sold comps map
Loading sold comps map…
Walkable amenities ~0.75 mi
Loading nearby amenities…
Taxation est. · year 1
- Rental income
- $12,365
- − Mortgage interest
- −$896
- − Property taxes
- −$240
- − Insurance
- −$878
- − Repairs & maintenance
- −$989
- − Management
- −$989
- − Depreciation
- −$465
- Taxable income
- $7,907
- Est. tax owed @ 24.0%
- −$1,898
- After-tax cash flow
- $5,746/yr
For passive investors: Depreciation is non-cash, so a rental often shows a tax loss while cash-flowing — sheltering income. Rental losses are passive: they offset passive income freely, and up to $25,000/yr can offset ordinary (W-2) income if you actively participate and your MAGI is under $100k (phasing out to $0 by $150k); unused losses carry forward. On sale, claimed depreciation is recaptured at up to 25%, and gains may owe capital-gains tax (a 1031 exchange can defer both). Figures are a year-1 estimate at your 24.0% rate — not tax advice; consult a CPA.
Schools (NCES district)
- District
- Bibb County
- NCES district ID
- 1300420
- Math proficiency
- 11% ▼ -14.00%
- Reading proficiency
- 18% ▼ -11.00%
- Median HH income
- $37,426
- Composite
- 12.13/100
- National rank
- #9654
- State rank
- #161 of 174 in GA
Livability — Macon-Bibb County
No livability data for this city. (Only ~50 U.S. cities are tracked.)
Census & demographics
- Census place
- Macon-Bibb County, GA
- County
- Bibb County · 164,332 people
- City population
- 143,186
- Metro
- Macon-Bibb County, GA
- Population (ZIP)
- 7,891
- Household income
- $29,420
- Rent vs Own
- Severe rent burden
- 1124.0
Population outlook (Bibb County) Hauer SSP2
- Today (2025)
- 148,772 people
- By 2030
- 145,904 · -1.9%
- By 2040
- 139,404 · -6.3%
- By 2050
- 131,603 · -11.5%
- By 2075
- 111,050 · -25.4%
- By 2100
- 83,346 · -44.0%
Race, ethnicity, and origin ACS 2023
- Neighborhood character
- Diverse neighborhood (Simpson 0.55)
- Race & ethnicity
- Black 59% White 31% Hispanic / Latino 6% Two or more races 5% Asian 2%
- Hispanic origin (detail)
- Mexican 3% Puerto Rican 1%
- Common ancestry
- Slovak 2% Italian 1% Lithuanian 1%
- Foreign-born
- 4% · Canada
- Languages at home
- 92% English-only · Spanish 5% Other Indo-European 2% Chinese 1%
Political lean MEDSL · Bibb
- 2024 margin
- Strong D (+22.4) · D 61.0% · R 38.5%
- 2008→2024 swing
- +4.4pp toward D · 2008: 18.0pp · 2024: 22.4pp
- All cycles
- 2024: D+22.4 2020: D+23.8 2016: D+20.2 2012: D+20.0 2008: D+18.0
Not yet ingested
- Civics
- —
Market trends
- HPI YoY
- ▼ -142.32%
- Current HPI
- 100.04
- Rent YoY
- ▲ 3.11%
- Metro
- Macon-Bibb County, GA
- State GDP YoY
- ▲ 2.66%
- F500 in state
- 28
Industry mix (Fortune 500 HQ in GA)
| Industry | F500 HQs | Revenue |
|---|---|---|
| Paper / Packaging | 2 | $29B |
|
||
| Retail | 1 | $160B |
|
||
| Transportation / Logistics | 1 | $91B |
|
||
| Airlines | 1 | $62B |
|
||
| Consumer Goods | 1 | $47B |
|
||
| Utilities | 1 | $25B |
|
||
Price history
+166.7% since first listed10 events — show timeline
- 2026-04-14 Pending — GAMLS
- 2026-04-11 Relisted — GAMLS
- 2026-04-10 Pending — GAMLS
- 2026-04-06 Listed $16,000 GAMLS
- 2017-08-31 Sold (MLS) $10,575 CGMLS
- 2017-07-19 Listed $12,000 CGMLS
- 2007-02-12 Sold (Public Records) $25,000 Public Records
- 2007-02-12 Sold (Public Records) $12,000 Public Records
- 2006-03-08 Sold (Public Records) $30,000 Public Records
- 2002-10-28 Sold (Public Records) $6,000 Public Records
Property tax history
+24.4%/yrLatest (2025): $1,037 · -8.1% YoY. Source: county tax records.
Cash-flow waterfall
monthlySold comps — $/sqft
last 12 mo · ≤1 miLoading sold comps…