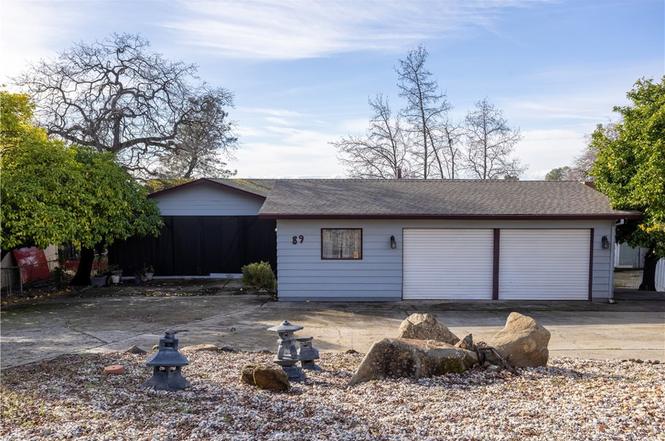
89 Greenbriar Dr · Kelly Ridge, CA
Flood risk 1/10 · Minimal
- FEMA flood zone
- X (unshaded)
- Chance of flooding over 30 yrs
- 0.0%
- Est. flood insurance / yr
- $507 – $1,088
Fire risk 10/10 · Severe
- Est. fire insurance / yr
- $659 – $1,223
Heat risk 6/10 · Moderate
- Hot days now (above 102°F)
- 7 days/yr
- Hot days in 30 yrs
- 16 days/yr
Wind risk 1/10 · Minimal
- Chance of severe wind over 30 yrs
- —
Air-quality risk 10/10 · Severe
- Unhealthy air days now
- 29 days/yr
- Unhealthy air days in 30 yrs
- 36 days/yr
Risk factors via First Street. Map © Google.
Why this score? — see what drove the C- grade
The composite is a weighted blend of 9 inputs, each scored 0–100. Each bar is that input's sub-score; the figure is the points it added to the 100-point composite (weight × sub-score).
- Cash flow +20.7/30.0
- ARV discount +10.9/15.0
- DSCR +6.6/10.0
- 1% rule +4.8/10.0
- Livability +2.9/5.0
- Schools +2.8/10.0
- Rent growth +2.5/5.0
- Condition / age +2.5/5.0
- Appreciation +0.0/10.0
$169,000
🖨 Deal sheet 📄 Offer letter ✓ Due diligence
Listing remarks MLS
Very well maintained manufactured home in Kelly Ridge!
Key facts
- Spacious kitchen
- Island
- Valley views
Tags
Property features AI
Finance
- HOA & community: Part of an association (KREOA) with onsite property management; Association fee $30 annually; Community offers watersports, golf course access, hiking, fishing, and a lake
Exterior
- Parking: 2-car garage; Driveway parking (total 2 spaces)
- Utilities: Public sewer; District/Public water
- Home design: Manufactured house; Single-story; Entry on level 1
- Construction: Certified 433a foundation
- Exterior features: Covered patio/porch and deck; Front yard; Has view; No pool
Interior
- Kitchen: Kitchen with island
- Bedrooms: 2 main-level bedrooms; Primary suite
- Bathrooms: 2 full bathrooms with bathtub and shower
- Heating & cooling: Central heating (central furnace); Central cooling
- Interior features: Living room with attached deck; One-level living; Front door entry
- Laundry & utility: Inside laundry in a dedicated room
Neighborhood map
What this means for you Summary
Snapshot
- This is a 2-bed/2.0-bath manufactured listed at $169k.
Deal economics
- At list price, monthly cash flow is $229 ($3k/yr) — positive.
- The deal already cash-flows at list — no discount required.
- To meet the 1% rule (rent ≥ 1% of price), the offer needs to be $166k (1.7% below list).
- Recommended offer: $149k (12.0% below list) — sets the bar for market timing.
- Cap rate 7.9% vs local median 3.9% in Kelly Ridge — top-decile yield for the area; either an underpriced asset or a hidden risk that comps aren't pricing in. Stress-test before assuming the spread holds.
Location & tenants
- Location reads 57/100 on livability (#765 in CA) — a working-class tenant base; expect higher turnover. Strengths: housing A, crime B+; Watch: schools D-, amenities F, commute F.
- Oroville Union High (town): math 19% / reading 49% proficiency, ranked #300 of 517 in CA (top 58%) — families likely to look elsewhere, expect single-tenant / working-renter base with shorter leases.
- Market conditions: 372 active listings in the ZIP; 946 units permitted in Butte County in 2024 (254 in 5+ unit buildings).
- This rent runs 30% of the median local income ($66k/yr) — at the standard rent-burdened threshold; future hikes will face affordability resistance.
Forward outlook
- Local home prices are declining (-3.0%/yr); year-one equity from $1k of loan paydown is wiped out by about $5k of value loss. Plan a longer hold.
- Butte County population projected at +10% by 2050 — modest demand growth; plan on rents tracking national, not racing it.
Negotiation context
- It's been on market 146 days — a 12% lower offer ($149k) is reasonable based on typical stale-listing flexibility.
- 4 sale attempts since 16y ago; this cycle's ask has dropped $10k (6%) from the opening price — seller is motivated, your offer sets the floor, not the list.
- Current owner paid $62k; list at $169k implies a 173% gain — meaningful room to come down on a strong offer.
Risks & watch-outs
- Climate carrying-cost: severe wildfire risk; extreme-heat days projected 7→16/yr by 2055 (HVAC capex compounding) — expect insurance premiums to compound above CPI over the hold.
Questions for the listing agent
- It's been on market 146 days. Have you received any prior offers? Is the seller open to a 12% concession, seller financing, or rate buy-down credit?
- Built in 1975 — when were the roof, HVAC, electrical panel, plumbing, and water heater last replaced?
- What does the HOA fee cover, when was the last increase, and are there any pending special assessments or reserve-fund shortfalls?
- Why hasn't it sold? Are there any deal-killer items the seller is aware of (foundation, flood, title, zoning, code violations)?
- Is there a deadline driving the sale (1031 exchange, divorce, estate, relocation)? That informs how much negotiation room exists.
- Schools are D-rated, which usually means shorter tenancies and higher turnover. Who's the typical renter profile here, and what's been the actual vacancy rate?
- What's the average days-on-market for RENTAL listings here right now (not sales)? A rising rental-DOM trend means longer vacancies and softer asking-rent achievability than the comps imply.
- What's the recent tenant-quality profile in this submarket — average credit score on applications, eviction rate, late-payment / NSF rate, and stable-employment percentage? A property-management company in the area should have these aggregated.
- How much new for-sale + rental construction is in the pipeline within 1–3 miles? Heavy new supply typically softens prices + rents 12–24 months out; constrained supply supports both.
Investment metrics
- 1% rule
- 0.98% ✗
- Cap rate
- 7.92%
- Cash-on-cash
- 5.80%
- DSCR
- 1.26
- GRM
- 8.5
CMA / ARV
- ARV (on-the-fly)
- $182,880
- Comps found
- 12
Show comp detail 12 sales within ~0.75 mi
| Address | Dist | Beds/Ba | Sqft | Sold | Price | $/sf | Match |
|---|---|---|---|---|---|---|---|
| 18 Oak Hl | 0.12mi | 2/2.0 | 1,440 (0%) | 1mo | $205,000 | $142 | 94 |
| 7 Blue Oak Ct | 0.05mi | 2/2.0 | 1,464 (+2%) | 4mo | $120,000 | $82 | 92 |
| 8 La Foret Dr | 0.18mi | 2/2.0 | 1,440 (0%) | 1mo | $183,000 | $127 | 90 |
| 39 La Foret Dr | 0.15mi | 3/2.0 (+1) | 1,440 (0%) | 3mo | $179,000 | $124 | 85 |
| 12 Hanging Tree Ct | 0.12mi | 2/2.0 | 1,344 (-7%) | 4mo | $267,000 | $199 | 80 |
| 15 Chaparral Dr | 0.35mi | 2/2.0 | 1,440 (0%) | 5mo | $135,000 | $94 | 80 |
| 511 Silver Leaf Dr | 0.37mi | 2/2.0 | 1,440 (0%) | 5mo | $160,000 | $111 | 79 |
| 422 Lodgeview Dr | 0.35mi | 2/2.0 | 1,344 (-7%) | 2mo | $105,000 | $78 | 71 |
| 5341 Treasure Hl | 0.63mi | 2/2.0 | 1,440 (0%) | 1mo | $250,000 | $174 | 70 |
| 71 Greenbrier Dr | 0.15mi | 2/2.0 | 1,248 (-13%) | 2mo | $157,000 | $126 | 69 |
| 26 Chaparral Dr | 0.38mi | 2/2.0 | 1,536 (+7%) | 3mo | $200,000 | $130 | 68 |
| 5 Coho Ct | 0.46mi | 2/2.0 | 1,344 (-7%) | 0mo | $219,900 | $164 | 67 |
Match score weights: distance 35% · size 25% · config 20% · recency 20%. Top-matched comps best support the ARV.
Projected returns pro-forma
-3.0% appreciation · 3.0% rent growth · sell at horizon
- IRR
- -7.4%
- Equity multiple
- 0.73×
- Total profit
- $-12,849
- Equity at exit
- $25,198
- IRR
- 2.2%
- Equity multiple
- 1.16×
- Total profit
- $7,455
- Equity at exit
- $14,612
Cash invested: $47,320 (down + closing). Projections, not guarantees.
Landlord ↔ Tenant lean methodology
- Overall (STATE)
- 18 Strongly Tenant-Friendly
- State California
- 18 Strongly Tenant-Friendly · D+13
- County
- — inherits STATE
- City
- — inherits STATE
ZIP-level market 95966
- Active inventory
- 372
- Price-to-rent
- 8.5×
Monthly cashflow live
- Estimated rent
- $1,662 medium interval (Pro) →
- Mortgage (P&I)
- −$886
- Tax from tax record
- −$124 /mo · $1,491/yr
- Insurance
- −$70
- HOA
- −$3
- Vacancy / Maint / Mgmt
- −$349
- Net cashflow
- $229
Break-even live
UW: 25.0% down · 7.5% · 30yr · 1.5% tax · 5.0% vac · 8.0% maint · 8.0% mgmt
Financing live
Cash to close
- Down payment
- $42,250
- Closing costs
- $5,070
- Reserves months
- —
- Total cash needed
- —
Loan-product check · same deal, 3 products live
Conventional
25% down · 7.5% · 30yr
- Down + closing
- —
- Monthly P&I
- —
- Monthly cashflow
- —
- DSCR
- —
- Eligible?
- —
Personal DTI + credit; lowest rate.
DSCR
20% down · 8.5% · 30yr
- Down + closing
- —
- Monthly P&I
- —
- Monthly cashflow
- —
- DSCR
- —
- Eligible?
- —
No personal income docs; deal must DSCR.
Hard money
10% down · 12.0% · 12mo
- Down + closing
- —
- Monthly P&I
- —
- Monthly cashflow
- —
- DSCR
- —
- Eligible?
- —
Short-term bridge; refi at stabilization.
HOA detail
- Monthly dues
- $3 · $36/yr
Listing history 23 events
-
2026-06-19days on market $169,000 Active 146 DOM
-
2026-06-18days on market $169,000 Active 145 DOM
-
2026-06-17days on market $169,000 Active 144 DOM
-
2026-06-16days on market $169,000 Active 143 DOM
-
2026-06-15days on market $169,000 Active 142 DOM
-
2026-06-14days on market $169,000 Active 140 DOM
-
2026-06-13days on market $169,000 Active 139 DOM
-
2026-06-10days on market $169,000 Active 137 DOM
-
2026-06-09days on market $169,000 Active 136 DOM
-
2026-06-08days on market $169,000 Active 135 DOM
-
2026-06-07days on market $169,000 Active 134 DOM
-
2026-06-03days on market $169,000 Active 130 DOM
-
2026-06-02days on market $169,000 Active 129 DOM
-
2026-06-01days on market $169,000 Active 128 DOM
-
2026-05-31days on market $169,000 Active 127 DOM
-
2026-05-30days on market $169,000 Active 126 DOM
-
2026-04-21status Active
-
2026-03-21status Active
-
2026-02-06price $169,000
-
2026-01-04$179,000 Active
-
2010-11-10soldstatus $62,000 54-char remark
Show marketing remark (54 chars)
Very well maintained manufactured home in Kelly Ridge!
-
2010-07-20$64,900 54-char remark
Show marketing remark (54 chars)
Very well maintained manufactured home in Kelly Ridge!
-
2002-12-06soldstatus $132,000
ⓘ Source: listings_history table (triggers on properties + properties_extension) + one-shot
backfill from property_details.listing_events for pre-trigger history.
Tax reassessment forecast CA · Resets to sale price
- Current annual tax
- $1,491 · $124/mo
- Projected year-2 tax
- $1,491 · $124/mo
- Expected delta
- $0/yr ($0/mo · 0.0%)
ⓘ Screening estimate from a state-policy table — verify with the county assessor before closing.
Climate risk First Street
- Flood 1/10 Low FEMA zone X (unshaded) · 0% chance over 30 yrs
- Wildfire 10/10 Extreme
- Heat 6/10 Major 7 d/yr ≥102°F today · 16 d/yr by 30 yrs out
- Wind 1/10 Low
- Air quality 10/10 Extreme 29 unhealthy d/yr today · 36 by 30 yrs out
Nearby sold comps map
Loading sold comps map…
Walkable amenities ~0.75 mi
Loading nearby amenities…
Taxation est. · year 1
- Rental income
- $19,938
- − Mortgage interest
- −$9,467
- − Property taxes
- −$1,491
- − Insurance
- −$845
- − Repairs & maintenance
- −$1,595
- − Management
- −$1,595
- − HOA
- −$36
- − Depreciation
- −$4,916
- Taxable loss
- −$7
- Est. tax savings @ 24.0%
- +$2
- After-tax cash flow
- $2,746/yr
For passive investors: Depreciation is non-cash, so a rental often shows a tax loss while cash-flowing — sheltering income. Rental losses are passive: they offset passive income freely, and up to $25,000/yr can offset ordinary (W-2) income if you actively participate and your MAGI is under $100k (phasing out to $0 by $150k); unused losses carry forward. On sale, claimed depreciation is recaptured at up to 25%, and gains may owe capital-gains tax (a 1031 exchange can defer both). Figures are a year-1 estimate at your 24.0% rate — not tax advice; consult a CPA.
Schools (NCES district)
- District
- Oroville Union High
- NCES district ID
- 0629130
- Math proficiency
- 19% ▼ -2.00%
- Reading proficiency
- 49% ▼ -4.00%
- Median HH income
- $38,085
- Composite
- 28.26/100
- National rank
- #6794
- State rank
- #300 of 517 in CA
Livability — Kelly Ridge
- Score
- 57/100
- State rank
- #765
- US rank
- #22221
Category grades
Schools grade is shown separately in the Schools card above.
Census & demographics
- Census place
- Kelly Ridge, CA
- County
- Butte County · 175,030 people
- Metro
- Chico, CA
- Population (ZIP)
- 28,503
- Household income
- $65,586
- Rent vs Own
- Severe rent burden
- 807.0
Population outlook (Butte County) Hauer SSP2
- Today (2025)
- 237,527 people
- By 2030
- 243,804 · +2.6%
- By 2040
- 253,899 · +6.9%
- By 2050
- 262,561 · +10.5%
- By 2075
- 283,709 · +19.4%
- By 2100
- 282,689 · +19.0%
Race, ethnicity, and origin ACS 2023
- Neighborhood character
- Predominantly White (67%)
- Race & ethnicity
- White 67% Hispanic / Latino 18% Two or more races 14% Asian 6% Native American 2% Black 2%
- Hispanic origin (detail)
- Mexican 16%
- Common ancestry
- Lithuanian 3% Slovak 3% Portuguese 2%
- Foreign-born
- 6% · Canada
- Languages at home
- 88% English-only · Spanish 7% Other Asian/Pacific 3% Russian/Polish/Slavic 1%
Political lean MEDSL · Butte
- 2024 margin
- Toss-up / Even · D 46.8% · R 49.9% · Other 3.3%
- 2008→2024 swing
- -5.5pp toward R · 2008: 2.4pp · 2024: -3.1pp
- All cycles
- 2024: R+3.1 2020: D+1.7 2016: R+4.0 2012: R+3.9 2008: D+2.4
Not yet ingested
- Civics
- —
Market trends
- HPI YoY
- ▼ -284.58%
- Current HPI
- 267.1415
- Rent YoY
- —
- Metro
- Chico, CA
- State GDP YoY
- ▲ 3.21%
- F500 in state
- 116
Industry mix (Fortune 500 HQ in CA)
| Industry | F500 HQs | Revenue |
|---|---|---|
| Technology | 27 | $1,492B |
|
||
| Financial Services | 3 | $174B |
|
||
| Retail | 3 | $44B |
|
||
| Insurance | 3 | $26B |
|
||
| Media / Entertainment | 2 | $115B |
|
||
| Pharmaceuticals / Biotech | 2 | $62B |
|
||
Price history
+28.0% since first listed7 events — show timeline
- 2026-04-21 Relisted — CRMLS
- 2026-03-21 Relisted — CRMLS
- 2026-02-06 Price Changed $169,000 CRMLS
- 2026-01-04 Listed $179,000 CRMLS
- 2010-11-10 Sold (MLS) $62,000 CRMLS
- 2010-07-20 Listed $64,900 CRMLS
- 2002-12-06 Sold (Public Records) $132,000 Public Records
Property tax history
+4.1%/yrLatest (2025): $1,491 · +1.1% YoY. Source: county tax records.
Cash-flow waterfall
monthlySold comps — $/sqft
last 12 mo · ≤1 miLoading sold comps…