 Duplex
4105 32nd Ave Unit 3220,3210 · Gifford, FL
Flood risk No data
- FEMA flood zone
- —
- Chance of flooding over 30 yrs
- —
- Est. flood insurance / yr
- —
Fire risk No data
- Est. fire insurance / yr
- —
Heat risk No data
- Hot days now (above threshold)
- —
- Hot days in 30 yrs
- —
Wind risk No data
- Chance of severe wind over 30 yrs
- —
Air-quality risk No data
- Unhealthy air days now
- —
- Unhealthy air days in 30 yrs
- —
Risk factors via First Street. Map © Google.
Why this score? — see what drove the C grade
The composite is a weighted blend of 9 inputs, each scored 0–100. Each bar is that input's sub-score; the figure is the points it added to the 100-point composite (weight × sub-score).
- Cash flow +25.5/30.0
- DSCR +8.4/10.0
- ARV discount +7.5/15.0
- 1% rule +6.7/10.0
- Schools +4.2/10.0
- Livability +3.4/5.0
- Rent growth +2.2/5.0
- Condition / age +1.0/5.0
- Appreciation +0.0/10.0
$500,000
🖨 Deal sheet 📄 Offer letter ✓ Due diligence
Multi-family units
County records classify this as Multi-Family (2-4 Unit). Listing-text estimate: 2 units. confirmed
Listing remarks MLS
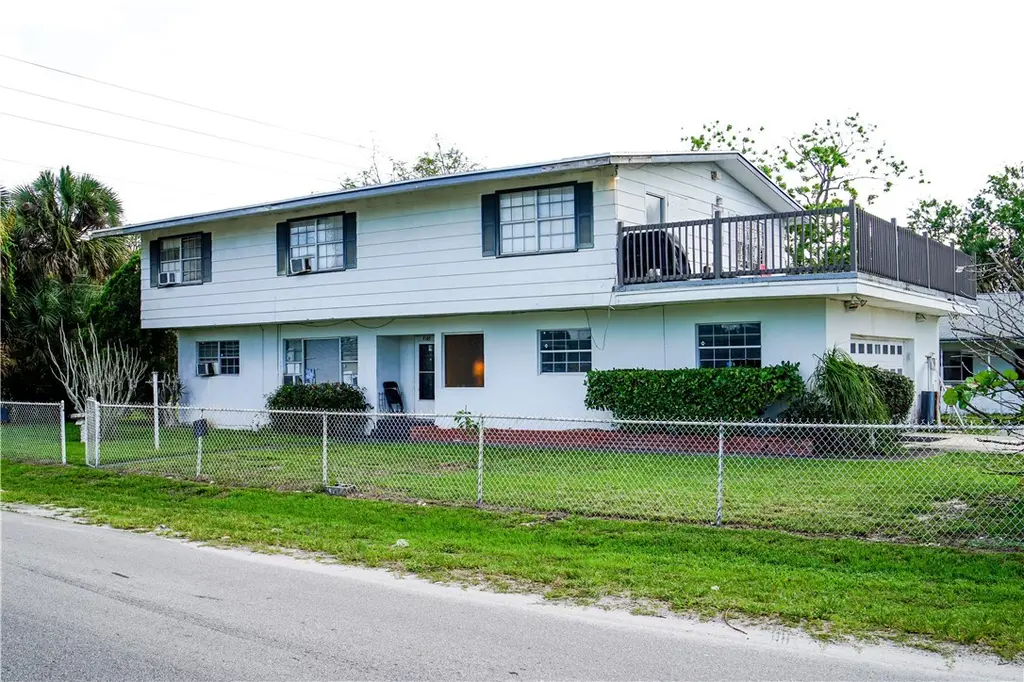
Rare & unique multi family property w/ 4 CBS units. Dwellings are as follows: A. 2248 SqFt 4 bed 3.5 bath 2 car garage pool home B. 1200 SqFt Duplex w/ 2 bed & 1 bath per side C. 600 SqFt Cottage w/ 2 bed 1 bath. Duplex needs TLC. Great potential as a multi generational family compound, possibly a residential rehab home or an excellent income producing investment property.
Key facts
- 0.43 acre lot
- 2 garage spots
- Built 1950
Neighborhood map
What this means for you Summary
Snapshot
- This is a 2 × 5-bed/?-bath units multifamily listed at $500k. Condition is rated poor.
Deal economics
- At list price, monthly cash flow is $1k ($14k/yr) — positive. Per door: $581/mo.
- The deal already cash-flows at list — no discount required.
- Meets the 1% rule at list price ($6k rent vs $500k).
- Recommended offer: $492k (1.5% below list) — sets the bar for market timing.
- Cap rate 9.1% vs local median 3.0% in Gifford — top-decile yield for the area; either an underpriced asset or a hidden risk that comps aren't pricing in. Stress-test before assuming the spread holds.
Location & tenants
- Location reads 68/100 on livability (#538 in FL) — a middle-class / working-renter tenant base. Strengths: commute A+, cost of living A+, health & safety A; Watch: schools D+, amenities F, employment F.
- Indian River (other): math 48% / reading 52% proficiency, ranked #35 of 73 in FL (top 48%) — acceptable for families but not a draw, mixed tenant base, ~2y average lease.
- Market conditions: Rents soft (-1.2%/yr); 612 active listings in the ZIP; solid renter incomes; 564 units permitted in Indian River County in 2024 (281 in 5+ unit buildings).
- At $5,844/mo this rent would consume 90% of the median local household income ($78k/yr) (locally 674% of renters already pay >50% of income on rent) — very limited rent-growth headroom before tenants either downsize or default.
Forward outlook
- Local home prices are declining (-3.0%/yr); year-one equity from $3k of loan paydown is wiped out by about $15k of value loss. Plan a longer hold.
- Indian River County population projected at +18% by 2050 — long-run rental-demand tailwind backs the buy-and-hold thesis.
Negotiation context
- It's been on market 16 days — a 2% lower offer ($492k) is reasonable based on typical stale-listing flexibility.
- 3 sale attempts since 7y ago with the ask held roughly flat each time — persistent listings suggest the price (not the market) is what's stuck; bring a comps-based counter.
- Current owner paid $220k; list at $500k implies a 127% gain — meaningful room to come down on a strong offer.
Risks & watch-outs
- Watch-outs: built in 1950 — expect roof / HVAC / electrical / plumbing capex.
Questions for the listing agent
- Can we see the unit-by-unit rent roll, current vacancy, and any below-market leases? What's the average tenancy length?
- What capital expenditures (roof, boiler, parking lot, exteriors) have been made in the last 5 years, and what's planned in the next 2?
- Have any recent inspections been done? Can we get a copy of the seller's disclosures and any deferred-maintenance estimates?
- Built in 1950 — when were the roof, HVAC, electrical panel, plumbing, and water heater last replaced?
- Is there a deadline driving the sale (1031 exchange, divorce, estate, relocation)? That informs how much negotiation room exists.
- Schools are D-rated, which usually means shorter tenancies and higher turnover. Who's the typical renter profile here, and what's been the actual vacancy rate?
- What's the average days-on-market for RENTAL listings here right now (not sales)? A rising rental-DOM trend means longer vacancies and softer asking-rent achievability than the comps imply.
- What's the recent tenant-quality profile in this submarket — average credit score on applications, eviction rate, late-payment / NSF rate, and stable-employment percentage? A property-management company in the area should have these aggregated.
- How much new apartment / multifamily construction is in the pipeline within 1–3 miles? Heavy new supply (>2% of stock underway) typically softens rents 12–24 months out; light construction supports rent growth.
Investment metrics
- 1% rule
- 1.17% ✓
- Cap rate
- 9.08%
- Cash-on-cash
- 9.95%
- DSCR
- 1.44
- GRM
- 7.1
CMA / ARV
No comps found within radius.
Projected returns pro-forma
-3.0% appreciation · 0.0% rent growth · sell at horizon
- IRR
- -4.8%
- Equity multiple
- 0.83×
- Total profit
- $-24,091
- Equity at exit
- $74,552
- IRR
- 1.0%
- Equity multiple
- 1.06×
- Total profit
- $8,439
- Equity at exit
- $43,231
Cash invested: $140,000 (down + closing). Projections, not guarantees.
Landlord ↔ Tenant lean methodology
- Overall (STATE)
- 87 Strongly Landlord-Friendly
- State Florida
- 87 Strongly Landlord-Friendly · R+3
- County
- — inherits STATE
- City
- — inherits STATE
ZIP-level market 32967
- Home prices YoY
- -24.4%
- Rents YoY
- -1.2%
- Active inventory
- 612
- Price-to-rent
- 14.3×
Monthly cashflow live
- Estimated rent
- $5,844 medium interval (Pro) →
- Mortgage (P&I)
- −$2,622
- Tax est. 1.5%
- −$625 /mo · $7,500/yr
- Insurance
- −$208
- HOA
- −$0
- Vacancy / Maint / Mgmt
- −$1,227
- Net cashflow
- $1,161
Break-even live
2-unit breakdown (identical units grouped — click to expand)
| Units | Beds | Baths | Est. rent |
|---|---|---|---|
| 2× units | 5 | — | $5,844 |
| #1 | 5 | — | $2,922 |
| #2 | 5 | — | $2,922 |
| Total (2 units) | $5,844 | ||
UW: 25.0% down · 7.5% · 30yr · 1.5% tax · 5.0% vac · 8.0% maint · 8.0% mgmt
Financing live
Cash to close
- Down payment
- $125,000
- Closing costs
- $15,000
- Reserves months
- —
- Total cash needed
- —
Loan-product check · same deal, 3 products live
Conventional
25% down · 7.5% · 30yr
- Down + closing
- —
- Monthly P&I
- —
- Monthly cashflow
- —
- DSCR
- —
- Eligible?
- —
Personal DTI + credit; lowest rate.
DSCR
20% down · 8.5% · 30yr
- Down + closing
- —
- Monthly P&I
- —
- Monthly cashflow
- —
- DSCR
- —
- Eligible?
- —
No personal income docs; deal must DSCR.
Hard money
10% down · 12.0% · 12mo
- Down + closing
- —
- Monthly P&I
- —
- Monthly cashflow
- —
- DSCR
- —
- Eligible?
- —
Short-term bridge; refi at stabilization.
Listing history 12 events
-
2026-06-01days on market $500,000 Coming Soon 16 DOM
-
2026-05-31days on market $500,000 Coming Soon 15 DOM
-
2026-05-30days on market $500,000 Coming Soon 14 DOM
-
2026-05-16historical $500,000
-
2023-02-21price $490,000
-
2023-02-10$495,000 Active
-
2023-02-06soldstatus $220,000 Closed 387-char remark
Show marketing remark (387 chars)
Rare & unique multi family property w/ 4 CBS units. Dwellings are as follows: A. 2248 SqFt 4 bed 3.5 bath 2 car garage pool home B. 1200 SqFt Duplex w/ 2 bed & 1 bath per side C. 600 SqFt Cottage w/ 2 bed 1 bath. Duplex needs TLC. Great potential as a multi generational family compound, possibly a residential rehab home or an excellent income producing investment property.
-
2022-09-25status Pending 387-char remark
Show marketing remark (387 chars)
Rare & unique multi family property w/ 4 CBS units. Dwellings are as follows: A. 2248 SqFt 4 bed 3.5 bath 2 car garage pool home B. 1200 SqFt Duplex w/ 2 bed & 1 bath per side C. 600 SqFt Cottage w/ 2 bed 1 bath. Duplex needs TLC. Great potential as a multi generational family compound, possibly a residential rehab home or an excellent income producing investment property.
-
2022-09-22$220,000 Active 387-char remark
Show marketing remark (387 chars)
Rare & unique multi family property w/ 4 CBS units. Dwellings are as follows: A. 2248 SqFt 4 bed 3.5 bath 2 car garage pool home B. 1200 SqFt Duplex w/ 2 bed & 1 bath per side C. 600 SqFt Cottage w/ 2 bed 1 bath. Duplex needs TLC. Great potential as a multi generational family compound, possibly a residential rehab home or an excellent income producing investment property.
-
2020-01-19price $450,000
-
2019-04-19price $575,000
-
2019-03-22$750,000 Active
ⓘ Source: listings_history table (triggers on properties + properties_extension) + one-shot
backfill from property_details.listing_events for pre-trigger history.
Nearby sold comps map
Loading sold comps map…
Walkable amenities ~0.75 mi
Loading nearby amenities…
Taxation est. · year 1
- Rental income
- $70,128
- − Mortgage interest
- −$28,008
- − Property taxes
- −$7,500
- − Insurance
- −$2,500
- − Repairs & maintenance
- −$5,610
- − Management
- −$5,610
- − Depreciation
- −$14,545
- Taxable income
- $6,354
- Est. tax owed @ 24.0%
- −$1,525
- After-tax cash flow
- $12,411/yr
For passive investors: Depreciation is non-cash, so a rental often shows a tax loss while cash-flowing — sheltering income. Rental losses are passive: they offset passive income freely, and up to $25,000/yr can offset ordinary (W-2) income if you actively participate and your MAGI is under $100k (phasing out to $0 by $150k); unused losses carry forward. On sale, claimed depreciation is recaptured at up to 25%, and gains may owe capital-gains tax (a 1031 exchange can defer both). Figures are a year-1 estimate at your 24.0% rate — not tax advice; consult a CPA.
Condition & rehab AI · 13 photos
This property requires extensive repairs and updates to its roof, exterior siding, flooring, interior walls, and HVAC systems. These repairs will significantly increase its resale and rental value.
Repairs flagged
- Major roof — The roof is in poor condition and needs to be replaced.
- Major exterior siding — The exterior siding is peeling and needs to be repainted or replaced.
- Major flooring — The flooring in the garage is in poor condition and needs to be replaced.
- Major interior walls — The interior walls show signs of wear and tear and need to be repainted or repaired.
- Major HVAC and mechanical systems — The HVAC and mechanical systems are outdated and need to be replaced.
Value-add opportunities
- Resale repair and replace roof — A new roof will improve the overall appearance and increase the property's value.
- Resale repair and replace exterior siding — Repainting or replacing the exterior siding will improve the property's curb appeal and increase its value.
- Rental repair and replace flooring in garage — A new floor in the garage will make the property more attractive to renters and increase its rental value.
- Resale repair and replace interior walls — Repainting or repairing the interior walls will improve the property's appearance and increase its resale value.
- Both replace HVAC and mechanical systems — Replacing the HVAC and mechanical systems will improve the property's energy efficiency and increase its overall value.
Renovation cost estimate screening
| Repair item | Severity | Est. cost |
|---|---|---|
| roof · The roof is in poor condition and needs to be replaced. | Major | $15,000–50,000 |
| exterior siding · The exterior siding is peeling and needs to be repainted or replaced. | Major | $15,000–50,000 |
| flooring · The flooring in the garage is in poor condition and needs to be replaced. | Major | $15,000–50,000 |
| interior walls · The interior walls show signs of wear and tear and need to be repainted or repaired. | Major | $15,000–50,000 |
| HVAC and mechanical systems · The HVAC and mechanical systems are outdated and need to be replaced. | Major | $15,000–50,000 |
| Total estimated repair cost · 5 items | $75,000–250,000 |
Value-add ROI direction
- Resale repair and replace roof — A new roof will improve the overall appearance and increase the property's value. ↑
- Resale repair and replace exterior siding — Repainting or replacing the exterior siding will improve the property's curb appeal and increase its value. ↑
- Rental repair and replace flooring in garage — A new floor in the garage will make the property more attractive to renters and increase its rental value. ↑
- Resale repair and replace interior walls — Repainting or repairing the interior walls will improve the property's appearance and increase its resale value. ↑
- Both replace HVAC and mechanical systems — Replacing the HVAC and mechanical systems will improve the property's energy efficiency and increase its overall value. ↑
ⓘ Cost ranges are severity-bucket heuristics (US national rule-of-thumb). Get contractor quotes + a written scope before underwriting a rehab budget.
Schools (NCES district)
- District
- Indian River
- NCES district ID
- 1200930
- Math proficiency
- 48% ▼ -9.00%
- Reading proficiency
- 52% ▼ -3.00%
- Median HH income
- $46,597
- Composite
- 42.45/100
- National rank
- #3218
- State rank
- #35 of 73 in FL
Livability — Gifford
- Score
- 68/100
- State rank
- #538
- US rank
- #10083
Category grades
Schools grade is shown separately in the Schools card above.
Census & demographics
- Census place
- Gifford, FL
- County
- Indian River County · 143,738 people
- Metro
- Sebastian-Vero Beach, FL
- Population (ZIP)
- 27,240
- Household income
- $78,058
- Rent vs Own
- Severe rent burden
- 674.0
Population outlook (Indian River County) Hauer SSP2
- Today (2025)
- 165,104 people
- By 2030
- 172,869 · +4.7%
- By 2040
- 185,640 · +12.4%
- By 2050
- 194,465 · +17.8%
- By 2075
- 211,115 · +27.9%
- By 2100
- 211,781 · +28.3%
Race, ethnicity, and origin ACS 2023
- Neighborhood character
- Diverse neighborhood (Simpson 0.59)
- Race & ethnicity
- White 60% Black 17% Two or more races 16% Hispanic / Latino 15%
- Hispanic origin (detail)
- Mexican 4% Puerto Rican 4% Cuban 2% Salvadoran 2%
- Common ancestry
- Romanian 3% Hispanic 3% Lithuanian 3%
- Foreign-born
- 10% · Canada, Jamaica
- Languages at home
- 86% English-only · Spanish 9% French/Haitian/Cajun 3% Russian/Polish/Slavic 1%
Political lean MEDSL · Indian River
- 2024 margin
- Strong R (+27.4) · D 36.0% · R 63.4%
- 2008→2024 swing
- -12.5pp toward R · 2008: -14.8pp · 2024: -27.4pp
- All cycles
- 2024: R+27.4 2020: R+21.6 2016: R+24.5 2012: R+22.3 2008: R+14.8
Not yet ingested
- Civics
- —
Market trends
- HPI YoY
- ▼ -91.34%
- Current HPI
- 282.6156
- Rent YoY
- ▼ -1.16%
- Metro
- Sebastian-Vero Beach, FL
- State GDP YoY
- ▲ 3.28%
- F500 in state
- 36
Industry mix (Fortune 500 HQ in FL)
| Industry | F500 HQs | Revenue |
|---|---|---|
| Industrial Technology | 2 | $29B |
|
||
| Insurance | 2 | $17B |
|
||
| Retail | 1 | $60B |
|
||
| Technology Distribution | 1 | $58B |
|
||
| Homebuilding | 1 | $35B |
|
||
| Technology Manufacturing | 1 | $35B |
|
||
Price history
-33.3% since first listed9 events — show timeline
- 2026-05-16 Coming Soon $500,000 RAIRCMLS
- 2023-02-21 Price Changed $490,000 RAIRCMLS
- 2023-02-10 Listed $495,000 RAIRCMLS
- 2023-02-06 Sold (MLS) $220,000 RAIRCMLS
- 2022-09-25 Pending — RAIRCMLS
- 2022-09-22 Listed $220,000 RAIRCMLS
- 2020-01-19 Price Changed $450,000 RAIRCMLS
- 2019-04-19 Price Changed $575,000 RAIRCMLS
- 2019-03-22 Listed $750,000 RAIRCMLS
Cash-flow waterfall
monthlySold comps — $/sqft
last 12 mo · ≤1 miLoading sold comps…