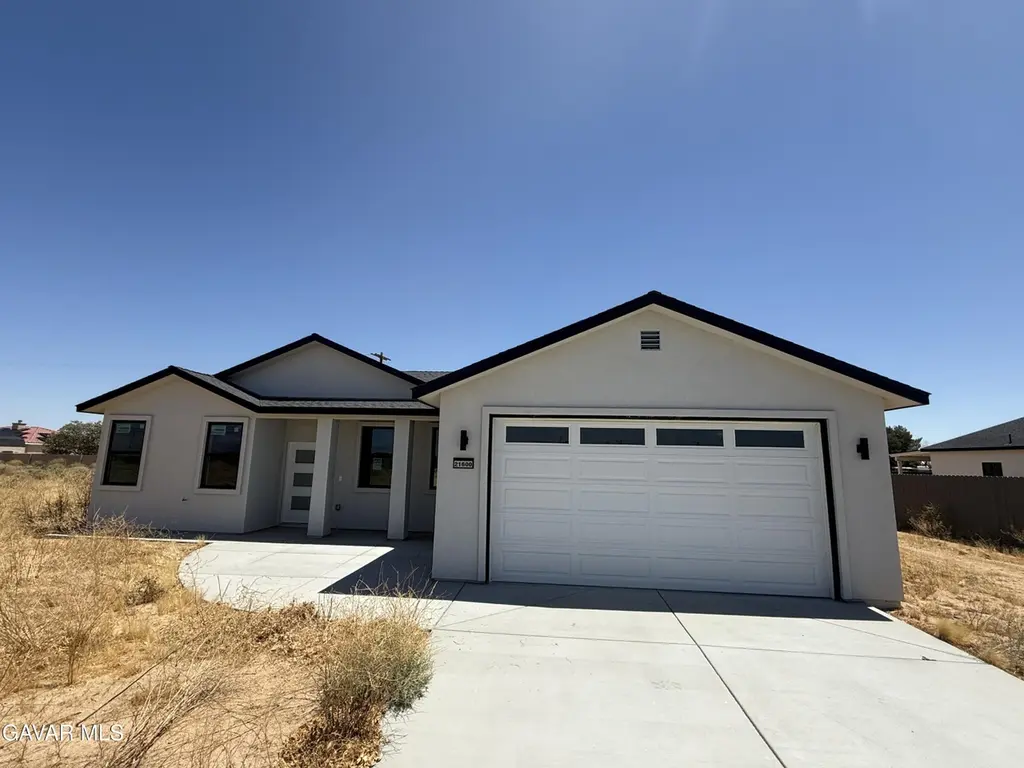
21600 Hacienda Blvd · California City, CA
Flood risk 1/10 · Minimal
- FEMA flood zone
- X (unshaded)
- Chance of flooding over 30 yrs
- 0.0%
- Est. flood insurance / yr
- $507 – $1,088
Fire risk 1/10 · Minimal
- Est. fire insurance / yr
- $659 – $1,223
Heat risk 8/10 · Major
- Hot days now (above 101°F)
- 7 days/yr
- Hot days in 30 yrs
- 17 days/yr
Wind risk 1/10 · Minimal
- Chance of severe wind over 30 yrs
- —
Air-quality risk 7/10 · Major
- Unhealthy air days now
- 13 days/yr
- Unhealthy air days in 30 yrs
- 17 days/yr
Risk factors via First Street. Map © Google.
Why this score? — see what drove the C grade
The composite is a weighted blend of 9 inputs, each scored 0–100. Each bar is that input's sub-score; the figure is the points it added to the 100-point composite (weight × sub-score).
- ARV discount +15.0/15.0
- Cash flow +12.8/30.0
- Appreciation +10.0/10.0
- Rent growth +3.9/5.0
- DSCR +3.8/10.0
- 1% rule +3.6/10.0
- Condition / age +2.5/5.0
- Livability +2.2/5.0
- Schools +2.1/10.0
$219,900
🖨 Deal sheet 📄 Offer letter ✓ Due diligence
Listing remarks
Welcome to this newly constructed home situated on a spacious lot of over 12,000 square feet. This thoughtfully designed floor plan offers 3 bedrooms, 2 bathrooms, an indoor laundry room with cabinetry, and an attached 2-car garage. The split-wing layout provides separation between the primary suite and secondary bedrooms, with the primary bedroom featuring a walk-in closet and private en-suite bathroom. As you enter, the living room, dining area, and kitchen take center stage, creating an open and functional living space. The home features attractive countertops, flooring, and a neutral color palette throughout. Construction has not been completed, providing an opportunity for the next own
Key facts
- 0.28 acre lot
- 2 garage spots
- Built 2025
Property features AI
Finance
- Other: Solar: contracted and owned/encumbered; APN 208-323-08; Lot in Tract 2791; Lot area recorded as 12,196.8; Square footage source: Assessor; Sale contingency: other (see agent remarks); Area: Kern County / Mojave / Cal C; Cross street: Hacienda Blvd and Susan
Exterior
- Parking: 2-car garage
- Utilities: Septic system; Water details to be verified by buyer
- Home design: Traditional style; Single-story
- Construction: Composition shingle roof; Shingle roof; Construction details to be verified by buyer; Foundation details to be verified by buyer
- Exterior features: RV access possible; Public streets
Interior
- Bathrooms: One full bathroom; One 3/4 bathroom
- Heating & cooling: Cooling: buyer to verify
- Interior features: Appliances and other interior details to be verified by buyer; Cooling details to be verified by buyer
Neighborhood map
What this means for you Summary
Snapshot
- This is a 3-bed/2.0-bath single-family listed at $220k.
Deal economics
- At list price, monthly cash flow is $-22 ($-262/yr) — negative.
- To cash-flow at today's rent, offer at most $216k (1.8% below list).
- To meet the 1% rule (rent ≥ 1% of price), the offer needs to be $190k (13.6% below list).
- Recommended offer: $190k (13.6% below list) — sets the bar for 1% rule.
Location & tenants
- Location reads 44/100 on livability (#1,329 in CA) — a working-class tenant base; expect higher turnover. Strengths: housing A+; Watch: schools F, crime F, amenities F.
- Mojave Unified (town): math 25% / reading 25% proficiency, ranked #411 of 517 in CA (top 80%) — low school quality limits family demand, transient renter base, plan for 1-2y turnover; 76% free/reduced lunch — lower-income household profile, screen leases tightly.
- Market conditions: Rents rising fast (+5.5%/yr); 703 active listings in the ZIP; 35 comparable units currently listed for rent nearby; rentals at typical pace (median 23d on market — plan ~3-4 weeks tenant-placement turnaround); 3,244 units permitted in Kern County in 2024 (73 in 5+ unit buildings).
- This rent runs 38% of the median local income ($60k/yr) — at the standard rent-burdened threshold; future hikes will face affordability resistance.
Forward outlook
- In year one you build about $24k of equity ($2k loan paydown + $22k appreciation (10.0% local appreciation)).
- Kern County population projected at +17% by 2050 — long-run rental-demand tailwind backs the buy-and-hold thesis.
- At projected returns (10.0% appreciation + 5.5% rent growth), your $62k cash investment doubles in ~3 years — after that, you're playing with house money.
- By year 2, paydown + projected appreciation supports a ~$38k cash-out refi (75% LTV) — recoverable capital for the next deal without selling this one.
Negotiation context
- Only 11 days on market — expect competitive offers; lowballing is unlikely to land.
- 2 sale attempts with the ask held roughly flat each time — persistent listings suggest the price (not the market) is what's stuck; bring a comps-based counter.
Risks & watch-outs
- Climate carrying-cost: extreme-heat days projected 7→17/yr by 2055 (HVAC capex compounding) — expect insurance premiums to compound above CPI over the hold.
Questions for the listing agent
- What do current leases actually rent for vs. the listed asking? Can we see a recent rent roll and the last 12 months of T-12 income?
- Is there a deadline driving the sale (1031 exchange, divorce, estate, relocation)? That informs how much negotiation room exists.
- Schools are F-rated, which usually means shorter tenancies and higher turnover. Who's the typical renter profile here, and what's been the actual vacancy rate?
- Crime grade is F in this area — have there been break-ins, vandalism, or insurance claims at this property in the last 3 years? What carrier currently insures it and at what premium?
- What's the average days-on-market for RENTAL listings here right now (not sales)? A rising rental-DOM trend means longer vacancies and softer asking-rent achievability than the comps imply.
- What's the recent tenant-quality profile in this submarket — average credit score on applications, eviction rate, late-payment / NSF rate, and stable-employment percentage? A property-management company in the area should have these aggregated.
- How much new for-sale + rental construction is in the pipeline within 1–3 miles? Heavy new supply typically softens prices + rents 12–24 months out; constrained supply supports both.
Investment metrics
- 1% rule
- 0.86% ✗
- Cap rate
- 6.17%
- Cash-on-cash
- -0.42%
- DSCR
- 0.98
- GRM
- 9.6
CMA / ARV
- ARV (on-the-fly)
- $291,914
- Comps found
- 12
Show comp detail 12 sales within ~0.75 mi
| Address | Dist | Beds/Ba | Sqft | Sold | Price | $/sf | Match |
|---|---|---|---|---|---|---|---|
| 9407 Irene Ave | 0.19mi | 3/2.0 | 1,429 (-1%) | 1mo | $325,000 | $227 | 89 |
| 9331 Irene Ave | 0.16mi | 3/2.0 | 1,507 (+5%) | 4mo | $315,000 | $209 | 81 |
| 9508 Evelyn Ave | 0.38mi | 3/2.0 | 1,475 (+3%) | 0mo | $300,000 | $203 | 78 |
| 9143 Rea Avenue Ave | 0.35mi | 3/2.0 | 1,522 (+6%) | 3mo | $344,400 | $226 | 71 |
| 21717 96th St | 0.31mi | 3/2.0 | 1,306 (-9%) | 7mo | $240,000 | $184 | 64 |
| 9418 Karen Ave | 0.25mi | 3/2.0 | 1,626 (+13%) | 3mo | $258,000 | $159 | 64 |
| 9908 Susan Ave | 0.72mi | 4/2.0 (+1) | 1,429 (-1%) | 3mo | $320,000 | $224 | 58 |
| 8801 Lupine Loop Dr | 0.46mi | 3/2.0 | 1,555 (+8%) | 8mo | $234,000 | $150 | 58 |
| 8824 Lupine Loop | 0.41mi | 3/2.0 | 1,248 (-13%) | 2mo | $240,000 | $192 | 57 |
| 9031 Heather Ave | 0.30mi | 3/2.0 | 1,652 (+15%) | 7mo | $255,000 | $154 | 56 |
| 21231 Corwin St | 0.42mi | 3/2.0 | 1,632 (+14%) | 4mo | $279,000 | $171 | 54 |
| 9312 California City Blvd | 0.65mi | 3/2.0 | 1,248 (-13%) | 4mo | $265,000 | $212 | 44 |
Match score weights: distance 35% · size 25% · config 20% · recency 20%. Top-matched comps best support the ARV.
Projected returns pro-forma
10.0% appreciation · 5.45% rent growth · sell at horizon
- IRR
- 24.8%
- Equity multiple
- 3.00×
- Total profit
- $123,204
- Equity at exit
- $198,103
- IRR
- 22.6%
- Equity multiple
- 7.09×
- Total profit
- $374,719
- Equity at exit
- $427,217
Cash invested: $61,572 (down + closing). Projections, not guarantees.
Landlord ↔ Tenant lean methodology
- Overall (STATE)
- 18 Strongly Tenant-Friendly
- State California
- 18 Strongly Tenant-Friendly · D+13
- County
- — inherits STATE
- City
- — inherits STATE
ZIP-level market 93505
- Home prices YoY
- 13.0%
- Rents YoY
- 5.5%
- Active inventory
- 703
- Price-to-rent
- 9.6×
Monthly cashflow live
- Estimated rent
- $1,900 high interval (Pro) →
- Mortgage (P&I)
- −$1,153
- Tax from tax record
- −$278 /mo · $3,335/yr
- Insurance
- −$92
- HOA
- −$0
- Vacancy / Maint / Mgmt
- −$399
- Net cashflow
- $-22
Break-even live
UW: 25.0% down · 7.5% · 30yr · 1.5% tax · 5.0% vac · 8.0% maint · 8.0% mgmt
Financing live
Cash to close
- Down payment
- $54,975
- Closing costs
- $6,597
- Reserves months
- —
- Total cash needed
- —
Loan-product check · same deal, 3 products live
Conventional
25% down · 7.5% · 30yr
- Down + closing
- —
- Monthly P&I
- —
- Monthly cashflow
- —
- DSCR
- —
- Eligible?
- —
Personal DTI + credit; lowest rate.
DSCR
20% down · 8.5% · 30yr
- Down + closing
- —
- Monthly P&I
- —
- Monthly cashflow
- —
- DSCR
- —
- Eligible?
- —
No personal income docs; deal must DSCR.
Hard money
10% down · 12.0% · 12mo
- Down + closing
- —
- Monthly P&I
- —
- Monthly cashflow
- —
- DSCR
- —
- Eligible?
- —
Short-term bridge; refi at stabilization.
Rent comps 35 comps
| Address | Beds | Baths | Sqft | Rent | $/sqft | DOM | Units | Dist |
|---|---|---|---|---|---|---|---|---|
| 21411 Hacienda Blvd Unit D California City, CA | 2.0 | 2.0 | 898 | $1,475 | $1.64 | 23d | 1 | 0.22mi |
| 9019 Evelyn Ave California City, CA | 4.0 | 2.0 | 1731 | $2,600 | $1.50 | 3d | 1 | 0.28mi |
| 9524 Sally Ave Unit C California City, CA | 2.0 | 1.5 | 1140 | $1,300 | $1.14 | 23d | 1 | 0.33mi |
| 9548 Sally Ave Unit B California City, CA | 3.0 | 2.5 | 1200 | $1,695 | $1.41 | 23d | 1 | 0.38mi |
| 21231 Corwin St California City, CA | 3.0 | 2.0 | 1632 | $2,500 | $1.53 | 23d | 1 | 0.43mi |
| 8816 Fuchsia Ave Unit PASSTHROUGH B California City, CA | 2.0 | 2.0 | 1077 | $1,550 | $1.44 | 14d | 1 | 0.51mi |
| 9749 N Loop Blvd California City, CA | 2.0 | 1.0 | 900 | $1,350 | $1.50 | 11d | 1 | 0.60mi |
| 9749 N Loop Blvd California City, CA | 2.0 | 1.0 | 900 | $1,350 | $1.50 | 3d | 1 | 0.60mi |
| 9749 N Loop Blvd California City, CA | 2.0 | 1.0 | 900 | $1,350 | $1.50 | 23d | 1 | 0.60mi |
| 9825 N Loop Blvd Unit B California City, CA | 2.0 | 1.0 | 883 | $1,350 | $1.53 | 18d | 1 | 0.67mi |
| 8709 Xavier Ave Unit 3 California City, CA | 2.0 | 1.0 | 900 | $1,500 | $1.67 | 14d | 1 | 0.70mi |
| 9848 Sally Ave Unit 2 California City, CA | 2.0 | 1.0 | 980 | $1,495 | $1.53 | 23d | 1 | 0.71mi |
| 8531 Columbine Ave Unit B California City, CA | 2.0 | 2.0 | 1000 | $1,300 | $1.30 | 14d | 1 | 0.73mi |
| 9933 N Loop Blvd Unit B California City, CA | 2.0 | 2.0 | 895 | $1,875 | $2.09 | 23d | 1 | 0.78mi |
| 21235 Windsong St California City, CA | 3.0 | 3.0 | 1780 | $2,100 | $1.18 | 23d | 1 | 0.86mi |
| 21319 Conklin Ct California City, CA | 2.0 | 2.0 | 1816 | $2,200 | $1.21 | 43d | 1 | 0.88mi |
| 8332 Rea Ave California City, CA | 4.0 | 3.0 | 1861 | $2,500 | $1.34 | 3d | 1 | 0.91mi |
| 8307 Charles Pl California City, CA | 3.0 | 2.0 | 1498 | $1,750 | $1.17 | 14d | 1 | 0.93mi |
| 9931 Putter Ct California City, CA | 3.0 | 2.0 | 1445 | $1,675 | $1.16 | 3d | 1 | 0.93mi |
| 21187 Conklin Blvd California City, CA | 3.0 | 2.0 | 1473 | $1,800 | $1.22 | 14d | 1 | 0.94mi |
| 21306 Bancroft Ct California City, CA | 2.0 | 2.0 | 906 | $1,800 | $1.99 | 3d | 1 | 0.97mi |
| 8318 Dogbane Ave Unit F California City, CA | 2.0 | 1.0 | 880 | $1,350 | $1.53 | 23d | 1 | 0.97mi |
| 8651 S Loop Blvd California City, CA | 2.0 | 1.0 | 1050 | $1,650 | $1.57 | 3d | 1 | 1.00mi |
| 9213 Holly Ave California City, CA | 3.0 | 2.0 | 1339 | $1,900 | $1.42 | 3d | 1 | 1.07mi |
| 20961 83rd St Unit 6 California City, CA | 2.0 | 2.0 | 1100 | $1,300 | $1.18 | 23d | 1 | 1.09mi |
| 8801 S Loop Blvd California City, CA | 3.0 | 2.0 | 1537 | $2,600 | $1.69 | 23d | 1 | 1.10mi |
| 10193 Evelyn Ave California City, CA | 3.0 | 2.0 | 1616 | $2,150 | $1.33 | 14d | 1 | 1.12mi |
| 20673 Medio St California City, CA | 3.0 | 2.0 | 1690 | $2,075 | $1.23 | 23d | 1 | 1.26mi |
| 21032 79th St California City, CA | 4.0 | 2.0 | 1228 | $2,100 | $1.71 | 23d | 1 | 1.35mi |
| 20321 88th St California City, CA | 3.0 | 2.0 | 1176 | $2,100 | $1.79 | 23d | 1 | 1.35mi |
| 7819 Walpole Ave California City, CA | 2.0 | 1.0 | 900 | $1,399 | $1.55 | 23d | 1 | 1.39mi |
| 20312 Dean Ct California City, CA | 3.0 | 2.0 | 1742 | $1,975 | $1.13 | 14d | 1 | 1.43mi |
| 8100 Fernwood Ave California City, CA | 3.0 | 2.0 | 1336 | $1,850 | $1.38 | 23d | 1 | 1.44mi |
| 8648 Lime Ave California City, CA | 3.0 | 2.0 | 1459 | $2,400 | $1.64 | 23d | 1 | 1.44mi |
| 7733 Walpole Ave Unit A California City, CA | 3.0 | 2.0 | 1600 | $2,000 | $1.25 | 23d | 1 | 1.45mi |
Listing history 14 events
-
2026-06-18days on market $219,900 Active 11 DOM
-
2026-06-17days on market $219,900 Active 10 DOM
-
2026-06-16days on market $219,900 Active 9 DOM
-
2026-06-15days on market $219,900 Active 8 DOM
-
2026-06-14days on market $219,900 Active 6 DOM
-
2026-06-13days on market $219,900 Active 5 DOM
-
2026-06-10days on market $219,900 Active 3 DOM
-
2026-06-09days on market $219,900 Active 2 DOM
-
2026-06-07days on market $219,900 Active 1 DOM
-
2026-06-05days on market $219,900 Active 4 DOM
-
2026-06-03days on market $219,900 Active 3 DOM
-
2026-06-03days on market $219,900 Active 2 DOM
-
2026-06-01remarks 699-char remark
-
2026-06-01$219,900 Active 1 DOM
ⓘ Source: listings_history table (triggers on properties + properties_extension) + one-shot
backfill from property_details.listing_events for pre-trigger history.
Tax reassessment forecast CA · Resets to sale price
- Current annual tax
- $3,335 · $278/mo
- Projected year-2 tax
- $3,335 · $278/mo
- Expected delta
- $0/yr ($0/mo · 0.0%)
ⓘ Screening estimate from a state-policy table — verify with the county assessor before closing.
Climate risk First Street
- Flood 1/10 Low FEMA zone X (unshaded) · 0% chance over 30 yrs
- Wildfire 1/10 Low
- Heat 8/10 Severe 7 d/yr ≥101°F today · 17 d/yr by 30 yrs out
- Wind 1/10 Low
- Air quality 7/10 Severe 13 unhealthy d/yr today · 17 by 30 yrs out
Nearby sold comps map
Loading sold comps map…
Walkable amenities ~0.75 mi
Loading nearby amenities…
Taxation est. · year 1
- Rental income
- $22,799
- − Mortgage interest
- −$12,318
- − Property taxes
- −$3,335
- − Insurance
- −$1,100
- − Repairs & maintenance
- −$1,824
- − Management
- −$1,824
- − Depreciation
- −$6,397
- Taxable loss
- −$3,998
- Est. tax savings @ 24.0%
- +$960
- After-tax cash flow
- $698/yr
For passive investors: Depreciation is non-cash, so a rental often shows a tax loss while cash-flowing — sheltering income. Rental losses are passive: they offset passive income freely, and up to $25,000/yr can offset ordinary (W-2) income if you actively participate and your MAGI is under $100k (phasing out to $0 by $150k); unused losses carry forward. On sale, claimed depreciation is recaptured at up to 25%, and gains may owe capital-gains tax (a 1031 exchange can defer both). Figures are a year-1 estimate at your 24.0% rate — not tax advice; consult a CPA.
Schools (NCES district)
- District
- Mojave Unified
- NCES district ID
- 0625230
- Math proficiency
- 25% ▲ 11.00%
- Reading proficiency
- 25% ▼ -1.00%
- Median HH income
- $43,017
- Composite
- 21.4/100
- National rank
- #8350
- State rank
- #411 of 517 in CA
Livability — California City
- Score
- 44/100
- State rank
- #1329
- US rank
- #26753
Category grades
Schools grade is shown separately in the Schools card above.
Census & demographics
- Census place
- California City, CA
- County
- Kern County · 710,371 people
- City population
- 14,353
- Metro
- Bakersfield, CA
- Population (ZIP)
- 14,353
- Household income
- $59,827
- Rent vs Own
- Severe rent burden
- 883.0
Population outlook (Kern County) Hauer SSP2
- Today (2025)
- 947,286 people
- By 2030
- 978,984 · +3.3%
- By 2040
- 1,045,018 · +10.3%
- By 2050
- 1,105,232 · +16.7%
- By 2075
- 1,229,538 · +29.8%
- By 2100
- 1,238,059 · +30.7%
Race, ethnicity, and origin ACS 2023
- Neighborhood character
- Highly diverse neighborhood (Simpson 0.70)
- Race & ethnicity
- Hispanic / Latino 40% White 30% Black 22% Two or more races 16% Native American 3% Asian 1%
- Hispanic origin (detail)
- Mexican 29%
- Common ancestry
- Italian 3% Lithuanian 1% Romanian 1%
- Foreign-born
- 13% · Canada, Dominican Republic
- Languages at home
- 68% English-only · Spanish 29%
Political lean MEDSL · Kern
- 2024 margin
- Strong R (+21.1) · D 38.2% · R 59.3% · Other 2.5%
- 2008→2024 swing
- -3.3pp toward R · 2008: -17.8pp · 2024: -21.1pp
- All cycles
- 2024: R+21.1 2020: R+10.2 2016: R+15.0 2012: R+20.9 2008: R+17.8
Not yet ingested
- Civics
- —
Market trends
- HPI YoY
- ▲ 46.32%
- Current HPI
- 402.4192
- Rent YoY
- ▲ 5.45%
- Metro
- Bakersfield, CA
- State GDP YoY
- ▲ 3.21%
- F500 in state
- 116
Industry mix (Fortune 500 HQ in CA)
| Industry | F500 HQs | Revenue |
|---|---|---|
| Technology | 27 | $1,492B |
|
||
| Financial Services | 3 | $174B |
|
||
| Retail | 3 | $44B |
|
||
| Insurance | 3 | $26B |
|
||
| Media / Entertainment | 2 | $115B |
|
||
| Pharmaceuticals / Biotech | 2 | $62B |
|
||
Price history
-38.7% since first listed11 events — show timeline
- 2026-05-30 Listed $219,900 AVMLS
- 2025-11-06 Listing Removed — CRMLS
- 2025-08-25 Price Changed $320,500 AVMLS
- 2025-08-25 Price Changed $320,500 CRMLS
- 2025-06-16 Price Changed $328,500 AVMLS
- 2025-06-16 Price Changed $328,500 CRMLS
- 2025-04-02 Price Changed $334,900 AVMLS
- 2025-04-02 Price Changed $334,900 CRMLS
- 2025-03-18 Price Changed $344,900 AVMLS
- 2025-03-17 Price Changed $344,900 CRMLS
- 2025-02-12 Listed $359,000 CRMLS
Property tax history
+25.2%/yrLatest (2025): $3,335 · +7866.1% YoY. Source: county tax records.
Cash-flow waterfall
monthlySold comps — $/sqft
last 12 mo · ≤1 miLoading sold comps…