 🏷️ Likely Rental
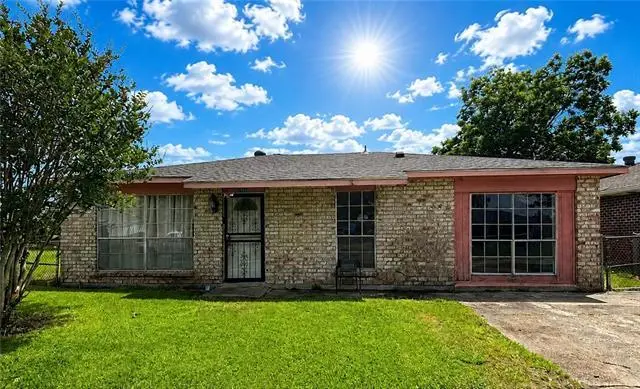
7841 Gwen St · Bridge City, LA
Flood risk 8/10 · Major
- FEMA flood zone
- X
- Chance of flooding over 30 yrs
- 0.6%
- Est. flood insurance / yr
- $507 – $1,088
Fire risk 1/10 · Minimal
- Est. fire insurance / yr
- $1,269 – $2,357
Heat risk 10/10 · Severe
- Hot days now (above 109°F)
- 7 days/yr
- Hot days in 30 yrs
- 21 days/yr
Wind risk 10/10 · Severe
- Chance of severe wind over 30 yrs
- 99.0%
Air-quality risk 2/10 · Minimal
- Unhealthy air days now
- 1 days/yr
- Unhealthy air days in 30 yrs
- 2 days/yr
Risk factors via First Street. Map © Google.
Why this score? — see what drove the B- grade
The composite is a weighted blend of 9 inputs, each scored 0–100. Each bar is that input's sub-score; the figure is the points it added to the 100-point composite (weight × sub-score).
- Cash flow +27.1/30.0
- ARV discount +15.0/15.0
- DSCR +9.4/10.0
- 1% rule +6.3/10.0
- Livability +3.1/5.0
- Schools +2.5/10.0
- Condition / age +2.5/5.0
- Rent growth +2.3/5.0
- Appreciation +0.0/10.0
$150,000
🖨 Deal sheet 📄 Offer letter ✓ Due diligence
Listing remarks MLS
Welcome to Harbor Estates! This brick 4-bedroom, 2-bath home offers plenty of space and flexibility, including a bonus room just off the kitchen that could serve as a home office, playroom, hobby room, or additional living area. Situated in an X Flood Zone, this property presents an excellent opportunity for homeowners and investors alike. The functional floor plan provides comfortable living spaces, while the spacious bedrooms offer room for everyone. A storage shed adds extra convenience for tools and equipment. Property is currently tenant occupied on a month-to-month lease, creating potential income-producing opportunities for investors. Offered at its appraised value, don't miss this affordable opportunity! Final sale is subject to court approval.
Key facts
- Bonus room
- Storage shed
- 5,000 sq ft lot
Tags
Property features AI
Exterior
- Parking: Driveway
- Utilities: Public water; Public sewer
- Home design: Single-story; Brick exterior; Shingle roof; Slab foundation
- Construction: Built with brick construction
- Exterior features: Shed(s); City lot; Rectangular lot; Lot dimensions approximately 50 x 100
Interior
- Kitchen: Oven; Range; Refrigerator
- Bathrooms: 2 full bathrooms
- Heating & cooling: Central heating; Central air conditioning
- Interior features: Granite counters
- Laundry & utility: Dryer
Neighborhood map
What this means for you Summary
Snapshot
- This is a 4-bed/2.0-bath single-family listed at $150k.
Deal economics
- At list price, monthly cash flow is $358 ($4k/yr) — positive.
- The deal already cash-flows at list — no discount required.
- Meets the 1% rule at list price ($2k rent vs $150k).
- Recommended offer: $148k (1.5% below list) — sets the bar for market timing.
Location & tenants
- Location reads 61/100 on livability (#225 in LA) — a middle-class / working-renter tenant base. Strengths: cost of living A+, housing A+; Watch: schools D+, crime F, amenities F.
- Jefferson Parish (suburban): math 24% / reading 34% proficiency, ranked #44 of 98 in LA (top 45%) — low school quality limits family demand, transient renter base, plan for 1-2y turnover; 70% free/reduced lunch — lower-income household profile, screen leases tightly.
- Market conditions: Rents soft (-0.8%/yr); 186 active listings in the ZIP; 6 comparable units currently listed for rent nearby; rentals at typical pace (median 24d on market — plan ~3-4 weeks tenant-placement turnaround); 518 units permitted in Jefferson Parish in 2024 (43 in 5+ unit buildings).
- This rent runs 38% of the median local income ($54k/yr) — at the standard rent-burdened threshold; future hikes will face affordability resistance.
Forward outlook
- Local home prices are declining (-3.0%/yr); year-one equity from $1k of loan paydown is wiped out by about $4k of value loss. Plan a longer hold.
Negotiation context
- It's been on market 17 days — a 2% lower offer ($148k) is reasonable based on typical stale-listing flexibility.
- 2 sale attempts with the ask held roughly flat each time — persistent listings suggest the price (not the market) is what's stuck; bring a comps-based counter.
Risks & watch-outs
- Watch-outs: flood insurance adds $66/mo.
- Climate carrying-cost: severe flood risk; severe wind risk, 99% chance of damaging wind over 30y; extreme-heat days projected 7→21/yr by 2055 (HVAC capex compounding) — expect insurance premiums to compound above CPI over the hold.
Questions for the listing agent
- What's the actual annual flood-insurance premium (NFIP or private), and is the property in a SFHA with mandatory coverage?
- Is there a deadline driving the sale (1031 exchange, divorce, estate, relocation)? That informs how much negotiation room exists.
- Schools are D-rated, which usually means shorter tenancies and higher turnover. Who's the typical renter profile here, and what's been the actual vacancy rate?
- Crime grade is F in this area — have there been break-ins, vandalism, or insurance claims at this property in the last 3 years? What carrier currently insures it and at what premium?
- What's the average days-on-market for RENTAL listings here right now (not sales)? A rising rental-DOM trend means longer vacancies and softer asking-rent achievability than the comps imply.
- What's the recent tenant-quality profile in this submarket — average credit score on applications, eviction rate, late-payment / NSF rate, and stable-employment percentage? A property-management company in the area should have these aggregated.
- How much new for-sale + rental construction is in the pipeline within 1–3 miles? Heavy new supply typically softens prices + rents 12–24 months out; constrained supply supports both.
Investment metrics
- 1% rule
- 1.13% ✓
- Cap rate
- 9.68%
- Cash-on-cash
- 12.11%
- DSCR
- 1.54
- GRM
- 7.4
CMA / ARV
- ARV (on-the-fly)
- $202,272
- Comps found
- 9
Show comp detail 9 sales within ~0.75 mi
| Address | Dist | Beds/Ba | Sqft | Sold | Price | $/sf | Match |
|---|---|---|---|---|---|---|---|
| 7817 Alma St | 0.15mi | 4/2.0 | 1,584 (+1%) | 12mo | $205,000 | $129 | 81 |
| 120 Birch Ct | 0.26mi | 4/2.0 | 1,664 (+6%) | 11mo | $60,000 | $36 | 68 |
| 451 Sala Ave | 0.46mi | 3/2.0 (-1) | 1,464 (-7%) | 11mo | $155,000 | $106 | 53 |
| 9416 Cabildo Ln | 0.56mi | 4/2.0 | 1,411 (-10%) | 10mo | $81,000 | $57 | 49 |
| 802 Avenue B Ave | 0.50mi | 4/2.0 | 1,700 (+8%) | 22mo | $175,000 | $103 | 45 |
| 541 Avenue A | 0.43mi | 3/2.0 (-1) | 1,460 (-7%) | 23mo | $209,900 | $144 | 44 |
| 756 Avenue A | 0.43mi | 3/2.0 (-1) | 1,361 (-13%) | 14mo | $248,500 | $183 | 41 |
| 127 Otto St | 0.74mi | 3/2.0 (-1) | 1,440 (-8%) | 11mo | $215,000 | $149 | 37 |
| 609 5th St | 0.66mi | 3/2.0 (-1) | 1,347 (-14%) | 24mo | $199,900 | $148 | 21 |
Match score weights: distance 35% · size 25% · config 20% · recency 20%. Top-matched comps best support the ARV.
Projected returns pro-forma
-3.0% appreciation · 0.0% rent growth · sell at horizon
- IRR
- -4.3%
- Equity multiple
- 0.85×
- Total profit
- $-6,506
- Equity at exit
- $22,365
- IRR
- 1.7%
- Equity multiple
- 1.11×
- Total profit
- $4,444
- Equity at exit
- $12,969
Cash invested: $42,000 (down + closing). Projections, not guarantees.
Landlord ↔ Tenant lean methodology
- Overall (STATE)
- 90 Strongly Landlord-Friendly
- State Louisiana
- 90 Strongly Landlord-Friendly · R+12
- County
- — inherits STATE
- City
- — inherits STATE
ZIP-level market 70094
- Rents YoY
- -0.8%
- Active inventory
- 186
- Price-to-rent
- 7.4×
Monthly cashflow live
- Estimated rent
- $1,693 high interval (Pro) →
- Mortgage (P&I)
- −$787
- Tax from tax record
- −$64 /mo · $772/yr
- Insurance
- −$62
- Flood insurance flood zone
- −$66 /mo · $798/yr
- HOA
- −$0
- Vacancy / Maint / Mgmt
- −$356
- Net cashflow
- $358
Break-even live
UW: 25.0% down · 7.5% · 30yr · 1.5% tax · 5.0% vac · 8.0% maint · 8.0% mgmt
Financing live
Cash to close
- Down payment
- $37,500
- Closing costs
- $4,500
- Reserves months
- —
- Total cash needed
- —
Loan-product check · same deal, 3 products live
Conventional
25% down · 7.5% · 30yr
- Down + closing
- —
- Monthly P&I
- —
- Monthly cashflow
- —
- DSCR
- —
- Eligible?
- —
Personal DTI + credit; lowest rate.
DSCR
20% down · 8.5% · 30yr
- Down + closing
- —
- Monthly P&I
- —
- Monthly cashflow
- —
- DSCR
- —
- Eligible?
- —
No personal income docs; deal must DSCR.
Hard money
10% down · 12.0% · 12mo
- Down + closing
- —
- Monthly P&I
- —
- Monthly cashflow
- —
- DSCR
- —
- Eligible?
- —
Short-term bridge; refi at stabilization.
Rent comps 6 comps
| Address | Beds | Baths | Sqft | Rent | $/sqft | DOM | Units | Dist |
|---|---|---|---|---|---|---|---|---|
| 525 Emile Ave Westwego, LA | 3.0 | 2.0 | 1329 | $800 | $0.60 | 23d | 1 | 0.14mi |
| 7804 Britt St Westwego, LA | 5.0 | 2.0 | 1512 | $1,800 | $1.19 | 43d | 1 | 0.17mi |
| 181 Louisiana St Westwego, LA | 4.0 | 2.0 | 1500 | $1,550 | $1.03 | 43d | 1 | 0.32mi |
| 1060 Avenue B Unit A Westwego, LA | 3.0 | 2.0 | 1124 | $1,550 | $1.38 | 23d | 1 | 0.74mi |
| 653 Vic a Pitre Dr Westwego, LA | 3.0 | 2.0 | 1491 | $2,200 | $1.48 | 4d | 1 | 1.10mi |
| 1233 Central Ave Westwego, LA | 3.0 | 1.5 | 1357 | $1,500 | $1.11 | 23d | 1 | 1.32mi |
Listing history 12 events
-
2026-06-18days on market $150,000 Active 17 DOM
-
2026-06-17days on market $150,000 Active 16 DOM
-
2026-06-16days on market $150,000 Active 15 DOM
-
2026-06-15days on market $150,000 Active 14 DOM
-
2026-06-13days on market $150,000 Active 12 DOM
-
2026-06-10days on market $150,000 Active 9 DOM
-
2026-06-09days on market $150,000 Active 8 DOM
-
2026-06-08days on market $150,000 Active 7 DOM
-
2026-06-07days on market $150,000 Active 6 DOM
-
2026-06-03days on market $150,000 Active 2 DOM
-
2026-06-02remarks 699-char remark
-
2026-06-02$150,000 Active 1 DOM
ⓘ Source: listings_history table (triggers on properties + properties_extension) + one-shot
backfill from property_details.listing_events for pre-trigger history.
Tax reassessment forecast LA · Resets to sale price
- Current annual tax
- $772 · $64/mo
- Projected year-2 tax
- $825 · $69/mo
- Expected delta
- +$53/yr (+$4/mo · 6.9%)
ⓘ Screening estimate from a state-policy table — verify with the county assessor before closing.
Climate risk First Street
- Flood 8/10 Severe FEMA zone X · 60% chance over 30 yrs
- Wildfire 1/10 Low
- Heat 10/10 Extreme 7 d/yr ≥109°F today · 21 d/yr by 30 yrs out
- Wind 10/10 Extreme 99% chance of damaging wind over 30 yrs
- Air quality 2/10 Low 1 unhealthy d/yr today · 2 by 30 yrs out
Nearby sold comps map
Loading sold comps map…
Walkable amenities ~0.75 mi
Loading nearby amenities…
Taxation est. · year 1
- Rental income
- $20,315
- − Mortgage interest
- −$8,402
- − Property taxes
- −$772
- − Insurance
- −$1,547
- − Repairs & maintenance
- −$1,625
- − Management
- −$1,625
- − Depreciation
- −$4,364
- Taxable income
- $1,979
- Est. tax owed @ 24.0%
- −$475
- After-tax cash flow
- $3,815/yr
For passive investors: Depreciation is non-cash, so a rental often shows a tax loss while cash-flowing — sheltering income. Rental losses are passive: they offset passive income freely, and up to $25,000/yr can offset ordinary (W-2) income if you actively participate and your MAGI is under $100k (phasing out to $0 by $150k); unused losses carry forward. On sale, claimed depreciation is recaptured at up to 25%, and gains may owe capital-gains tax (a 1031 exchange can defer both). Figures are a year-1 estimate at your 24.0% rate — not tax advice; consult a CPA.
Schools (NCES district)
- District
- Jefferson Parish
- NCES district ID
- 2200840
- Math proficiency
- 24% ▼ -36.00%
- Reading proficiency
- 34% ▼ -30.00%
- Median HH income
- $48,421
- Composite
- 25.19/100
- National rank
- #7511
- State rank
- #44 of 98 in LA
Livability — Bridge City
- Score
- 61/100
- State rank
- #225
- US rank
- #17357
Category grades
Schools grade is shown separately in the Schools card above.
Census & demographics
- Census place
- Bridge City, LA
- County
- Jefferson Parish · 426,999 people
- Metro
- New Orleans-Metairie, LA
- Population (ZIP)
- 32,130
- Household income
- $53,597
- Rent vs Own
- Severe rent burden
- 1457.0
Population outlook (Jefferson County) Hauer SSP2
- Today (2025)
- 451,696 people
- By 2030
- 455,451 · +0.8%
- By 2040
- 458,308 · +1.5%
- By 2050
- 461,031 · +2.1%
- By 2075
- 476,351 · +5.5%
- By 2100
- 499,377 · +10.6%
Race, ethnicity, and origin ACS 2023
- Neighborhood character
- Diverse neighborhood (Simpson 0.65)
- Race & ethnicity
- Black 46% White 36% Hispanic / Latino 13% Two or more races 6% Asian 2%
- Hispanic origin (detail)
- Mexican 2% Dominican 2%
- Common ancestry
- Lithuanian 9% Scottish 1%
- Foreign-born
- 8% · Canada, Vietnam
- Languages at home
- 86% English-only · Spanish 11% Vietnamese 2% French/Haitian/Cajun 1%
Political lean MEDSL · Jefferson
- 2024 margin
- R (+12.9) · D 42.5% · R 55.5% · Other 2.1%
- 2008→2024 swing
- +13.6pp toward D · 2008: -26.6pp · 2024: -12.9pp
- All cycles
- 2024: R+12.9 2020: R+11.1 2016: R+14.8 2012: R+18.4 2008: R+26.6
Not yet ingested
- Civics
- —
Market trends
- HPI YoY
- ▼ -111.56%
- Current HPI
- 102.9992
- Rent YoY
- ▼ -0.80%
- Metro
- New Orleans-Metairie, LA
- State GDP YoY
- ▲ 3.29%
- F500 in state
- 10
Industry mix (Fortune 500 HQ in LA)
| Industry | F500 HQs | Revenue |
|---|---|---|
| Telecommunications | 2 | $23B |
|
||
| Utilities | 1 | $12B |
|
||
| Wholesale / Distribution | 1 | $5B |
|
||
| Advertising | 1 | $2B |
|
||
Price history
+0.0% since first listed3 events — show timeline
- 2026-06-01 Listed $150,000 AcadianaMLS
- 2026-06-01 Listed $150,000 GSREIN
- 1985-04-01 Sold (Public Records) — Public Records
Property tax history
+1.1%/yrLatest (2025): $772 · +0.3% YoY. Source: county tax records.
Cash-flow waterfall
monthlySold comps — $/sqft
last 12 mo · ≤1 miLoading sold comps…