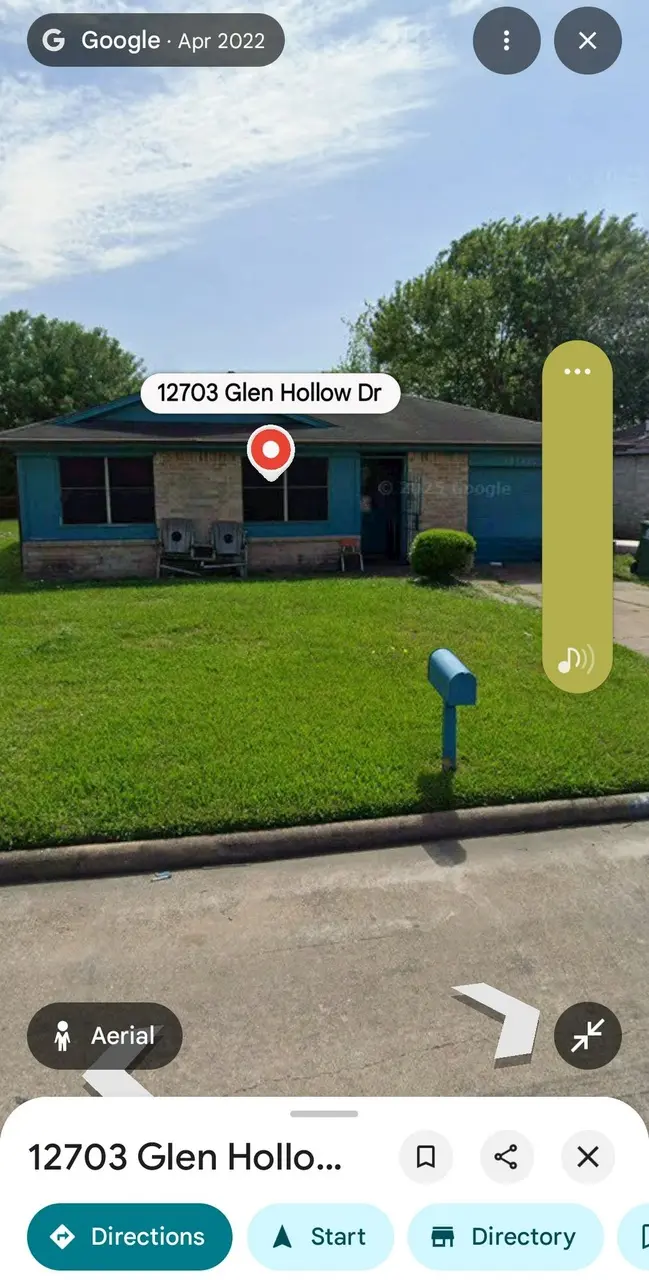
12703 Glenhollow Dr · Houston, TX
Flood risk 7/10 · Major
- FEMA flood zone
- X (unshaded)
- Chance of flooding over 30 yrs
- 0.99%
- Est. flood insurance / yr
- $507 – $1,088
Fire risk 1/10 · Minimal
- Est. fire insurance / yr
- $1,222 – $2,270
Heat risk 9/10 · Severe
- Hot days now (above 108°F)
- 7 days/yr
- Hot days in 30 yrs
- 25 days/yr
Wind risk 9/10 · Severe
- Chance of severe wind over 30 yrs
- 99.0%
Air-quality risk 2/10 · Minimal
- Unhealthy air days now
- 1 days/yr
- Unhealthy air days in 30 yrs
- 2 days/yr
Risk factors via First Street. Map © Google.
Why this score? — see what drove the B grade
The composite is a weighted blend of 9 inputs, each scored 0–100. Each bar is that input's sub-score; the figure is the points it added to the 100-point composite (weight × sub-score).
- Cash flow +25.7/30.0
- ARV discount +15.0/15.0
- DSCR +8.6/10.0
- 1% rule +7.1/10.0
- Appreciation +6.3/10.0
- Livability +3.7/5.0
- Rent growth +2.8/5.0
- Schools +2.7/10.0
- Condition / age +2.5/5.0
$130,000
🖨 Deal sheet 📄 Offer letter ✓ Due diligence
Listing remarks
Seeking direct buyer with capital in hand. 3 bed room in 6K feet lot. Houae 1k square feet. Conner lot.
Key facts
- 6,203 sq ft lot
- Built 1981
- Listed 14 days
Property features AI
Exterior
- Home design: House
- Exterior features: Lot approximately 6,203 sq ft
Neighborhood map
What this means for you Summary
Snapshot
- This is a 3-bed/2.0-bath single-family listed at $130k.
Deal economics
- At list price, monthly cash flow is $244 ($3k/yr) — positive.
- The deal already cash-flows at list — no discount required.
- Meets the 1% rule at list price ($2k rent vs $130k).
- Cap rate 9.2% vs local median 3.2% in Houston — top-decile yield for the area; either an underpriced asset or a hidden risk that comps aren't pricing in. Stress-test before assuming the spread holds.
Location & tenants
- Location reads 74/100 on livability (#184 in TX, #4,771 nationally) — a middle-class / working-renter tenant base. Strengths: amenities A+, cost of living A+, housing A+; Watch: schools D, crime F.
- Houston ISD (urban): math 27% / reading 35% proficiency, ranked #593 of 826 in TX (top 72%) — families likely to look elsewhere, expect single-tenant / working-renter base with shorter leases; 71% free/reduced lunch — lower-income household profile, screen leases tightly.
- Market conditions: Rents rising (+1.2%/yr); 303 active listings in the ZIP; 26 comparable units currently listed for rent nearby; rentals leasing fast (median 11d on market — plan ~1-2 weeks tenant-placement turnaround); 29,883 units permitted in Harris County in 2024 (8,621 in 5+ unit buildings).
- This rent runs 33% of the median local income ($57k/yr) — at the standard rent-burdened threshold; future hikes will face affordability resistance.
Forward outlook
- In year one you build about $4k of equity ($899 loan paydown + $3k appreciation (2.6% local appreciation)).
- Harris County population projected at +47% by 2050 — long-run rental-demand tailwind backs the buy-and-hold thesis.
- At projected returns (2.6% appreciation + 1.2% rent growth), your $36k cash investment doubles in ~5 years — after that, you're playing with house money.
- By year 8, paydown + projected appreciation supports a ~$32k cash-out refi (75% LTV) — recoverable capital for the next deal without selling this one.
Negotiation context
- Only 14 days on market — expect competitive offers; lowballing is unlikely to land.
Risks & watch-outs
- Watch-outs: flood insurance adds $66/mo.
- Climate carrying-cost: major flood risk; severe wind risk, 99% chance of damaging wind over 30y; extreme-heat days projected 7→25/yr by 2055 (HVAC capex compounding) — expect insurance premiums to compound above CPI over the hold.
Questions for the listing agent
- What's the actual annual flood-insurance premium (NFIP or private), and is the property in a SFHA with mandatory coverage?
- Is there a deadline driving the sale (1031 exchange, divorce, estate, relocation)? That informs how much negotiation room exists.
- Schools are D-rated, which usually means shorter tenancies and higher turnover. Who's the typical renter profile here, and what's been the actual vacancy rate?
- Crime grade is F in this area — have there been break-ins, vandalism, or insurance claims at this property in the last 3 years? What carrier currently insures it and at what premium?
- What's the average days-on-market for RENTAL listings here right now (not sales)? A rising rental-DOM trend means longer vacancies and softer asking-rent achievability than the comps imply.
- What's the recent tenant-quality profile in this submarket — average credit score on applications, eviction rate, late-payment / NSF rate, and stable-employment percentage? A property-management company in the area should have these aggregated.
- How much new for-sale + rental construction is in the pipeline within 1–3 miles? Heavy new supply typically softens prices + rents 12–24 months out; constrained supply supports both.
Investment metrics
- 1% rule
- 1.21% ✓
- Cap rate
- 9.16%
- Cash-on-cash
- 10.23%
- DSCR
- 1.46
- GRM
- 6.9
CMA / ARV
- ARV (on-the-fly)
- $188,856
- Comps found
- 4
Show comp detail 4 sales within ~0.75 mi
| Address | Dist | Beds/Ba | Sqft | Sold | Price | $/sf | Match |
|---|---|---|---|---|---|---|---|
| 5119 Kilkenny Dr | 0.11mi | 3/1.5 | 991 (-4%) | 11mo | $130,000 | $131 | 77 |
| 5135 Fairgreen Ln | 0.45mi | 3/1.0 | 938 (-9%) | 6mo | $151,500 | $162 | 55 |
| 11822 Greenshire Dr | 0.62mi | 3/2.0 | 1,100 (+7%) | 11mo | $215,000 | $195 | 51 |
| 5319 Bungalow Ln | 0.57mi | 3/2.0 | 1,146 (+11%) | 11mo | $209,900 | $183 | 45 |
Match score weights: distance 35% · size 25% · config 20% · recency 20%. Top-matched comps best support the ARV.
Projected returns pro-forma
2.61% appreciation · 1.17% rent growth · sell at horizon
- IRR
- 12.8%
- Equity multiple
- 1.71×
- Total profit
- $25,785
- Equity at exit
- $55,633
- IRR
- 14.0%
- Equity multiple
- 2.92×
- Total profit
- $69,914
- Equity at exit
- $83,605
Cash invested: $36,400 (down + closing). Projections, not guarantees.
Landlord ↔ Tenant lean methodology
- Overall (STATE)
- 87 Strongly Landlord-Friendly
- State Texas
- 87 Strongly Landlord-Friendly · R+5
- County
- — inherits STATE
- City
- — inherits STATE
ZIP-level market 77048
- Home prices YoY
- 1.0%
- Rents YoY
- 1.2%
- Active inventory
- 303
- Price-to-rent
- 6.9×
Monthly cashflow live
- Estimated rent
- $1,570 high interval (Pro) →
- Mortgage (P&I)
- −$682
- Tax from tax record
- −$194 /mo · $2,331/yr
- Insurance
- −$54
- Flood insurance flood zone
- −$66 /mo · $798/yr
- HOA
- −$0
- Vacancy / Maint / Mgmt
- −$330
- Net cashflow
- $244
Break-even live
UW: 25.0% down · 7.5% · 30yr · 1.5% tax · 5.0% vac · 8.0% maint · 8.0% mgmt
Financing live
Cash to close
- Down payment
- $32,500
- Closing costs
- $3,900
- Reserves months
- —
- Total cash needed
- —
Loan-product check · same deal, 3 products live
Conventional
25% down · 7.5% · 30yr
- Down + closing
- —
- Monthly P&I
- —
- Monthly cashflow
- —
- DSCR
- —
- Eligible?
- —
Personal DTI + credit; lowest rate.
DSCR
20% down · 8.5% · 30yr
- Down + closing
- —
- Monthly P&I
- —
- Monthly cashflow
- —
- DSCR
- —
- Eligible?
- —
No personal income docs; deal must DSCR.
Hard money
10% down · 12.0% · 12mo
- Down + closing
- —
- Monthly P&I
- —
- Monthly cashflow
- —
- DSCR
- —
- Eligible?
- —
Short-term bridge; refi at stabilization.
Rent comps 26 comps
| Address | Beds | Baths | Sqft | Rent | $/sqft | DOM | Units | Dist |
|---|---|---|---|---|---|---|---|---|
| 12227 Cape Hyannis Dr Houston, TX | 3.0 | 2.0 | 1432 | $1,705 | $1.19 | 14d | 1 | 0.45mi |
| 5425 E Orem Dr Houston, TX | 1.0–4.0 | 1.0–2.0 | 1040 | $1,472 | $1.42 | 4d | 13 | 0.47mi |
| 11917 Martin Luther King Blvd Houston, TX | 2.0 | 1.0 | 805 | $1,025 | $1.27 | 22d | 1 | 0.53mi |
| 11917 Martin Luther King Blvd Houston, TX | 2.0 | 1.0 | 805 | $1,025 | $1.27 | 18d | 1 | 0.53mi |
| 11911 Martin Luther King Junior Blvd Houston, TX | 1.0–2.0 | 1.0 | 701 | $1,050 | $1.50 | 7d | 1 | 0.62mi |
| 11319 Murr Way Houston, TX | 3.0 | 1.5 | 1213 | $1,699 | $1.40 | 18d | 1 | 0.84mi |
| 5602 Selinsky Rd Unit 422 Houston, TX | 2.0 | 2.0 | 1062 | $1,089 | $1.03 | 7d | 1 | 0.90mi |
| 5602 Selinsky Rd Unit 421 Houston, TX | 2.0 | 2.0 | 1062 | $1,089 | $1.03 | 5d | 1 | 0.90mi |
| 5602 Selinsky Rd Unit 5659 Houston, TX | 2.0 | 2.0 | 1062 | $1,113 | $1.05 | 11d | 1 | 0.90mi |
| 5602 Selinsky Rd Unit 510 Houston, TX | 3.0 | 2.0 | 1167 | $1,313 | $1.13 | 11d | 1 | 0.90mi |
| 5602 Selinsky Rd Unit 3187 Houston, TX | 3.0 | 2.0 | 1167 | $1,281 | $1.10 | 3d | 1 | 0.90mi |
| 5602 Selinsky Rd Unit 2187 Houston, TX | 2.0 | 2.0 | 1062 | $1,081 | $1.02 | 3d | 1 | 0.90mi |
| 5602 Selinsky Rd Unit 3047 Houston, TX | 3.0 | 2.0 | 1167 | $1,324 | $1.13 | 11d | 1 | 0.90mi |
| 5602 Selinsky Rd Unit 2047 Houston, TX | 2.0 | 2.0 | 1062 | $1,113 | $1.05 | 3d | 1 | 0.90mi |
| 13555 Cullen Blvd Houston, TX | 1.0–3.0 | 1.0–2.0 | 917 | $1,900 | $2.07 | 43d | 35 | 0.97mi |
| 3918 Almeda-Genoa Rd Houston, TX | 1.0–3.0 | 1.0–2.0 | 1038 | $2,220 | $2.14 | 1d | 26 | 0.99mi |
| 13561 Cullen Blvd Houston, TX | 2.0 | 2.0 | 990 | $1,450 | $1.46 | 43d | 1 | 0.99mi |
| 4015 Marchant Rd Houston, TX | 3.0 | 2.0 | 1200 | $1,700 | $1.42 | 43d | 1 | 1.02mi |
| 13427 Lucky Bill Ln Houston, TX | 3.0 | 2.5 | 1443 | $2,095 | $1.45 | 7d | 1 | 1.06mi |
| 5426 Greylog Dr Houston, TX | 3.0 | 2.0 | 1205 | $1,750 | $1.45 | 24d | 1 | 1.08mi |
| 13442 Lucky Bill Ln Houston, TX | 3.0 | 2.0 | 1427 | $2,195 | $1.54 | 22d | 1 | 1.10mi |
| 11819 Leitrim Way Houston, TX | 3.0 | 1.0 | 1476 | $1,150 | $0.78 | 5d | 1 | 1.13mi |
| 4322 Groton Dr Houston, TX | 3.0 | 1.0 | 858 | $1,395 | $1.63 | 43d | 1 | 1.26mi |
| 10902 Faircroft Dr Houston, TX | 3.0 | 1.0 | 1308 | $1,480 | $1.13 | 43d | 1 | 1.29mi |
| 13958 Cottingham St Houston, TX | 1.0–2.0 | 1.0–2.0 | 1048 | $1,825 | $1.74 | 2d | 35 | 1.33mi |
| 4071 Schurmier Rd Unit SLC2 Houston, TX | 2.0 | 2.0 | 990 | $1,575 | $1.59 | 3d | 1 | 1.33mi |
Listing history 10 events
-
2026-06-18days on market $130,000 Active 14 DOM
-
2026-06-17days on market $130,000 Active 13 DOM
-
2026-06-16days on market $130,000 Active 12 DOM
-
2026-06-15days on market $130,000 Active 11 DOM
-
2026-06-13days on market $130,000 Active 9 DOM
-
2026-06-10days on market $130,000 Active 5 DOM
-
2026-06-08days on market $130,000 Active 4 DOM
-
2026-06-07days on market $130,000 Active 3 DOM
-
2026-06-04remarks 103-char remark
-
2026-06-04$130,000 Active 1 DOM
ⓘ Source: listings_history table (triggers on properties + properties_extension) + one-shot
backfill from property_details.listing_events for pre-trigger history.
Tax reassessment forecast TX · Resets to sale price
- Current annual tax
- $2,331 · $194/mo
- Projected year-2 tax
- $2,379 · $198/mo
- Expected delta
- +$48/yr (+$4/mo · 2.0%)
ⓘ Screening estimate from a state-policy table — verify with the county assessor before closing.
Climate risk First Street
- Flood 7/10 Severe FEMA zone X (unshaded) · 99% chance over 30 yrs
- Wildfire 1/10 Low
- Heat 9/10 Extreme 7 d/yr ≥108°F today · 25 d/yr by 30 yrs out
- Wind 9/10 Extreme 99% chance of damaging wind over 30 yrs
- Air quality 2/10 Low 1 unhealthy d/yr today · 2 by 30 yrs out
Nearby sold comps map
Loading sold comps map…
Walkable amenities ~0.75 mi
Loading nearby amenities…
Taxation est. · year 1
- Rental income
- $18,843
- − Mortgage interest
- −$7,282
- − Property taxes
- −$2,331
- − Insurance
- −$1,448
- − Repairs & maintenance
- −$1,507
- − Management
- −$1,507
- − Depreciation
- −$3,782
- Taxable income
- $985
- Est. tax owed @ 24.0%
- −$237
- After-tax cash flow
- $2,690/yr
For passive investors: Depreciation is non-cash, so a rental often shows a tax loss while cash-flowing — sheltering income. Rental losses are passive: they offset passive income freely, and up to $25,000/yr can offset ordinary (W-2) income if you actively participate and your MAGI is under $100k (phasing out to $0 by $150k); unused losses carry forward. On sale, claimed depreciation is recaptured at up to 25%, and gains may owe capital-gains tax (a 1031 exchange can defer both). Figures are a year-1 estimate at your 24.0% rate — not tax advice; consult a CPA.
Schools (NCES district)
- District
- Houston ISD
- NCES district ID
- 4823640
- Math proficiency
- 27% ▼ -18.00%
- Reading proficiency
- 35% ▼ -6.00%
- Median HH income
- $46,054
- Composite
- 26.63/100
- National rank
- #7173
- State rank
- #593 of 826 in TX
Livability — Houston
- Score
- 74/100
- State rank
- #184
- US rank
- #4771
Category grades
Schools grade is shown separately in the Schools card above.
Census & demographics
- Census place
- Houston, TX
- County
- Harris County · 4,702,590 people
- City population
- 3,226,434
- Metro
- Houston-The Woodlands-Sugar Land, TX
- Population (ZIP)
- 21,151
- Household income
- $56,747
- Rent vs Own
- Severe rent burden
- 1117.0
Population outlook (Harris County) Hauer SSP2
- Today (2025)
- 5,571,493 people
- By 2030
- 6,089,821 · +9.3%
- By 2040
- 7,142,806 · +28.2%
- By 2050
- 8,185,864 · +46.9%
- By 2075
- 10,574,329 · +89.8%
- By 2100
- 12,109,958 · +117.4%
Race, ethnicity, and origin ACS 2023
- Neighborhood character
- Predominantly Black (69%)
- Race & ethnicity
- Black 69% Hispanic / Latino 24% Two or more races 6% Asian 3% White 2%
- Hispanic origin (detail)
- Mexican 17% Puerto Rican 1%
- Foreign-born
- 12% · Canada, Vietnam
- Languages at home
- 76% English-only · Spanish 20% Tagalog/Filipino 2% Vietnamese 1%
Political lean MEDSL · Harris
- 2024 margin
- Lean D (+5.5) · D 52.0% · R 46.4% · Other 1.6%
- 2008→2024 swing
- +3.9pp toward D · 2008: 1.6pp · 2024: 5.5pp
- All cycles
- 2024: D+5.5 2020: D+13.3 2016: D+12.4 2012: D+0.1 2008: D+1.6
Not yet ingested
- Civics
- —
Market trends
- HPI YoY
- ▲ 2.61%
- Current HPI
- 266.4468
- Rent YoY
- ▲ 1.17%
- Metro
- Houston-The Woodlands-Sugar Land, TX
- State GDP YoY
- ▲ 3.95%
- F500 in state
- 110
Industry mix (Fortune 500 HQ in TX)
| Industry | F500 HQs | Revenue |
|---|---|---|
| Energy | 16 | $1,198B |
|
||
| Technology | 5 | $198B |
|
||
| Engineering / Construction | 4 | $72B |
|
||
| Energy Services | 3 | $60B |
|
||
| Utilities | 3 | $41B |
|
||
| Healthcare | 2 | $330B |
|
||
Price history
4 events — show timeline
- 2026-06-04 Listed $130,000 ForSaleByOwner.com
- 2026-05-12 Listing Removed — HARMLS
- 2026-05-11 Coming Soon — HARMLS
- 1988-01-02 Sold (Public Records) — Public Records
Property tax history
+2.1%/yrLatest (2025): $2,331 · +11.7% YoY. Source: county tax records.
Cash-flow waterfall
monthlySold comps — $/sqft
last 12 mo · ≤1 miLoading sold comps…