 🏗️ New Construction
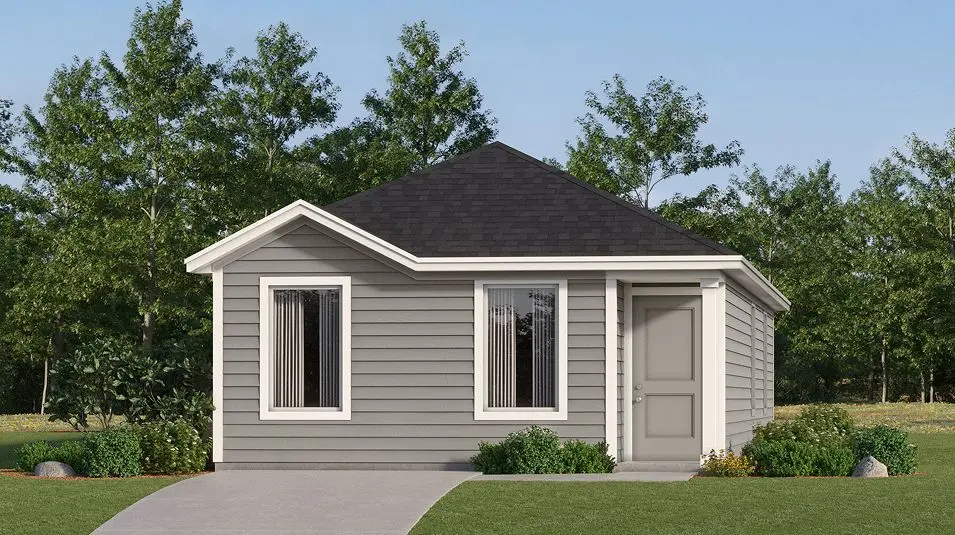
Windrow Plan · San Antonio, TX
Flood risk No data
- FEMA flood zone
- —
- Chance of flooding over 30 yrs
- —
- Est. flood insurance / yr
- —
Fire risk No data
- Est. fire insurance / yr
- —
Heat risk No data
- Hot days now (above threshold)
- —
- Hot days in 30 yrs
- —
Wind risk No data
- Chance of severe wind over 30 yrs
- —
Air-quality risk No data
- Unhealthy air days now
- —
- Unhealthy air days in 30 yrs
- —
Risk factors via First Street. Map © Google.
Why this score? — see what drove the D- grade
The composite is a weighted blend of 9 inputs, each scored 0–100. Each bar is that input's sub-score; the figure is the points it added to the 100-point composite (weight × sub-score).
- Cash flow +10.0/30.0
- ARV discount +7.5/15.0
- Schools +4.4/10.0
- Livability +4.0/5.0
- Condition / age +4.0/5.0
- 1% rule +3.0/10.0
- DSCR +2.8/10.0
- Rent growth +1.7/5.0
- Appreciation +0.0/10.0
$165,999
🖨 Deal sheet 📄 Offer letter ✓ Due diligence
Listing remarks MLS
This single-level home showcases a spacious open floorplan shared between the kitchen, dining area and family room for easy entertaining during gatherings. An owner's suite enjoys a private location in the back of the home, complemented by an en-suite bathroom, walk-in closet and direct access to the backyard space. There are two secondary bedrooms that are both ideal for household members and overnight guests.
Key facts
- Walk-in closet
- Open floorplan
- En-suite bathroom
Tags
Neighborhood map
What this means for you Summary
Snapshot
- This is a 3-bed/2.0-bath single-family listed at $166k. Condition is rated good.
Deal economics
- At list price, monthly cash flow is $-128 ($-2k/yr) — negative.
- The deal already cash-flows at list — no discount required.
- Meets the 1% rule at list price ($2k rent vs $166k).
- Recommended offer: $146k (12.0% below list) — sets the bar for market timing.
- Cap rate 5.6% vs local median 3.8% in San Antonio — top-decile yield for the area; either an underpriced asset or a hidden risk that comps aren't pricing in. Stress-test before assuming the spread holds.
Location & tenants
- Location reads 80/100 on livability (#31 in TX, #1,616 nationally) — a professional / high-income tenant draw. Strengths: amenities A+, commute A+, cost of living A+; Watch: schools C-, crime F.
- Medina Valley ISD (rural): math 48% / reading 53% proficiency, ranked #148 of 826 in TX (top 18%) — acceptable for families but not a draw, mixed tenant base, ~2y average lease.
- Market conditions: Rents falling (-3.0%/yr); 1133 active listings in the ZIP; 9 comparable units currently listed for rent nearby; rentals at typical pace (median 24d on market — plan ~3-4 weeks tenant-placement turnaround); solid renter incomes; 8,308 units permitted in Bexar County in 2024 (2,506 in 5+ unit buildings).
Forward outlook
- Local home prices are declining (-3.0%/yr); year-one equity from $1k of loan paydown is wiped out by about $6k of value loss. Plan a longer hold.
- Bexar County population projected at +50% by 2050 — long-run rental-demand tailwind backs the buy-and-hold thesis.
Negotiation context
- It's been on market 496 days — a 12% lower offer ($146k) is reasonable based on typical stale-listing flexibility.
Questions for the listing agent
- What do current leases actually rent for vs. the listed asking? Can we see a recent rent roll and the last 12 months of T-12 income?
- It's been on market 496 days. Have you received any prior offers? Is the seller open to a 12% concession, seller financing, or rate buy-down credit?
- Why hasn't it sold? Are there any deal-killer items the seller is aware of (foundation, flood, title, zoning, code violations)?
- Is there a deadline driving the sale (1031 exchange, divorce, estate, relocation)? That informs how much negotiation room exists.
- Crime grade is F in this area — have there been break-ins, vandalism, or insurance claims at this property in the last 3 years? What carrier currently insures it and at what premium?
- The area grade is low — what's the realistic commute time and amenity access for the typical tenant pool here? Any planned neighborhood developments (good or bad) we should know about?
- What's the average days-on-market for RENTAL listings here right now (not sales)? A rising rental-DOM trend means longer vacancies and softer asking-rent achievability than the comps imply.
- What's the recent tenant-quality profile in this submarket — average credit score on applications, eviction rate, late-payment / NSF rate, and stable-employment percentage? A property-management company in the area should have these aggregated.
- How much new for-sale + rental construction is in the pipeline within 1–3 miles? Heavy new supply typically softens prices + rents 12–24 months out; constrained supply supports both.
Investment metrics
- 1% rule
- 0.80% ✗
- Cap rate
- 5.56%
- Cash-on-cash
- -2.61%
- DSCR
- 0.88
- GRM
- 10.4
CMA / ARV
- ARV (median comp)
- $210,156
- List price
- $165,999
- Delta
- -21.01%
- Verdict
- UNDERPRICED
- Comps
- 20 within 1.0 mi
Show comp detail 12 sales within ~0.75 mi
| Address | Dist | Beds/Ba | Sqft | Sold | Price | $/sf | Match |
|---|---|---|---|---|---|---|---|
| 3911 Millbrook Way | 0.35mi | 3/2.0 | 1,033 (0%) | 5mo | $175,999 | $170 | 79 |
| 3842 Glade Crk | 0.37mi | 3/2.0 | 1,033 (0%) | 4mo | $168,999 | $164 | 79 |
| 3915 Millbrook Way | 0.35mi | 3/2.0 | 1,049 (+2%) | 4mo | $173,999 | $166 | 77 |
| 3734 Rock Mill Dm | 0.30mi | 3/2.0 | 1,033 (0%) | 11mo | $172,599 | $167 | 77 |
| 3830 Glade Crk | 0.38mi | 3/2.0 | 1,033 (0%) | 7mo | $166,999 | $162 | 76 |
| 3907 Millbrook Way | 0.35mi | 3/2.0 | 1,049 (+2%) | 6mo | $177,999 | $170 | 76 |
| 3718 Rock Mill Dm | 0.30mi | 3/2.0 | 1,033 (0%) | 12mo | $171,999 | $167 | 76 |
| 3806 Glade Crk | 0.41mi | 3/2.0 | 1,033 (0%) | 7mo | $168,999 | $164 | 75 |
| 3802 Glade Crk | 0.42mi | 3/2.0 | 1,049 (+2%) | 7mo | $178,999 | $171 | 72 |
| 3710 Glade Crk | 0.53mi | 3/2.0 | 1,033 (0%) | 7mo | $165,999 | $161 | 69 |
| 3414 Rock Mill Dm | 0.61mi | 3/2.0 | 1,033 (0%) | 11mo | $161,999 | $157 | 62 |
| 3406 Rock Mill Dm | 0.61mi | 3/2.0 | 1,033 (0%) | 11mo | $213,999 | $207 | 62 |
Match score weights: distance 35% · size 25% · config 20% · recency 20%. Top-matched comps best support the ARV.
Projected returns pro-forma
-3.0% appreciation · 0.0% rent growth · sell at horizon
- IRR
- -24.0%
- Equity multiple
- 0.20×
- Total profit
- $-47,082
- Equity at exit
- $31,335
- IRR
- -30.8%
- Equity multiple
- -0.20×
- Total profit
- $-70,366
- Equity at exit
- $18,170
Cash invested: $58,844 (down + closing). Projections, not guarantees.
Landlord ↔ Tenant lean methodology
- Overall (STATE)
- 87 Strongly Landlord-Friendly
- State Texas
- 87 Strongly Landlord-Friendly · R+5
- County
- — inherits STATE
- City
- — inherits STATE
ZIP-level market 78245
- Home prices YoY
- -18.5%
- Rents YoY
- -3.0%
- Active inventory
- 1133
- Price-to-rent
- 8.3×
Monthly cashflow live
- Estimated rent
- $1,677 high interval (Pro) →
- Mortgage (P&I)
- −$1,102
- Tax est. 1.5%
- −$263 /mo · $3,152/yr
- Insurance
- −$88
- HOA
- −$0
- Vacancy / Maint / Mgmt
- −$352
- Net cashflow
- $-128
Break-even live
UW: 25.0% down · 7.5% · 30yr · 1.5% tax · 5.0% vac · 8.0% maint · 8.0% mgmt
Financing live
Cash to close
- Down payment
- $52,539
- Closing costs
- $6,305
- Reserves months
- —
- Total cash needed
- —
Loan-product check · same deal, 3 products live
Conventional
25% down · 7.5% · 30yr
- Down + closing
- —
- Monthly P&I
- —
- Monthly cashflow
- —
- DSCR
- —
- Eligible?
- —
Personal DTI + credit; lowest rate.
DSCR
20% down · 8.5% · 30yr
- Down + closing
- —
- Monthly P&I
- —
- Monthly cashflow
- —
- DSCR
- —
- Eligible?
- —
No personal income docs; deal must DSCR.
Hard money
10% down · 12.0% · 12mo
- Down + closing
- —
- Monthly P&I
- —
- Monthly cashflow
- —
- DSCR
- —
- Eligible?
- —
Short-term bridge; refi at stabilization.
Rent comps 9 comps
| Address | Beds | Baths | Sqft | Rent | $/sqft | DOM | Units | Dist |
|---|---|---|---|---|---|---|---|---|
| 3919 Gristmill Way San Antonio, TX | 3.0 | 2.0 | 1469 | $1,545 | $1.05 | 23d | 1 | 0.15mi |
| 3833 Millbrook Way San Antonio, TX | 3.0 | 2.0 | 1235 | $1,497 | $1.21 | 21d | 1 | 0.39mi |
| 3704 Millbrook Way San Antonio, TX | 2.0 | 2.5 | 1013 | $1,800 | $1.78 | 43d | 1 | 0.52mi |
| 3650 Millbrook Way San Antonio, TX | 3.0 | 2.0 | 1129 | $1,497 | $1.33 | 23d | 1 | 0.56mi |
| 3651 Millbrook Way San Antonio, TX | 4.0 | 2.0 | 1500 | $1,500 | $1.00 | 23d | 1 | 0.57mi |
| 14360 W Grosenbacher Rd San Antonio, TX | 1.0–3.0 | 1.0–2.0 | 973 | $1,994 | $2.05 | 1d | 20 | 0.62mi |
| 3614 Millbrook Way San Antonio, TX | 3.0 | 2.0 | 1300 | $1,548 | $1.19 | 14d | 1 | 0.63mi |
| 5022 Flight Sail San Antonio, TX | 3.0 | 2.0 | 1300 | $1,700 | $1.31 | 23d | 1 | 1.02mi |
| 5525 Mansions Blfs San Antonio, TX | 3.0 | 1.0–2.0 | 869 | $1,613 | $1.86 | 1d | 48 | 1.36mi |
Listing history 17 events
-
2026-06-18days on market $165,999 Active 496 DOM
-
2026-06-17days on market $165,999 Active 495 DOM
-
2026-06-16days on market $165,999 Active 494 DOM
-
2026-06-15days on market $165,999 Active 493 DOM
-
2026-06-13days on market $165,999 Active 491 DOM
-
2026-06-09days on market $165,999 Active 487 DOM
-
2026-06-08days on market $165,999 Active 486 DOM
-
2026-06-07days on market $165,999 Active 485 DOM
-
2026-06-04days on market $165,999 Active 482 DOM
-
2026-06-03days on market $165,999 Active 481 DOM
-
2026-06-02pricedays on market $165,999 Active 480 DOM
-
2026-06-02days on market $166,999 Active 479 DOM
-
2026-05-31pricedays on market $166,999 Active 478 DOM
-
2025-08-24price $169,999 414-char remark
Show marketing remark (414 chars)
This single-level home showcases a spacious open floorplan shared between the kitchen, dining area and family room for easy entertaining during gatherings. An owner's suite enjoys a private location in the back of the home, complemented by an en-suite bathroom, walk-in closet and direct access to the backyard space. There are two secondary bedrooms that are both ideal for household members and overnight guests.
-
2025-07-17price $183,999 414-char remark
Show marketing remark (414 chars)
This single-level home showcases a spacious open floorplan shared between the kitchen, dining area and family room for easy entertaining during gatherings. An owner's suite enjoys a private location in the back of the home, complemented by an en-suite bathroom, walk-in closet and direct access to the backyard space. There are two secondary bedrooms that are both ideal for household members and overnight guests.
-
2025-05-15price $193,999 414-char remark
Show marketing remark (414 chars)
This single-level home showcases a spacious open floorplan shared between the kitchen, dining area and family room for easy entertaining during gatherings. An owner's suite enjoys a private location in the back of the home, complemented by an en-suite bathroom, walk-in closet and direct access to the backyard space. There are two secondary bedrooms that are both ideal for household members and overnight guests.
-
2025-02-08$194,999 Active 414-char remark
Show marketing remark (414 chars)
This single-level home showcases a spacious open floorplan shared between the kitchen, dining area and family room for easy entertaining during gatherings. An owner's suite enjoys a private location in the back of the home, complemented by an en-suite bathroom, walk-in closet and direct access to the backyard space. There are two secondary bedrooms that are both ideal for household members and overnight guests.
ⓘ Source: listings_history table (triggers on properties + properties_extension) + one-shot
backfill from property_details.listing_events for pre-trigger history.
Nearby sold comps map
Loading sold comps map…
Walkable amenities ~0.75 mi
Loading nearby amenities…
Taxation est. · year 1
- Rental income
- $20,120
- − Mortgage interest
- −$11,772
- − Property taxes
- −$3,152
- − Insurance
- −$1,051
- − Repairs & maintenance
- −$1,610
- − Management
- −$1,610
- − Depreciation
- −$6,114
- Taxable loss
- −$5,188
- Est. tax savings @ 24.0%
- +$1,245
- After-tax cash flow
- $-288/yr
For passive investors: Depreciation is non-cash, so a rental often shows a tax loss while cash-flowing — sheltering income. Rental losses are passive: they offset passive income freely, and up to $25,000/yr can offset ordinary (W-2) income if you actively participate and your MAGI is under $100k (phasing out to $0 by $150k); unused losses carry forward. On sale, claimed depreciation is recaptured at up to 25%, and gains may owe capital-gains tax (a 1031 exchange can defer both). Figures are a year-1 estimate at your 24.0% rate — not tax advice; consult a CPA.
Condition & rehab AI · 12 photos
This single-family home is in good condition with a good condition score of 80. It has a good exterior, interior walls, and flooring. The home is move-in ready with minor cosmetic updates that can increase its value.
Value-add opportunities
- Resale Paint exterior siding — Enhances curb appeal and can add value
- Both Replace carpet in bedrooms — Improves comfort and can increase both resale and rental value
- Both Install smart home devices — Enhances convenience and can attract tech-savvy buyers
Renovation cost estimate screening
Value-add ROI direction
- Resale Paint exterior siding — Enhances curb appeal and can add value ↑
- Both Replace carpet in bedrooms — Improves comfort and can increase both resale and rental value ↑
- Both Install smart home devices — Enhances convenience and can attract tech-savvy buyers ↑
ⓘ Cost ranges are severity-bucket heuristics (US national rule-of-thumb). Get contractor quotes + a written scope before underwriting a rehab budget.
Schools (NCES district)
- District
- Medina Valley ISD
- NCES district ID
- 4830060
- Math proficiency
- 48% ▼ -9.00%
- Reading proficiency
- 53% ▼ -2.00%
- Median HH income
- $60,596
- Composite
- 44.2/100
- National rank
- #2851
- State rank
- #148 of 826 in TX
Livability — San Antonio
- Score
- 80/100
- State rank
- #31
- US rank
- #1616
Category grades
Schools grade is shown separately in the Schools card above.
Census & demographics
- County
- Bexar County · 1,990,555 people
- City population
- 1,806,925
- Metro
- San Antonio-New Braunfels, TX
- Population (ZIP)
- 96,015
- Household income
- $90,029
- Rent vs Own
- Severe rent burden
- 2466.0
Population outlook (Bexar County) Hauer SSP2
- Today (2025)
- 2,336,851 people
- By 2030
- 2,560,728 · +9.6%
- By 2040
- 3,020,569 · +29.3%
- By 2050
- 3,493,522 · +49.5%
- By 2075
- 4,668,459 · +99.8%
- By 2100
- 5,533,242 · +136.8%
Race, ethnicity, and origin ACS 2023
- Neighborhood character
- Majority Hispanic (64%)
- Race & ethnicity
- Hispanic / Latino 64% Two or more races 27% White 20% Black 9% Asian 2%
- Hispanic origin (detail)
- Mexican 53% Puerto Rican 2%
- Common ancestry
- Slovak 1% Lithuanian 1% Romanian 1%
- Foreign-born
- 9% · Canada, Vietnam
- Languages at home
- 66% English-only · Spanish 30% Arabic 1% Tagalog/Filipino 1%
Political lean MEDSL · Bexar
- 2024 margin
- Lean D (+9.8) · D 54.3% · R 44.6% · Other 1.1%
- 2008→2024 swing
- +4.2pp toward D · 2008: 5.6pp · 2024: 9.8pp
- All cycles
- 2024: D+9.8 2020: D+18.2 2016: D+13.5 2012: D+4.6 2008: D+5.6
Not yet ingested
- Civics
- —
Market trends
- HPI YoY
- ▼ -53.31%
- Current HPI
- 234.7931
- Rent YoY
- ▼ -3.02%
- Metro
- San Antonio-New Braunfels, TX
- State GDP YoY
- ▲ 3.95%
- F500 in state
- 110
Industry mix (Fortune 500 HQ in TX)
| Industry | F500 HQs | Revenue |
|---|---|---|
| Energy | 16 | $1,198B |
|
||
| Technology | 5 | $198B |
|
||
| Engineering / Construction | 4 | $72B |
|
||
| Energy Services | 3 | $60B |
|
||
| Utilities | 3 | $41B |
|
||
| Healthcare | 2 | $330B |
|
||
Price history
-12.8% since first listed4 events — show timeline
- 2025-08-24 Price Changed $169,999 Zillow
- 2025-07-17 Price Changed $183,999 Zillow
- 2025-05-15 Price Changed $193,999 Zillow
- 2025-02-08 Listed $194,999 Zillow
Cash-flow waterfall
monthlySold comps — $/sqft
last 12 mo · ≤1 miLoading sold comps…