1254 Marion St · St. Paul, MN
Flood risk 6/10 · Moderate
- FEMA flood zone
- X (unshaded)
- Chance of flooding over 30 yrs
- 0.73%
- Est. flood insurance / yr
- $473 – $860
Fire risk 1/10 · Minimal
- Est. fire insurance / yr
- $888 – $1,650
Heat risk 2/10 · Minimal
- Hot days now (above 99°F)
- 7 days/yr
- Hot days in 30 yrs
- 14 days/yr
Wind risk 2/10 · Minimal
- Chance of severe wind over 30 yrs
- —
Air-quality risk 2/10 · Minimal
- Unhealthy air days now
- 1 days/yr
- Unhealthy air days in 30 yrs
- 1 days/yr
Risk factors via First Street. Map © Google.
Why this score? — see what drove the F grade
The composite is a weighted blend of 9 inputs, each scored 0–100. Each bar is that input's sub-score; the figure is the points it added to the 100-point composite (weight × sub-score).
- ARV discount +7.5/15.0
- Cash flow +6.4/30.0
- Rent growth +3.4/5.0
- Livability +2.5/5.0
- Condition / age +2.5/5.0
- Schools +2.4/10.0
- 1% rule +1.7/10.0
- DSCR +0.7/10.0
- Appreciation +0.0/10.0
$245,000
🖨 Deal sheet (PDF) 📄 Offer letter ✓ Due diligence
Listing remarks MLS
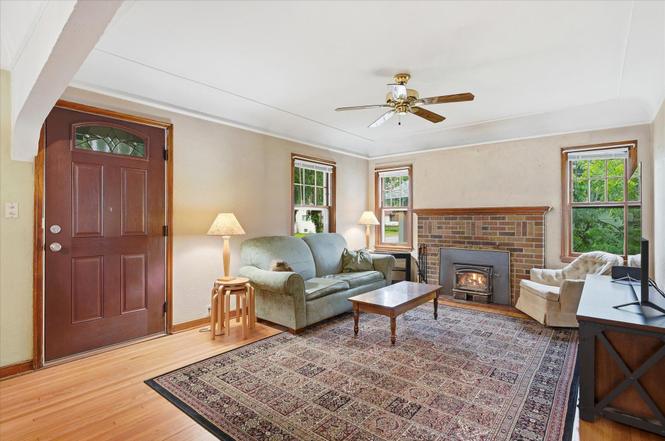
Sun filled 1.5 story home featuring oak hardwood floors, cove ceilings, wood burning fireplace in the living room/dining room, expanded kitchen with newer flooring, solid surface countertops and complementary ceramic tile backsplash. The kitchen also includes informal dining space with french doors leading to an entertainment size deck and deep lot with a privacy fence and access to the heated 3 car garage!!
Key facts
- Insulated garage
- Spacious kitchen
- Cozy fireplace
Tags
Property features AI
Finance
- Other: Lot approximately 0.152 acres (dimensions about 43x154)
- Financial info: Conventional mortgage available
Exterior
- Parking: Heated, insulated garage with garage door opener; Detached/attached 3-car garage (dimensions approximately 27x30)
- Utilities: City water; City sewer; Natural gas; 100 amp electrical service with circuit breakers
- Home design: Residential property; One and one-half levels; Main-level living area and upper-level bedrooms
- Construction: Block construction; Block foundation; Pitched roof (age over 8 years)
- Exterior features: Vinyl exterior; Deck; Full wood privacy fence; Medium tree coverage; Public transit within 6 blocks; City street frontage with sidewalks and street lights
Interior
- Kitchen: Dishwasher; Range; Microwave; Refrigerator; Eat-in kitchen with breakfast area and separate/formal dining room
- Bedrooms: 3 bedrooms (one bedroom on the main floor; two bedrooms on the upper level)
- Flooring: Hardwood floors
- Bathrooms: Main floor full bath (1 full bathroom total)
- Heating & cooling: Forced air heating; Central air conditioning
- Interior features: Ceiling fan(s); Kitchen window; Natural woodwork; Main floor primary bedroom; Partially finished basement; Wood-burning fireplace with insert in the living room
- Laundry & utility: Washer and dryer; Laundry located in the basement
Neighborhood map
What this means for you Summary
Snapshot
- This is a 3-bed/1.0-bath single-family listed at $245k.
Deal economics
- At list price, monthly cash flow is $-429 ($-5k/yr) — negative.
- To cash-flow at today's rent, offer at most $169k (30.9% below list).
- To meet the 1% rule (rent ≥ 1% of price), the offer needs to be $164k (32.9% below list).
- Recommended offer: $164k (32.9% below list) — sets the bar for 1% rule.
Location & tenants
- Location reads: area grade F — affects rentability + tenant quality, not the cash-flow math above.
- St. Paul Public School District (urban): math 21% / reading 33% proficiency, ranked #270 of 301 in MN (top 90%) — low school quality limits family demand, transient renter base, plan for 1-2y turnover; 64% free/reduced lunch — lower-income household profile, screen leases tightly.
- Zoned schools: Paul & Sheila Wellstone Elementary (math 8% / reading 17%, grade F, #800 of 857 statewide, top 95%, 507 students, 85% FRL); Murray Middle School (math 19% / reading 40%, grade F, #204 of 258 statewide, top 80%, 538 students, 64% FRL); Como Park Senior High (math 8% / reading 42%, grade F, #375 of 471 statewide, top 81%, 1,078 students, 75% FRL).
- Market conditions: Rents rising (+3.6%/yr); 175 active listings in the ZIP; 5 comparable units currently listed for rent nearby; rentals at typical pace (median 26d on market — plan ~3-4 weeks tenant-placement turnaround); 40% of comp listings sitting > 30 days — soft ceiling on asking rent; 1,202 units permitted in Ramsey County in 2024 (880 in 5+ unit buildings).
Forward outlook
- Local home prices are declining (-3.0%/yr); year-one equity from $2k of loan paydown is wiped out by about $7k of value loss. Plan a longer hold.
- Ramsey County population projected at +27% by 2050 — long-run rental-demand tailwind backs the buy-and-hold thesis.
Negotiation context
- Only 2 days on market — expect competitive offers; lowballing is unlikely to land.
- 2 sale attempts since 20y ago with the ask held roughly flat each time — persistent listings suggest the price (not the market) is what's stuck; bring a comps-based counter.
Risks & watch-outs
- Watch-outs: built in 1939 — expect roof / HVAC / electrical / plumbing capex.
- Climate carrying-cost: major flood risk — expect insurance premiums to compound above CPI over the hold.
Questions for the listing agent
- What do current leases actually rent for vs. the listed asking? Can we see a recent rent roll and the last 12 months of T-12 income?
- Built in 1939 — when were the roof, HVAC, electrical panel, plumbing, and water heater last replaced?
- Is there a deadline driving the sale (1031 exchange, divorce, estate, relocation)? That informs how much negotiation room exists.
- The area grade is low — what's the realistic commute time and amenity access for the typical tenant pool here? Any planned neighborhood developments (good or bad) we should know about?
- What's the average days-on-market for RENTAL listings here right now (not sales)? A rising rental-DOM trend means longer vacancies and softer asking-rent achievability than the comps imply.
- What's the recent tenant-quality profile in this submarket — average credit score on applications, eviction rate, late-payment / NSF rate, and stable-employment percentage? A property-management company in the area should have these aggregated.
- How much new for-sale + rental construction is in the pipeline within 1–3 miles? Heavy new supply typically softens prices + rents 12–24 months out; constrained supply supports both.
Investment metrics
- 1% rule
- 0.67% ✗
- Cap rate
- 4.19%
- Cash-on-cash
- -7.51%
- DSCR
- 0.67
- GRM
- 12.4
CMA / ARV
No comps found within radius.
Projected returns pro-forma
-3.0% appreciation · 3.6% rent growth · sell at horizon
- IRR
- -28.7%
- Equity multiple
- 0.04×
- Total profit
- $-65,987
- Equity at exit
- $36,530
- IRR
- -26.0%
- Equity multiple
- -0.29×
- Total profit
- $-88,317
- Equity at exit
- $21,183
Cash invested: $68,600 (down + closing). Projections, not guarantees.
Landlord ↔ Tenant lean methodology
- Overall (STATE)
- 46 Balanced
- State Minnesota
- 46 Balanced · D+2
- County
- — inherits STATE
- City
- — inherits STATE
ZIP-level market 55117
- Rents YoY
- 3.6%
- Active inventory
- 175
- Price-to-rent
- 12.4×
Monthly cashflow live
- Estimated rent
- $1,645 high interval (Pro) →
- Mortgage (P&I)
- −$1,285
- Tax from tax record
- −$342 /mo · $4,100/yr
- Insurance
- −$102
- HOA
- −$0
- Vacancy / Maint / Mgmt
- −$345
- Net cashflow
- $-429
Break-even live
Sensitivity live
| Price | -10% $-290 | -5% $-360 | +0% $-429 | +5% $-498 | +10% $-568 |
|---|---|---|---|---|---|
| Rent | -10% $-559 | -5% $-494 | +0% $-429 | +5% $-364 | +10% $-299 |
| Rate | -1.0pp $-306 | -0.5pp $-367 | base $-429 | +0.5pp $-493 | +1.0pp $-557 |
UW: 25.0% down · 7.5% · 30yr · 1.5% tax · 5.0% vac · 8.0% maint · 8.0% mgmt
Financing live
Cash to close
- Down payment
- $61,250
- Closing costs
- $7,350
- Reserves months
- —
- Total cash needed
- —
Loan-product check · same deal, 3 products live
Conventional
25% down · 7.5% · 30yr
- Down + closing
- —
- Monthly P&I
- —
- Monthly cashflow
- —
- DSCR
- —
- Eligible?
- —
Personal DTI + credit; lowest rate.
DSCR
20% down · 8.5% · 30yr
- Down + closing
- —
- Monthly P&I
- —
- Monthly cashflow
- —
- DSCR
- —
- Eligible?
- —
No personal income docs; deal must DSCR.
Hard money
10% down · 12.0% · 12mo
- Down + closing
- —
- Monthly P&I
- —
- Monthly cashflow
- —
- DSCR
- —
- Eligible?
- —
Short-term bridge; refi at stabilization.
Rent comps 5 comps
| Address | Beds | Baths | Sqft | Rent | $/sqft | DOM | Units | Dist |
|---|---|---|---|---|---|---|---|---|
| 195 Larpenteur Ave W Roseville, MN | 1.0–2.0 | 1.0 | 713 | $1,175 | $1.65 | 3d | 34 | 0.92mi |
| 1443 Saint Albans St N Saint Paul, MN | 4.0 | 2.0 | 1500 | $2,700 | $1.80 | 19d | 1 | 1.06mi |
| 321 Larpenteur Ave E Maplewood, MN | 1.0–2.0 | 1.0 | 755 | $1,250 | $1.66 | 45d | 2 | 1.43mi |
| 166 McCarrons Blvd N Saint Paul, MN | 2.0 | 1.0 | 900 | $1,247 | $1.39 | 46d | 1 | 1.47mi |
| 166 N McCarrons Blvd Unit 166-01 Roseville, MN | 2.0 | 1.0 | 900 | $1,144 | $1.27 | 26d | 1 | 1.47mi |
Listing history 2 events
-
2026-06-21remarks 683-char remark
-
2026-06-21$245,000 Coming Soon 2 DOM
ⓘ Source: listings_history table (triggers on properties + properties_extension) + one-shot
backfill from property_details.listing_events for pre-trigger history.
Tax reassessment forecast MN · Partial reset (capped growth)
- Current annual tax
- $4,100 · $342/mo
- Projected year-2 tax
- $4,100 · $342/mo
- Expected delta
- $0/yr ($0/mo · 0.0%)
ⓘ Screening estimate from a state-policy table — verify with the county assessor before closing.
Climate risk First Street
- Flood 6/10 Major FEMA zone X (unshaded) · 73% chance over 30 yrs
- Wildfire 1/10 Low
- Heat 2/10 Low 7 d/yr ≥99°F today · 14 d/yr by 30 yrs out
- Wind 2/10 Low
- Air quality 2/10 Low 1 unhealthy d/yr today · 1 by 30 yrs out
Nearby sold comps map
Loading sold comps map…
Walkable amenities ~0.75 mi
Loading nearby amenities…
Taxation est. · year 1
- Rental income
- $19,738
- − Mortgage interest
- −$13,724
- − Property taxes
- −$4,100
- − Insurance
- −$1,225
- − Repairs & maintenance
- −$1,579
- − Management
- −$1,579
- − Depreciation
- −$7,127
- Taxable loss
- −$9,596
- Est. tax savings @ 24.0%
- +$2,303
- After-tax cash flow
- $-2,847/yr
For passive investors: Depreciation is non-cash, so a rental often shows a tax loss while cash-flowing — sheltering income. Rental losses are passive: they offset passive income freely, and up to $25,000/yr can offset ordinary (W-2) income if you actively participate and your MAGI is under $100k (phasing out to $0 by $150k); unused losses carry forward. On sale, claimed depreciation is recaptured at up to 25%, and gains may owe capital-gains tax (a 1031 exchange can defer both). Figures are a year-1 estimate at your 24.0% rate — not tax advice; consult a CPA.
Schools (NCES district)
- District
- St. Paul Public School District
- NCES district ID
- 2733840
- Math proficiency
- 21% ▼ -11.00%
- Reading proficiency
- 33% ▼ -7.00%
- Median HH income
- $48,316
- Composite
- 23.51/100
- National rank
- #7868
- State rank
- #270 of 301 in MN
Livability — St. Paul
No livability data for this city. (Only ~50 U.S. cities are tracked.)
Census & demographics
- Census place
- St. Paul, MN
- County
- Ramsey County · 542,837 people
- City population
- 280,599
- Metro
- Minneapolis-St. Paul-Bloomington, MN-WI
- Population (ZIP)
- 44,697
- Household income
- $70,771
- Rent vs Own
- Severe rent burden
- 1588.0
Population outlook (Ramsey County) Hauer SSP2
- Today (2025)
- 603,431 people
- By 2030
- 636,459 · +5.5%
- By 2040
- 700,596 · +16.1%
- By 2050
- 765,819 · +26.9%
- By 2075
- 929,297 · +54.0%
- By 2100
- 1,053,924 · +74.7%
Race, ethnicity, and origin ACS 2023
- Neighborhood character
- Highly diverse neighborhood (Simpson 0.72)
- Race & ethnicity
- White 44% Asian 24% Black 15% Hispanic / Latino 10% Two or more races 10%
- Hispanic origin (detail)
- Mexican 7%
- Common ancestry
- Portuguese 6% Romanian 3% Lithuanian 2%
- Foreign-born
- 21% · Canada, Philippines, India
- Languages at home
- 68% English-only · Other Asian/Pacific 15% Spanish 8% Other Indo-European 2%
Political lean MEDSL · Ramsey
- 2024 margin
- Solid D (+43.3) · D 70.5% · R 27.2% · Other 2.3%
- 2008→2024 swing
- +9.4pp toward D · 2008: 33.9pp · 2024: 43.3pp
- All cycles
- 2024: D+43.3 2020: D+45.4 2016: D+39.4 2012: D+35.3 2008: D+33.9
Not yet ingested
- Civics
- —
Market trends
- HPI YoY
- ▼ -308.56%
- Current HPI
- 267.4216
- Rent YoY
- ▲ 3.60%
- Metro
- Minneapolis-St. Paul-Bloomington, MN-WI
- State GDP YoY
- ▲ 2.41%
- F500 in state
- 34
Industry mix (Fortune 500 HQ in MN)
| Industry | F500 HQs | Revenue |
|---|---|---|
| Healthcare | 2 | $407B |
|
||
| Retail | 2 | $150B |
|
||
| Consumer Goods | 2 | $32B |
|
||
| Industrial Machinery | 2 | $6B |
|
||
| Agriculture | 1 | $40B |
|
||
| Healthcare / Medical Devices | 1 | $32B |
|
||
Price history
+29.0% since first listed14 events — show timeline
- 2026-06-20 Coming Soon $245,000 NORTHSTARMLS as Distributed by MLS Grid
- 2022-03-24 Coming Soon — NORTHSTARMLS as Distributed by MLS Grid
- 2022-03-24 Listing Removed — NORTHSTARMLS as Distributed by MLS Grid
- 2021-11-24 Sold (Public Records) $220,000 Public Records
- 2021-11-17 Sold (MLS) $220,000 NORTHSTARMLS as Distributed by MLS Grid
- 2021-10-29 Pending — NORTHSTARMLS as Distributed by MLS Grid
- 2021-10-08 Price Changed $219,700 NORTHSTARMLS as Distributed by MLS Grid
- 2021-09-30 Price Changed $229,700 NORTHSTARMLS as Distributed by MLS Grid
- 2021-09-25 Listed $239,700 NORTHSTARMLS as Distributed by MLS Grid
- 2021-09-23 Coming Soon $239,700 NORTHSTARMLS as Distributed by MLS Grid
- 2006-10-16 Sold (Public Records) $190,800 Public Records
- 2006-09-29 Sold (MLS) $190,800 NORTHSTARMLS as Distributed by MLS Grid
- 2006-08-23 Listing Removed — NORTHSTARMLS as Distributed by MLS Grid
- 2006-06-29 Listed $189,900 NORTHSTARMLS as Distributed by MLS Grid
Property tax history
+6.9%/yrLatest (2025): $4,100 · +13.8% YoY. Source: county tax records.
Cash-flow waterfall
monthlySold comps — $/sqft
last 12 mo · ≤1 miLoading sold comps…