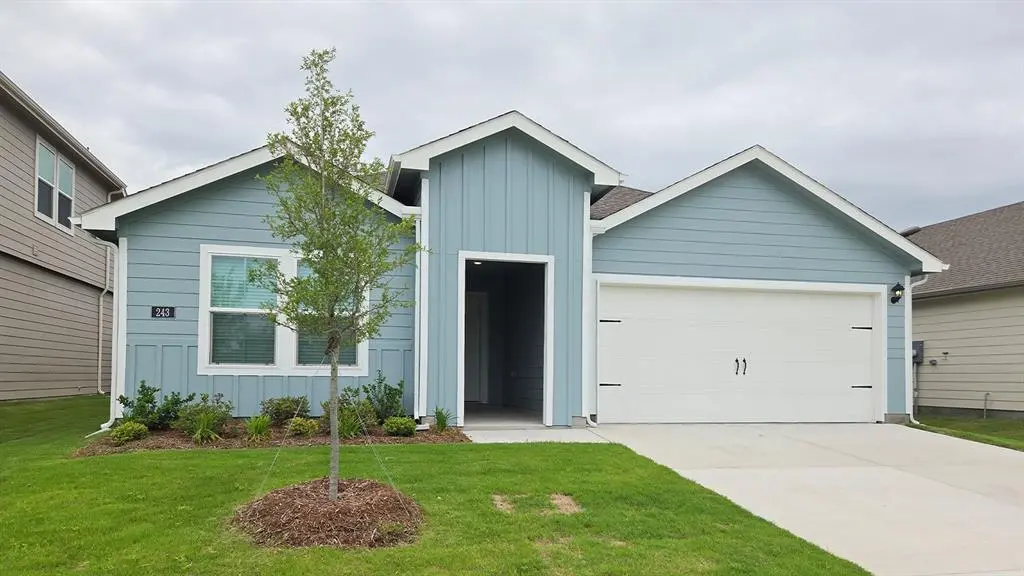
243 Desert Willow Way · Poetry, TX
Flood risk 1/10 · Minimal
- FEMA flood zone
- X (unshaded)
- Chance of flooding over 30 yrs
- 0.0%
- Est. flood insurance / yr
- $507 – $1,088
Fire risk 6/10 · Moderate
- Est. fire insurance / yr
- $1,222 – $2,270
Heat risk 7/10 · Major
- Hot days now (above 109°F)
- 7 days/yr
- Hot days in 30 yrs
- 22 days/yr
Wind risk 6/10 · Moderate
- Chance of severe wind over 30 yrs
- 27.0%
Air-quality risk 2/10 · Minimal
- Unhealthy air days now
- 1 days/yr
- Unhealthy air days in 30 yrs
- 1 days/yr
Risk factors via First Street. Map © Google.
Why this score? — see what drove the D grade
The composite is a weighted blend of 9 inputs, each scored 0–100. Each bar is that input's sub-score; the figure is the points it added to the 100-point composite (weight × sub-score).
- Cash flow +13.0/30.0
- ARV discount +7.3/15.0
- Condition / age +4.0/5.0
- 1% rule +3.9/10.0
- DSCR +3.9/10.0
- Schools +3.8/10.0
- Livability +2.5/5.0
- Rent growth +2.2/5.0
- Appreciation +0.0/10.0
$270,480
🖨 Deal sheet 📄 Offer letter ✓ Due diligence
Listing remarks
New! Spacious single story! Four bedrooms, two full baths, with open floor plan and covered patio. Home includes, island kitchen, granite counters throughout, LED lighting, full sprinkler system, professionally engineered post tension foundation, and much more! Discover the tranquility of Wildwood, a charming community nestled in the heart of Royse City. Surrounded by lush greenery and serene landscapes, this idyllic neighborhood offers a peaceful escape from the hustle and bustle of city life. Enjoy easy access to top-rated schools, parks, and shopping centers, making Wildwood the perfect place to call home. Enjoy the convenience of easy access to major highways, making it a breeze to com
Key facts
- Led lighting
- Island kitchen
- Covered patio
Tags
Property features AI
Finance
- Other: Possession at closing/funding or upon completion; Builder special listing condition
- Financial info: Seller will treat loan as clear (no second mortgage)
- HOA & community: Mandatory homeowners association; Semi-annual HOA fee (includes full use of facilities)
Exterior
- Parking: Attached 2-car garage with single 2-car door (garage approx. 19' wide x 20' deep x 10' high); 2 covered parking spaces
- Security: Smoke detectors; Carbon monoxide detectors
- Utilities: City water; City sewer; Located in a Municipal Utility District; Energy-efficient features including enhanced attic insulation, insulated windows, upgraded HVAC, efficient lighting and thermostat
- Home design: Single-family residence; One story; New construction (incomplete, 2026)
- Construction: Composition roof; Slab foundation; New construction
- Exterior features: Wood fencing; Less than 0.5-acre lot
Interior
- Kitchen: Dishwasher; Disposal; Electric range; Microwave; Breakfast bar; Built-in cabinets; Water line to refrigerator; Natural stone/granite counters
- Bedrooms: Primary bedroom with ensuite bath and walk-in closet (first level); Three additional bedrooms with split bedroom layout (first level)
- Flooring: Carpet; Ceramic tile; Laminate
- Bathrooms: Two full bathrooms
- Heating & cooling: Central heating (electric); Central air conditioning (electric)
- Interior features: Open floorplan; Decorative lighting; Eat-in kitchen; Kitchen island; Granite counters; Pantry; Cable TV available; High speed internet available
- Laundry & utility: Washer/dryer hookups (utility details not explicitly listed)
Neighborhood map
What this means for you Summary
Snapshot
- This is a 4-bed/2.0-bath single-family listed at $270k. Condition is rated good.
Deal economics
- At list price, monthly cash flow is $-15 ($-181/yr) — negative.
- To cash-flow at today's rent, offer at most $268k (0.8% below list).
- To meet the 1% rule (rent ≥ 1% of price), the offer needs to be $240k (11.3% below list).
- Recommended offer: $240k (11.3% below list) — sets the bar for 1% rule.
- Cap rate 6.2% vs local median 2.8% in Poetry — top-decile yield for the area; either an underpriced asset or a hidden risk that comps aren't pricing in. Stress-test before assuming the spread holds.
Location & tenants
- Location reads: area grade D — affects rentability + tenant quality, not the cash-flow math above.
- Royse City ISD (rural): math 42% / reading 42% proficiency, ranked #266 of 826 in TX (top 32%) — families likely to look elsewhere, expect single-tenant / working-renter base with shorter leases.
- Zoned schools: Harry Herndon El (math 52% / reading 41%, grade D-, #1,080 of 4,322 statewide, top 25%, 536 students, 49% FRL).
- Market conditions: Rents soft (-1.1%/yr); 1288 active listings in the ZIP; 1 comparable units currently listed for rent nearby; high-income renter base; 1,810 units permitted in Rockwall County in 2024 (0 in 5+ unit buildings).
Forward outlook
- Local home prices are declining (-3.0%/yr); year-one equity from $2k of loan paydown is wiped out by about $8k of value loss. Plan a longer hold.
- Rockwall County population projected at +56% by 2050 — long-run rental-demand tailwind backs the buy-and-hold thesis.
Negotiation context
- It's been on market 50 days — a 3% lower offer ($262k) is reasonable based on typical stale-listing flexibility.
Risks & watch-outs
- Climate carrying-cost: major wind risk, 27% chance of damaging wind over 30y; major wildfire risk; extreme-heat days projected 7→22/yr by 2055 (HVAC capex compounding) — expect insurance premiums to compound above CPI over the hold.
Questions for the listing agent
- What do current leases actually rent for vs. the listed asking? Can we see a recent rent roll and the last 12 months of T-12 income?
- It's been on market 50 days. Have you received any prior offers? Is the seller open to a 11% concession, seller financing, or rate buy-down credit?
- What does the HOA fee cover, when was the last increase, and are there any pending special assessments or reserve-fund shortfalls?
- Is there a deadline driving the sale (1031 exchange, divorce, estate, relocation)? That informs how much negotiation room exists.
- The area grade is low — what's the realistic commute time and amenity access for the typical tenant pool here? Any planned neighborhood developments (good or bad) we should know about?
- What's the average days-on-market for RENTAL listings here right now (not sales)? A rising rental-DOM trend means longer vacancies and softer asking-rent achievability than the comps imply.
- What's the recent tenant-quality profile in this submarket — average credit score on applications, eviction rate, late-payment / NSF rate, and stable-employment percentage? A property-management company in the area should have these aggregated.
- How much new for-sale + rental construction is in the pipeline within 1–3 miles? Heavy new supply typically softens prices + rents 12–24 months out; constrained supply supports both.
Investment metrics
- 1% rule
- 0.89% ✗
- Cap rate
- 6.23%
- Cash-on-cash
- -0.24%
- DSCR
- 0.99
- GRM
- 9.4
CMA / ARV
- ARV (median comp)
- $269,314
- List price
- $270,480
- Delta
- 0.43%
- Verdict
- FAIR
- Comps
- 20 within 1.0 mi
Show comp detail 12 sales within ~0.75 mi
| Address | Dist | Beds/Ba | Sqft | Sold | Price | $/sf | Match |
|---|---|---|---|---|---|---|---|
| 223 Desert Willow Way | 0.01mi | 4/2.0 | 1,615 (0%) | 2mo | $250,990 | $155 | 97 |
| 311 Desert Willow Way | 0.12mi | 4/2.0 | 1,615 (0%) | 3mo | $260,990 | $162 | 92 |
| 619 Bluejack Dr | 0.23mi | 4/2.0 | 1,615 (0%) | 6mo | $273,990 | $170 | 84 |
| 611 Bluejack Dr | 0.23mi | 3/2.0 (-1) | 1,566 (-3%) | 8mo | $295,990 | $189 | 73 |
| 543 Bluejack Dr | 0.23mi | 4/2.0 | 1,801 (+12%) | 4mo | $265,490 | $147 | 66 |
| 448 Vitex Dr | 0.35mi | 3/2.0 (-1) | 1,592 (-1%) | 12mo | $270,000 | $170 | 66 |
| 607 Bluejack Dr | 0.23mi | 4/2.0 | 1,801 (+12%) | 6mo | $306,990 | $170 | 65 |
| 559 Bluejack Dr | 0.23mi | 3/2.0 (-1) | 1,448 (-10%) | 4mo | $236,990 | $164 | 64 |
| 623 Bluejack Dr | 0.23mi | 4/2.0 | 1,801 (+12%) | 8mo | $306,990 | $170 | 64 |
| 415 Stagecoach Rd | 0.32mi | 4/2.0 | 1,500 (-7%) | 14mo | $279,000 | $186 | 62 |
| 232 Vitex Dr | 0.20mi | 3/2.0 (-1) | 1,448 (-10%) | 14mo | $250,765 | $173 | 57 |
| 244 Vitex Dr | 0.21mi | 3/2.0 (-1) | 1,390 (-14%) | 13mo | $245,990 | $177 | 51 |
Match score weights: distance 35% · size 25% · config 20% · recency 20%. Top-matched comps best support the ARV.
Projected returns pro-forma
-3.0% appreciation · 0.0% rent growth · sell at horizon
- IRR
- -20.2%
- Equity multiple
- 0.32×
- Total profit
- $-51,764
- Equity at exit
- $40,329
- IRR
- -21.9%
- Equity multiple
- 0.03×
- Total profit
- $-73,246
- Equity at exit
- $23,386
Cash invested: $75,734 (down + closing). Projections, not guarantees.
Landlord ↔ Tenant lean methodology
- Overall (STATE)
- 87 Strongly Landlord-Friendly
- State Texas
- 87 Strongly Landlord-Friendly · R+5
- County
- — inherits STATE
- City
- — inherits STATE
ZIP-level market 75189
- Home prices YoY
- -25.0%
- Rents YoY
- -1.1%
- Active inventory
- 1288
- Price-to-rent
- 9.4×
Monthly cashflow live
- Estimated rent
- $2,400 medium interval (Pro) →
- Mortgage (P&I)
- −$1,418
- Tax est. 1.5%
- −$338 /mo · $4,057/yr
- Insurance
- −$113
- HOA
- −$42
- Vacancy / Maint / Mgmt
- −$504
- Net cashflow
- $-15
Break-even live
UW: 25.0% down · 7.5% · 30yr · 1.5% tax · 5.0% vac · 8.0% maint · 8.0% mgmt
Financing live
Cash to close
- Down payment
- $67,620
- Closing costs
- $8,114
- Reserves months
- —
- Total cash needed
- —
Loan-product check · same deal, 3 products live
Conventional
25% down · 7.5% · 30yr
- Down + closing
- —
- Monthly P&I
- —
- Monthly cashflow
- —
- DSCR
- —
- Eligible?
- —
Personal DTI + credit; lowest rate.
DSCR
20% down · 8.5% · 30yr
- Down + closing
- —
- Monthly P&I
- —
- Monthly cashflow
- —
- DSCR
- —
- Eligible?
- —
No personal income docs; deal must DSCR.
Hard money
10% down · 12.0% · 12mo
- Down + closing
- —
- Monthly P&I
- —
- Monthly cashflow
- —
- DSCR
- —
- Eligible?
- —
Short-term bridge; refi at stabilization.
Rent comps 1 comps
| Address | Beds | Baths | Sqft | Rent | $/sqft | DOM | Units | Dist |
|---|---|---|---|---|---|---|---|---|
| 444 Vitex Dr Royse City, TX | 4.0 | 2.5 | 2080 | $2,200 | $1.06 | 1d | 1 | 0.35mi |
HOA detail
- Monthly dues
- $42 · $504/yr
Listing history 15 events
-
2026-06-18days on market $270,480 Active 50 DOM
-
2026-06-17days on market $270,480 Active 49 DOM
-
2026-06-16days on market $270,480 Active 48 DOM
-
2026-06-15days on market $270,480 Active 47 DOM
-
2026-06-13days on market $270,480 Active 45 DOM
-
2026-06-09days on market $270,480 Active 41 DOM
-
2026-06-08days on market $270,480 Active 40 DOM
-
2026-06-07days on market $270,480 Active 39 DOM
-
2026-06-04days on market $270,480 Active 36 DOM
-
2026-06-03days on market $270,480 Active 35 DOM
-
2026-06-02days on market $270,480 Active 34 DOM
-
2026-06-01days on market $270,480 Active 33 DOM
-
2026-05-31days on market $270,480 Active 32 DOM
-
2026-05-11price $270,480 996-char remark
-
2026-04-29$268,480 Active 996-char remark
ⓘ Source: listings_history table (triggers on properties + properties_extension) + one-shot
backfill from property_details.listing_events for pre-trigger history.
Climate risk First Street
- Flood 1/10 Low FEMA zone X (unshaded) · 0% chance over 30 yrs
- Wildfire 6/10 Major
- Heat 7/10 Severe 7 d/yr ≥109°F today · 22 d/yr by 30 yrs out
- Wind 6/10 Major 27% chance of damaging wind over 30 yrs
- Air quality 2/10 Low 1 unhealthy d/yr today · 1 by 30 yrs out
Nearby sold comps map
Loading sold comps map…
Walkable amenities ~0.75 mi
Loading nearby amenities…
Taxation est. · year 1
- Rental income
- $28,802
- − Mortgage interest
- −$15,151
- − Property taxes
- −$4,057
- − Insurance
- −$1,352
- − Repairs & maintenance
- −$2,304
- − Management
- −$2,304
- − HOA
- −$504
- − Depreciation
- −$7,869
- Taxable loss
- −$4,740
- Est. tax savings @ 24.0%
- +$1,138
- After-tax cash flow
- $956/yr
For passive investors: Depreciation is non-cash, so a rental often shows a tax loss while cash-flowing — sheltering income. Rental losses are passive: they offset passive income freely, and up to $25,000/yr can offset ordinary (W-2) income if you actively participate and your MAGI is under $100k (phasing out to $0 by $150k); unused losses carry forward. On sale, claimed depreciation is recaptured at up to 25%, and gains may owe capital-gains tax (a 1031 exchange can defer both). Figures are a year-1 estimate at your 24.0% rate — not tax advice; consult a CPA.
Condition & rehab AI · 12 photos
This single-story home is in excellent condition with a spacious floor plan and modern amenities. It is move-in ready and offers a great value for both resale and rental markets.
Value-add opportunities
- Both Painting exterior and interior walls — Enhances curb appeal and interior aesthetics
- Both Replacing carpet with hardwood flooring — Improves durability and adds value
- Both Upgrading kitchen appliances — Enhances functionality and appeal
- Both Adding smart home features — Improves convenience and adds value
Renovation cost estimate screening
Value-add ROI direction
- Both Painting exterior and interior walls — Enhances curb appeal and interior aesthetics ↑
- Both Replacing carpet with hardwood flooring — Improves durability and adds value ↑
- Both Upgrading kitchen appliances — Enhances functionality and appeal ↑
- Both Adding smart home features — Improves convenience and adds value ↑
ⓘ Cost ranges are severity-bucket heuristics (US national rule-of-thumb). Get contractor quotes + a written scope before underwriting a rehab budget.
Schools (NCES district)
- District
- Royse City ISD
- NCES district ID
- 4838220
- Math proficiency
- 42% ▼ -10.00%
- Reading proficiency
- 42% ▼ -5.00%
- Median HH income
- $73,810
- Composite
- 38.44/100
- National rank
- #4197
- State rank
- #266 of 826 in TX
Livability — Poetry
No livability data for this city. (Only ~50 U.S. cities are tracked.)
Census & demographics
- County
- Rockwall County · 132,930 people
- Metro
- Dallas-Fort Worth-Arlington, TX
- Population (ZIP)
- 48,739
- Household income
- $117,125
- Rent vs Own
- Severe rent burden
- 569.0
Population outlook (Rockwall County) Hauer SSP2
- Today (2025)
- 118,396 people
- By 2030
- 132,209 · +11.7%
- By 2040
- 159,538 · +34.7%
- By 2050
- 185,299 · +56.5%
- By 2075
- 243,489 · +105.7%
- By 2100
- 277,814 · +134.6%
Race, ethnicity, and origin ACS 2023
- Neighborhood character
- Diverse neighborhood (Simpson 0.57)
- Race & ethnicity
- White 60% Hispanic / Latino 25% Two or more races 12% Black 10% Asian 2%
- Hispanic origin (detail)
- Mexican 20%
- Common ancestry
- Slovak 2% Serbian 1% Lithuanian 1%
- Foreign-born
- 10% · Canada, Philippines, Jamaica
- Languages at home
- 80% English-only · Spanish 15% Other Indo-European 1%
Political lean MEDSL · Rockwall
- 2024 margin
- Solid R (+40.9) · D 29.1% · R 70.0%
- 2008→2024 swing
- +5.3pp toward D · 2008: -46.2pp · 2024: -40.9pp
- All cycles
- 2024: R+40.9 2020: R+37.7 2016: R+47.5 2012: R+53.3 2008: R+46.2
Not yet ingested
- Civics
- —
Market trends
- HPI YoY
- ▼ -71.10%
- Current HPI
- 212.8422
- Rent YoY
- ▼ -1.13%
- Metro
- Dallas-Fort Worth-Arlington, TX
- State GDP YoY
- ▲ 3.95%
- F500 in state
- 110
Industry mix (Fortune 500 HQ in TX)
| Industry | F500 HQs | Revenue |
|---|---|---|
| Energy | 16 | $1,198B |
|
||
| Technology | 5 | $198B |
|
||
| Engineering / Construction | 4 | $72B |
|
||
| Energy Services | 3 | $60B |
|
||
| Utilities | 3 | $41B |
|
||
| Healthcare | 2 | $330B |
|
||
Price history
+0.7% since first listed2 events — show timeline
- 2026-05-11 Price Changed $270,480 NTREIS
- 2026-04-29 Listed $268,480 NTREIS
Cash-flow waterfall
monthlySold comps — $/sqft
last 12 mo · ≤1 miLoading sold comps…