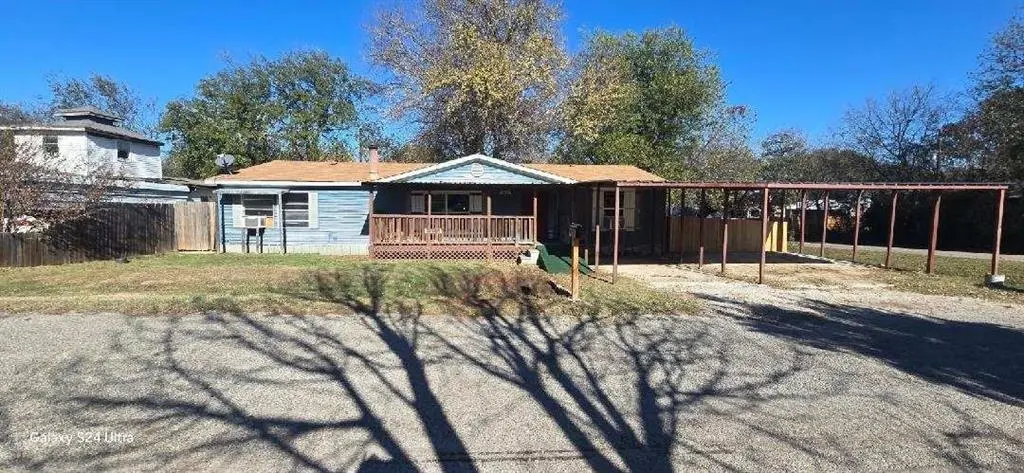
3815 Oak Meadow St · Oak Trail Shores, TX
Flood risk 6/10 · Moderate
- FEMA flood zone
- X (unshaded)
- Chance of flooding over 30 yrs
- 0.54%
- Est. flood insurance / yr
- $507 – $1,088
Fire risk 5/10 · Moderate
- Est. fire insurance / yr
- $1,222 – $2,270
Heat risk 7/10 · Major
- Hot days now (above 108°F)
- 7 days/yr
- Hot days in 30 yrs
- 21 days/yr
Wind risk 6/10 · Moderate
- Chance of severe wind over 30 yrs
- 27.0%
Air-quality risk 2/10 · Minimal
- Unhealthy air days now
- 1 days/yr
- Unhealthy air days in 30 yrs
- 2 days/yr
Risk factors via First Street. Map © Google.
Why this score? — see what drove the C+ grade
The composite is a weighted blend of 9 inputs, each scored 0–100. Each bar is that input's sub-score; the figure is the points it added to the 100-point composite (weight × sub-score).
- Cash flow +30.0/30.0
- DSCR +10.0/10.0
- 1% rule +7.7/10.0
- Schools +4.0/10.0
- Livability +2.9/5.0
- Rent growth +2.8/5.0
- Condition / age +2.5/5.0
- ARV discount +0.4/15.0
- Appreciation +0.0/10.0
$170,000
🖨 Deal sheet 📄 Offer letter ✓ Due diligence
Listing remarks MLS
Charming Home with Covered Parking & Spacious Lot Welcome to this inviting 3-bedroom, 2-bath residential home offering approximately 1,726 sq ft of comfortable living space in the desirable Granbury ISD. Built in 2000 and situated on a generously sized lot, this property provides the perfect blend of functionality, outdoor space, and value. The home features a welcoming front elevation with mature shade trees and an expansive covered parking area ideal for multiple vehicles, boats, or recreational equipment. Inside, you’ll find a practical layout designed for everyday living, with ample natural light and comfortable living and dining areas. Enjoy the freedom of a spacious yard with room to garden, entertain, or create your ideal outdoor retreat. Located in a community with low HOA dues of just 18 monthly and convenient access to local schools, shopping, and Granbury amenities. Refrigerator, TV and washer and dryer negotiable Freshly painted, new subflooring and floors, wheel chair ramps front and back, new ceiling fans, kitchen sink faucet, dishwasher and stove and furnace.
Key facts
- Spacious yard
- Covered parking
- New ceiling fans
Tags
Neighborhood map
What this means for you Summary
Snapshot
- This is a 3-bed/2.0-bath manufactured listed at $170k.
Deal economics
- At list price, monthly cash flow is $632 ($8k/yr) — positive.
- The deal already cash-flows at list — no discount required.
- Meets the 1% rule at list price ($2k rent vs $170k).
- Recommended offer: $155k (9.0% below list) — sets the bar for market timing.
- Cap rate 10.8% vs local median 5.9% in Oak Trail Shores — top-decile yield for the area; either an underpriced asset or a hidden risk that comps aren't pricing in. Stress-test before assuming the spread holds.
Location & tenants
- Location reads 58/100 on livability (#1,187 in TX) — a working-class tenant base; expect higher turnover. Strengths: cost of living A+, housing A+, crime B+; Watch: health & safety D+, schools F, amenities F.
- Granbury ISD (town): math 46% / reading 46% proficiency, ranked #237 of 826 in TX (top 29%) — families likely to look elsewhere, expect single-tenant / working-renter base with shorter leases.
- Market conditions: Rents rising (+1.1%/yr); 929 active listings in the ZIP; 2 comparable units currently listed for rent nearby; 125 units permitted in Hood County in 2024 (0 in 5+ unit buildings).
- This rent runs 37% of the median local income ($70k/yr) — at the standard rent-burdened threshold; future hikes will face affordability resistance.
Forward outlook
- Local home prices are declining (-3.0%/yr); year-one equity from $1k of loan paydown is wiped out by about $5k of value loss. Plan a longer hold.
- Hood County population projected at +29% by 2050 — long-run rental-demand tailwind backs the buy-and-hold thesis.
- At projected returns (-3.0% appreciation + 1.1% rent growth), your $48k cash investment doubles in ~9 years — after that, you're playing with house money.
Negotiation context
- It's been on market 112 days — a 9% lower offer ($155k) is reasonable based on typical stale-listing flexibility.
- 5 sale attempts since 8y ago with the ask held roughly flat each time — persistent listings suggest the price (not the market) is what's stuck; bring a comps-based counter.
Risks & watch-outs
- Climate carrying-cost: major flood risk; major wind risk, 27% chance of damaging wind over 30y; moderate wildfire risk; extreme-heat days projected 7→21/yr by 2055 (HVAC capex compounding) — expect insurance premiums to compound above CPI over the hold.
Questions for the listing agent
- It's been on market 112 days. Have you received any prior offers? Is the seller open to a 9% concession, seller financing, or rate buy-down credit?
- What does the HOA fee cover, when was the last increase, and are there any pending special assessments or reserve-fund shortfalls?
- Why hasn't it sold? Are there any deal-killer items the seller is aware of (foundation, flood, title, zoning, code violations)?
- Is there a deadline driving the sale (1031 exchange, divorce, estate, relocation)? That informs how much negotiation room exists.
- Schools are F-rated, which usually means shorter tenancies and higher turnover. Who's the typical renter profile here, and what's been the actual vacancy rate?
- What's the average days-on-market for RENTAL listings here right now (not sales)? A rising rental-DOM trend means longer vacancies and softer asking-rent achievability than the comps imply.
- What's the recent tenant-quality profile in this submarket — average credit score on applications, eviction rate, late-payment / NSF rate, and stable-employment percentage? A property-management company in the area should have these aggregated.
- How much new for-sale + rental construction is in the pipeline within 1–3 miles? Heavy new supply typically softens prices + rents 12–24 months out; constrained supply supports both.
Investment metrics
- 1% rule
- 1.27% ✓
- Cap rate
- 10.76%
- Cash-on-cash
- 15.94%
- DSCR
- 1.71
- GRM
- 6.5
CMA / ARV
- ARV (median comp)
- $146,739
- List price
- $170,000
- Delta
- 15.85%
- Verdict
- OVERPRICED
- Comps
- 7 within 1.0 mi
Show comp detail 2 sales within ~0.75 mi
| Address | Dist | Beds/Ba | Sqft | Sold | Price | $/sf | Match |
|---|---|---|---|---|---|---|---|
| 3615 Pecan Grove Ct. Ct | 0.35mi | 3/2.0 | 1,600 (-7%) | 10mo | $150,000 | $94 | 63 |
| 3007 Oak Wood St | 0.67mi | 3/2.0 | 1,478 (-14%) | 5mo | $29,990 | $20 | 41 |
Match score weights: distance 35% · size 25% · config 20% · recency 20%. Top-matched comps best support the ARV.
Projected returns pro-forma
-3.0% appreciation · 1.1% rent growth · sell at horizon
- IRR
- 4.8%
- Equity multiple
- 1.18×
- Total profit
- $8,628
- Equity at exit
- $25,348
- IRR
- 12.5%
- Equity multiple
- 1.91×
- Total profit
- $43,211
- Equity at exit
- $14,698
Cash invested: $47,600 (down + closing). Projections, not guarantees.
Landlord ↔ Tenant lean methodology
- Overall (STATE)
- 87 Strongly Landlord-Friendly
- State Texas
- 87 Strongly Landlord-Friendly · R+5
- County
- — inherits STATE
- City
- — inherits STATE
ZIP-level market 76048
- Home prices YoY
- -23.4%
- Rents YoY
- 1.1%
- Active inventory
- 929
- Price-to-rent
- 6.5×
Monthly cashflow live
- Estimated rent
- $2,164 medium interval (Pro) →
- Mortgage (P&I)
- −$891
- Tax from tax record
- −$97 /mo · $1,164/yr
- Insurance
- −$71
- HOA
- −$18
- Vacancy / Maint / Mgmt
- −$454
- Net cashflow
- $632
Break-even live
UW: 25.0% down · 7.5% · 30yr · 1.5% tax · 5.0% vac · 8.0% maint · 8.0% mgmt
Financing live
Cash to close
- Down payment
- $42,500
- Closing costs
- $5,100
- Reserves months
- —
- Total cash needed
- —
Loan-product check · same deal, 3 products live
Conventional
25% down · 7.5% · 30yr
- Down + closing
- —
- Monthly P&I
- —
- Monthly cashflow
- —
- DSCR
- —
- Eligible?
- —
Personal DTI + credit; lowest rate.
DSCR
20% down · 8.5% · 30yr
- Down + closing
- —
- Monthly P&I
- —
- Monthly cashflow
- —
- DSCR
- —
- Eligible?
- —
No personal income docs; deal must DSCR.
Hard money
10% down · 12.0% · 12mo
- Down + closing
- —
- Monthly P&I
- —
- Monthly cashflow
- —
- DSCR
- —
- Eligible?
- —
Short-term bridge; refi at stabilization.
Rent comps 2 comps
| Address | Beds | Baths | Sqft | Rent | $/sqft | DOM | Units | Dist |
|---|---|---|---|---|---|---|---|---|
| 4321 Terri Lee Ln Granbury, TX | 4.0 | 2.0 | 1387 | $2,075 | $1.50 | 1d | 1 | 1.06mi |
| 3318 Crystal Clear Ct Granbury, TX | 3.0 | 2.0 | 1772 | $2,500 | $1.41 | 43d | 1 | 1.29mi |
HOA detail
- Monthly dues
- $18 · $216/yr
Listing history 35 events
-
2026-06-18days on market $170,000 Active 112 DOM
-
2026-06-17days on market $170,000 Active 111 DOM
-
2026-06-16days on market $170,000 Active 110 DOM
-
2026-06-15days on market $170,000 Active 109 DOM
-
2026-06-13days on market $170,000 Active 107 DOM
-
2026-06-09days on market $170,000 Active 103 DOM
-
2026-06-08days on market $170,000 Active 102 DOM
-
2026-06-07days on market $170,000 Active 101 DOM
-
2026-06-04days on market $170,000 Active 98 DOM
-
2026-06-03days on market $170,000 Active 97 DOM
-
2026-06-02days on market $170,000 Active 96 DOM
-
2026-06-02days on market $170,000 Active 95 DOM
-
2026-05-31days on market $170,000 Active 94 DOM
-
2026-02-26$170,000 Active 1107-char remark
Show marketing remark (1107 chars)
Charming Home with Covered Parking & Spacious Lot Welcome to this inviting 3-bedroom, 2-bath residential home offering approximately 1,726 sq ft of comfortable living space in the desirable Granbury ISD. Built in 2000 and situated on a generously sized lot, this property provides the perfect blend of functionality, outdoor space, and value. The home features a welcoming front elevation with mature shade trees and an expansive covered parking area ideal for multiple vehicles, boats, or recreational equipment. Inside, you’ll find a practical layout designed for everyday living, with ample natural light and comfortable living and dining areas. Enjoy the freedom of a spacious yard with room to garden, entertain, or create your ideal outdoor retreat. Located in a community with low HOA dues of just 18 monthly and convenient access to local schools, shopping, and Granbury amenities. Refrigerator, TV and washer and dryer negotiable Freshly painted, new subflooring and floors, wheel chair ramps front and back, new ceiling fans, kitchen sink faucet, dishwasher and stove and furnace.
-
2018-10-25historical
-
2018-10-10price $79,900
-
2018-10-01price $92,000
-
2018-09-28price $99,500
-
2018-09-16price $99,750
-
2018-09-16status Active
-
2018-09-03status Pending
-
2018-09-02price $99,800
-
2018-08-10price $99,900
-
2018-07-27price $107,500
-
2018-07-27status Active
-
2018-07-25historical
-
2018-07-16price $109,400
-
2018-07-03price $109,900
-
2018-06-20$114,900 Active
-
2018-06-18$114,900 Active
-
2018-06-18historical
-
2018-04-13soldstatus
-
1999-09-01soldstatus
-
1996-05-07soldstatus
-
1995-10-05soldstatus
ⓘ Source: listings_history table (triggers on properties + properties_extension) + one-shot
backfill from property_details.listing_events for pre-trigger history.
Tax reassessment forecast TX · Resets to sale price
- Current annual tax
- $1,164 · $97/mo
- Projected year-2 tax
- $3,111 · $259/mo
- Expected delta
- +$1,947/yr (+$162/mo · 167.3%)
ⓘ Screening estimate from a state-policy table — verify with the county assessor before closing.
Climate risk First Street
- Flood 6/10 Major FEMA zone X (unshaded) · 54% chance over 30 yrs
- Wildfire 5/10 Major
- Heat 7/10 Severe 7 d/yr ≥108°F today · 21 d/yr by 30 yrs out
- Wind 6/10 Major 27% chance of damaging wind over 30 yrs
- Air quality 2/10 Low 1 unhealthy d/yr today · 2 by 30 yrs out
Nearby sold comps map
Loading sold comps map…
Walkable amenities ~0.75 mi
Loading nearby amenities…
Taxation est. · year 1
- Rental income
- $25,967
- − Mortgage interest
- −$9,523
- − Property taxes
- −$1,164
- − Insurance
- −$850
- − Repairs & maintenance
- −$2,077
- − Management
- −$2,077
- − HOA
- −$216
- − Depreciation
- −$4,945
- Taxable income
- $5,114
- Est. tax owed @ 24.0%
- −$1,227
- After-tax cash flow
- $6,359/yr
For passive investors: Depreciation is non-cash, so a rental often shows a tax loss while cash-flowing — sheltering income. Rental losses are passive: they offset passive income freely, and up to $25,000/yr can offset ordinary (W-2) income if you actively participate and your MAGI is under $100k (phasing out to $0 by $150k); unused losses carry forward. On sale, claimed depreciation is recaptured at up to 25%, and gains may owe capital-gains tax (a 1031 exchange can defer both). Figures are a year-1 estimate at your 24.0% rate — not tax advice; consult a CPA.
Schools (NCES district)
- District
- Granbury ISD
- NCES district ID
- 4821390
- Math proficiency
- 46% ▬ 0.00%
- Reading proficiency
- 46% ▲ 4.00%
- Median HH income
- $55,856
- Composite
- 40.04/100
- National rank
- #3820
- State rank
- #237 of 826 in TX
Livability — Oak Trail Shores
- Score
- 58/100
- State rank
- #1187
- US rank
- #20758
Category grades
Schools grade is shown separately in the Schools card above.
Census & demographics
- Census place
- Oak Trail Shores, TX
- County
- Hood County · 58,506 people
- City population
- 58,506
- Metro
- Granbury, TX
- Population (ZIP)
- 27,000
- Household income
- $70,346
- Rent vs Own
- Severe rent burden
- 612.0
Population outlook (Hood County) Hauer SSP2
- Today (2025)
- 63,502 people
- By 2030
- 67,459 · +6.2%
- By 2040
- 74,958 · +18.0%
- By 2050
- 81,922 · +29.0%
- By 2075
- 98,872 · +55.7%
- By 2100
- 107,796 · +69.8%
Race, ethnicity, and origin ACS 2023
- Neighborhood character
- Predominantly White (80%)
- Race & ethnicity
- White 80% Hispanic / Latino 14% Two or more races 11% Black 1%
- Hispanic origin (detail)
- Mexican 13%
- Common ancestry
- Italian 2% Slovak 2% Portuguese 1%
- Foreign-born
- 4% · Canada
- Languages at home
- 89% English-only · Spanish 10%
Political lean MEDSL · Hood
- 2024 margin
- Solid R (+66.0) · D 16.6% · R 82.6%
- 2008→2024 swing
- -11.9pp toward R · 2008: -54.0pp · 2024: -66.0pp
- All cycles
- 2024: R+66.0 2020: R+64.1 2016: R+66.5 2012: R+64.7 2008: R+54.0
Not yet ingested
- Civics
- —
Market trends
- HPI YoY
- ▼ -83.25%
- Current HPI
- 272.2126
- Rent YoY
- ▲ 1.10%
- Metro
- Granbury, TX
- State GDP YoY
- ▲ 3.95%
- F500 in state
- 110
Industry mix (Fortune 500 HQ in TX)
| Industry | F500 HQs | Revenue |
|---|---|---|
| Energy | 16 | $1,198B |
|
||
| Technology | 5 | $198B |
|
||
| Engineering / Construction | 4 | $72B |
|
||
| Energy Services | 3 | $60B |
|
||
| Utilities | 3 | $41B |
|
||
| Healthcare | 2 | $330B |
|
||
Price history
+48.0% since first listed22 events — show timeline
- 2026-02-26 Listed $170,000 NTREIS
- 2018-10-25 Listing Removed — NTREIS
- 2018-10-10 Price Changed $79,900 NTREIS
- 2018-10-01 Price Changed $92,000 NTREIS
- 2018-09-28 Price Changed $99,500 NTREIS
- 2018-09-16 Price Changed $99,750 NTREIS
- 2018-09-16 Relisted — NTREIS
- 2018-09-03 Pending — NTREIS
- 2018-09-02 Price Changed $99,800 NTREIS
- 2018-08-10 Price Changed $99,900 NTREIS
- 2018-07-27 Price Changed $107,500 NTREIS
- 2018-07-27 Relisted — NTREIS
- 2018-07-25 Listing Removed — NTREIS
- 2018-07-16 Price Changed $109,400 NTREIS
- 2018-07-03 Price Changed $109,900 NTREIS
- 2018-06-20 Listed $114,900 NTREIS
- 2018-06-18 Listing Removed — NTREIS
- 2018-06-18 Listed $114,900 NTREIS
- 2018-04-13 Sold (Public Records) — Public Records
- 1999-09-01 Sold (Public Records) — Public Records
- 1996-05-07 Sold (Public Records) — Public Records
- 1995-10-05 Sold (Public Records) — Public Records
Property tax history
+1.0%/yrLatest (2025): $1,164 · +5.0% YoY. Source: county tax records.
Cash-flow waterfall
monthlySold comps — $/sqft
last 12 mo · ≤1 miLoading sold comps…