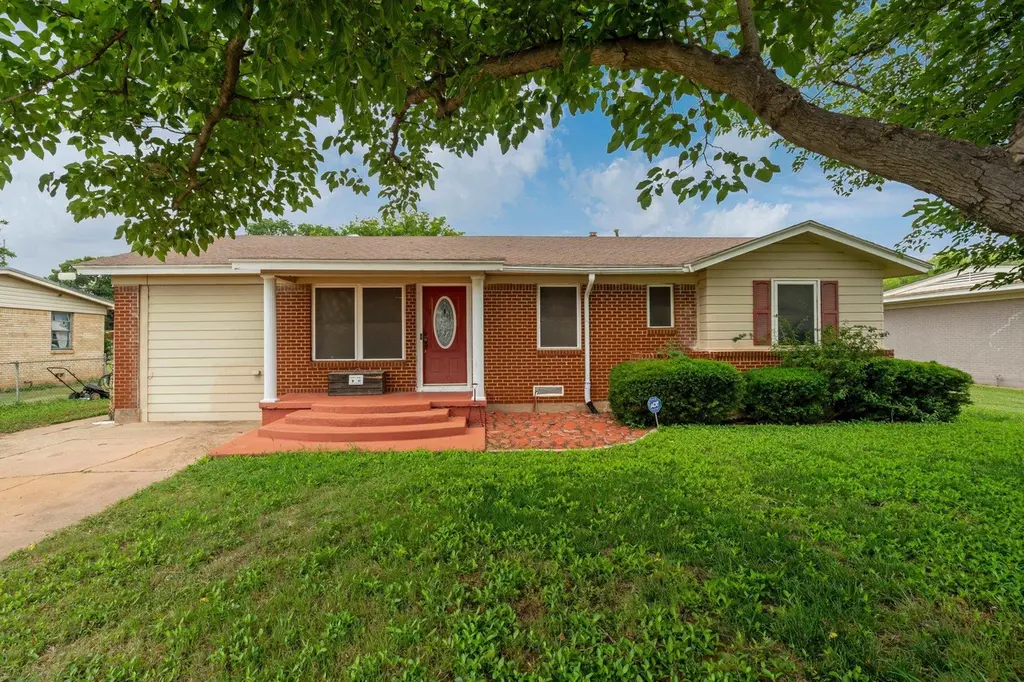
712 W Alameda St · Iowa Park, TX
Flood risk 1/10 · Minimal
- FEMA flood zone
- X (unshaded)
- Chance of flooding over 30 yrs
- 0.0%
- Est. flood insurance / yr
- $507 – $1,088
Fire risk 8/10 · Major
- Est. fire insurance / yr
- $1,222 – $2,270
Heat risk 7/10 · Major
- Hot days now (above 110°F)
- 7 days/yr
- Hot days in 30 yrs
- 20 days/yr
Wind risk 4/10 · Minor
- Chance of severe wind over 30 yrs
- 10.0%
Air-quality risk 1/10 · Minimal
- Unhealthy air days now
- 0 days/yr
- Unhealthy air days in 30 yrs
- 0 days/yr
Risk factors via First Street. Map © Google.
Why this score? — see what drove the B- grade
The composite is a weighted blend of 9 inputs, each scored 0–100. Each bar is that input's sub-score; the figure is the points it added to the 100-point composite (weight × sub-score).
- Cash flow +16.9/30.0
- ARV discount +14.4/15.0
- Appreciation +10.0/10.0
- 1% rule +5.5/10.0
- DSCR +5.3/10.0
- Schools +4.6/10.0
- Livability +3.6/5.0
- Rent growth +2.5/5.0
- Condition / age +2.5/5.0
$149,900
🖨 Deal sheet 📄 Offer letter ✓ Due diligence
Listing remarks MLS
Cute, clean and remodeled! Fresh paint on the interior and exterior, gorgeous refinished hardwood flooring, updated kitchen appliances, new double pane windows. So many updates! Huge living room is open to the kitchen and dining area. Both bathrooms have been updated, the guest bath has a whirlpool tub! Low utility bills here! Backyard is privacy fenced and has a storm shelter, storage/workshop and a tree house. There is an electric outlet for an above ground pool as well. More affordable than renting!
Key facts
- Vinyl floors
- Plantation shutters
- Privacy screens
Tags
Property features AI
Exterior
- Utilities: Public water; Public sewer
- Home design: Single-family residence; One story; Faces south
- Construction: Brick exterior; Wood siding; Metal siding; Composition roof
- Exterior features: Front porch; Fenced yard; Workshop on the property
Interior
- Flooring: Hardwood; Tile
- Bathrooms: One half bathroom
- Heating & cooling: Central heating (natural gas); Central air conditioning
- Interior features: Microwave; Hardwood flooring; Tile flooring
Neighborhood map
What this means for you Summary
Snapshot
- This is a 3-bed/2.0-bath single-family listed at $150k.
Deal economics
- At list price, monthly cash flow is $99 ($1k/yr) — positive.
- The deal already cash-flows at list — no discount required.
- Meets the 1% rule at list price ($2k rent vs $150k).
- Recommended offer: $148k (1.5% below list) — sets the bar for market timing.
Location & tenants
- Location reads 72/100 on livability (#272 in TX) — a middle-class / working-renter tenant base. Strengths: crime A+, cost of living A+, housing A+; Watch: health & safety C-, amenities F, commute F.
- Iowa Park CISD (town): math 57% / reading 49% proficiency, ranked #129 of 826 in TX (top 16%) — acceptable for families but not a draw, mixed tenant base, ~2y average lease.
- Zoned schools: Bradford El (math 58% / reading 51%, grade C, #621 of 4,322 statewide, top 15%, 447 students, 46% FRL); Iowa Park Jjaep (1 students, 0% FRL); Iowa Park H S (math 72% / reading 67%, grade B, #119 of 1,632 statewide, top 9%, 544 students, 34% FRL).
- Market conditions: 63 active listings in the ZIP; 2 comparable units currently listed for rent nearby; 231 units permitted in Wichita County in 2024 (10 in 5+ unit buildings).
Forward outlook
- In year one you build about $16k of equity ($1k loan paydown + $15k appreciation (10.0% local appreciation)).
- Wichita County population projected to shrink 7% by 2050 — rents likely to lag national; underwrite the cash flow, not the appreciation.
- At projected returns (10.0% appreciation + 3.0% rent growth), your $42k cash investment doubles in ~3 years — after that, you're playing with house money.
- By year 3, paydown + projected appreciation supports a ~$41k cash-out refi (75% LTV) — recoverable capital for the next deal without selling this one.
Negotiation context
- It's been on market 23 days — a 2% lower offer ($148k) is reasonable based on typical stale-listing flexibility.
- 2 sale attempts since 8y ago with the ask held roughly flat each time — persistent listings suggest the price (not the market) is what's stuck; bring a comps-based counter.
Risks & watch-outs
- Climate carrying-cost: severe wildfire risk; extreme-heat days projected 7→20/yr by 2055 (HVAC capex compounding) — expect insurance premiums to compound above CPI over the hold.
Questions for the listing agent
- Built in 1965 — when were the roof, HVAC, electrical panel, plumbing, and water heater last replaced?
- Is there a deadline driving the sale (1031 exchange, divorce, estate, relocation)? That informs how much negotiation room exists.
- What's the average days-on-market for RENTAL listings here right now (not sales)? A rising rental-DOM trend means longer vacancies and softer asking-rent achievability than the comps imply.
- What's the recent tenant-quality profile in this submarket — average credit score on applications, eviction rate, late-payment / NSF rate, and stable-employment percentage? A property-management company in the area should have these aggregated.
- How much new for-sale + rental construction is in the pipeline within 1–3 miles? Heavy new supply typically softens prices + rents 12–24 months out; constrained supply supports both.
Investment metrics
- 1% rule
- 1.05% ✓
- Cap rate
- 7.09%
- Cash-on-cash
- 2.83%
- DSCR
- 1.13
- GRM
- 7.9
CMA / ARV
- ARV (on-the-fly)
- $177,060
- Comps found
- 1
Show comp detail 1 sale within ~0.75 mi
| Address | Dist | Beds/Ba | Sqft | Sold | Price | $/sf | Match |
|---|---|---|---|---|---|---|---|
| 1320 Edgehill Trl | 0.67mi | 3/1.5 | 1,540 (+13%) | 12mo | $199,900 | $130 | 35 |
Match score weights: distance 35% · size 25% · config 20% · recency 20%. Top-matched comps best support the ARV.
Projected returns pro-forma
10.0% appreciation · 3.0% rent growth · sell at horizon
- IRR
- 26.3%
- Equity multiple
- 3.10×
- Total profit
- $88,035
- Equity at exit
- $135,042
- IRR
- 23.1%
- Equity multiple
- 7.06×
- Total profit
- $254,468
- Equity at exit
- $291,223
Cash invested: $41,972 (down + closing). Projections, not guarantees.
Landlord ↔ Tenant lean methodology
- Overall (STATE)
- 87 Strongly Landlord-Friendly
- State Texas
- 87 Strongly Landlord-Friendly · R+5
- County
- — inherits STATE
- City
- — inherits STATE
ZIP-level market 76367
- Home prices YoY
- 6.7%
- Active inventory
- 63
- Price-to-rent
- 7.9×
Monthly cashflow live
- Estimated rent
- $1,572 medium interval (Pro) →
- Mortgage (P&I)
- −$786
- Tax from tax record
- −$294 /mo · $3,533/yr
- Insurance
- −$62
- HOA
- −$0
- Vacancy / Maint / Mgmt
- −$330
- Net cashflow
- $99
Break-even live
UW: 25.0% down · 7.5% · 30yr · 1.5% tax · 5.0% vac · 8.0% maint · 8.0% mgmt
Financing live
Cash to close
- Down payment
- $37,475
- Closing costs
- $4,497
- Reserves months
- —
- Total cash needed
- —
Loan-product check · same deal, 3 products live
Conventional
25% down · 7.5% · 30yr
- Down + closing
- —
- Monthly P&I
- —
- Monthly cashflow
- —
- DSCR
- —
- Eligible?
- —
Personal DTI + credit; lowest rate.
DSCR
20% down · 8.5% · 30yr
- Down + closing
- —
- Monthly P&I
- —
- Monthly cashflow
- —
- DSCR
- —
- Eligible?
- —
No personal income docs; deal must DSCR.
Hard money
10% down · 12.0% · 12mo
- Down + closing
- —
- Monthly P&I
- —
- Monthly cashflow
- —
- DSCR
- —
- Eligible?
- —
Short-term bridge; refi at stabilization.
Rent comps 2 comps
| Address | Beds | Baths | Sqft | Rent | $/sqft | DOM | Units | Dist |
|---|---|---|---|---|---|---|---|---|
| 909 Van Horn St Iowa Park, TX | 3.0 | 2.0 | 1677 | $1,645 | $0.98 | 44d | 1 | 0.34mi |
| 706 W Louisa Ave Iowa Park, TX | 3.0 | 1.5 | 1144 | $1,500 | $1.31 | 44d | 1 | 0.35mi |
Listing history 21 events
-
2026-06-19days on market $149,900 Active 23 DOM
-
2026-06-18days on market $149,900 Active 22 DOM
-
2026-06-17days on market $149,900 Active 21 DOM
-
2026-06-16days on market $149,900 Active 20 DOM
-
2026-06-15days on market $149,900 Active 19 DOM
-
2026-06-14days on market $149,900 Active 17 DOM
-
2026-06-13days on market $149,900 Active 16 DOM
-
2026-06-10days on market $149,900 Active 14 DOM
-
2026-06-09days on market $149,900 Active 13 DOM
-
2026-06-08days on market $149,900 Active 12 DOM
-
2026-06-07days on market $149,900 Active 11 DOM
-
2026-06-03days on market $149,900 Active 7 DOM
-
2026-06-02days on market $149,900 Active 6 DOM
-
2026-06-01days on market $149,900 Active 5 DOM
-
2026-05-31days on market $149,900 Active 4 DOM
-
2026-05-30days on market $149,900 Active 3 DOM
-
2026-05-27$149,900 Active
-
2018-08-21soldstatus
-
2018-08-20soldstatus 507-char remark
Show marketing remark (507 chars)
Cute, clean and remodeled! Fresh paint on the interior and exterior, gorgeous refinished hardwood flooring, updated kitchen appliances, new double pane windows. So many updates! Huge living room is open to the kitchen and dining area. Both bathrooms have been updated, the guest bath has a whirlpool tub! Low utility bills here! Backyard is privacy fenced and has a storm shelter, storage/workshop and a tree house. There is an electric outlet for an above ground pool as well. More affordable than renting!
-
2018-06-09$87,500 507-char remark
Show marketing remark (507 chars)
Cute, clean and remodeled! Fresh paint on the interior and exterior, gorgeous refinished hardwood flooring, updated kitchen appliances, new double pane windows. So many updates! Huge living room is open to the kitchen and dining area. Both bathrooms have been updated, the guest bath has a whirlpool tub! Low utility bills here! Backyard is privacy fenced and has a storm shelter, storage/workshop and a tree house. There is an electric outlet for an above ground pool as well. More affordable than renting!
-
2005-05-12soldstatus
ⓘ Source: listings_history table (triggers on properties + properties_extension) + one-shot
backfill from property_details.listing_events for pre-trigger history.
Tax reassessment forecast TX · Resets to sale price
- Current annual tax
- $3,533 · $294/mo
- Projected year-2 tax
- $3,533 · $294/mo
- Expected delta
- $0/yr ($0/mo · 0.0%)
ⓘ Screening estimate from a state-policy table — verify with the county assessor before closing.
Climate risk First Street
- Flood 1/10 Low FEMA zone X (unshaded) · 0% chance over 30 yrs
- Wildfire 8/10 Severe
- Heat 7/10 Severe 7 d/yr ≥110°F today · 20 d/yr by 30 yrs out
- Wind 4/10 Moderate 10% chance of damaging wind over 30 yrs
- Air quality 1/10 Low 0 unhealthy d/yr today · 0 by 30 yrs out
Nearby sold comps map
Loading sold comps map…
Walkable amenities ~0.75 mi
Loading nearby amenities…
Taxation est. · year 1
- Rental income
- $18,865
- − Mortgage interest
- −$8,397
- − Property taxes
- −$3,533
- − Insurance
- −$750
- − Repairs & maintenance
- −$1,509
- − Management
- −$1,509
- − Depreciation
- −$4,361
- Taxable loss
- −$1,193
- Est. tax savings @ 24.0%
- +$286
- After-tax cash flow
- $1,474/yr
For passive investors: Depreciation is non-cash, so a rental often shows a tax loss while cash-flowing — sheltering income. Rental losses are passive: they offset passive income freely, and up to $25,000/yr can offset ordinary (W-2) income if you actively participate and your MAGI is under $100k (phasing out to $0 by $150k); unused losses carry forward. On sale, claimed depreciation is recaptured at up to 25%, and gains may owe capital-gains tax (a 1031 exchange can defer both). Figures are a year-1 estimate at your 24.0% rate — not tax advice; consult a CPA.
Schools (NCES district)
- District
- Iowa Park CISD
- NCES district ID
- 4824260
- Math proficiency
- 57% ▼ -1.00%
- Reading proficiency
- 49% ▼ -4.00%
- Median HH income
- $52,689
- Composite
- 45.57/100
- National rank
- #2597
- State rank
- #129 of 826 in TX
Livability — Iowa Park
- Score
- 72/100
- State rank
- #272
- US rank
- #6350
Category grades
Schools grade is shown separately in the Schools card above.
Census & demographics
- Census place
- Iowa Park, TX
- City population
- 14,013
- Population (ZIP)
- 14,013
Population outlook (Wichita County) Hauer SSP2
- Today (2025)
- 129,638 people
- By 2030
- 128,366 · -1.0%
- By 2040
- 124,466 · -4.0%
- By 2050
- 120,499 · -7.0%
- By 2075
- 113,884 · -12.2%
- By 2100
- 101,818 · -21.5%
Race, ethnicity, and origin ACS 2023
- Neighborhood character
- Predominantly White (70%)
- Race & ethnicity
- White 70% Hispanic / Latino 16% Black 10% Two or more races 8% Asian 1% Native American 1%
- Hispanic origin (detail)
- Mexican 13%
- Common ancestry
- Lithuanian 1% Portuguese 1% Slovak 1%
- Foreign-born
- 4% · Canada, Vietnam
- Languages at home
- 93% English-only · Spanish 6%
Political lean MEDSL · Wichita
- 2024 margin
- Solid R (+44.0) · D 27.5% · R 71.5%
- 2008→2024 swing
- -5.2pp toward R · 2008: -38.9pp · 2024: -44.0pp
- All cycles
- 2024: R+44.0 2020: R+41.1 2016: R+49.7 2012: R+47.1 2008: R+38.9
Not yet ingested
- Civics
- —
Market trends
- HPI YoY
- ▲ 24.29%
- Current HPI
- 387.78
- Rent YoY
- —
- Metro
- —
- State GDP YoY
- ▲ 3.95%
- F500 in state
- 110
Industry mix (Fortune 500 HQ in TX)
| Industry | F500 HQs | Revenue |
|---|---|---|
| Energy | 16 | $1,198B |
|
||
| Technology | 5 | $198B |
|
||
| Engineering / Construction | 4 | $72B |
|
||
| Energy Services | 3 | $60B |
|
||
| Utilities | 3 | $41B |
|
||
| Healthcare | 2 | $330B |
|
||
Price history
+71.3% since first listed5 events — show timeline
- 2026-05-27 Listed $149,900 WFAOR
- 2018-08-21 Sold (Public Records) — Public Records
- 2018-08-20 Sold (MLS) — WFAOR
- 2018-06-09 Listed $87,500 WFAOR
- 2005-05-12 Sold (Public Records) — Public Records
Property tax history
+7.0%/yrLatest (2025): $3,533 · -0.2% YoY. Source: county tax records.
Cash-flow waterfall
monthlySold comps — $/sqft
last 12 mo · ≤1 miLoading sold comps…