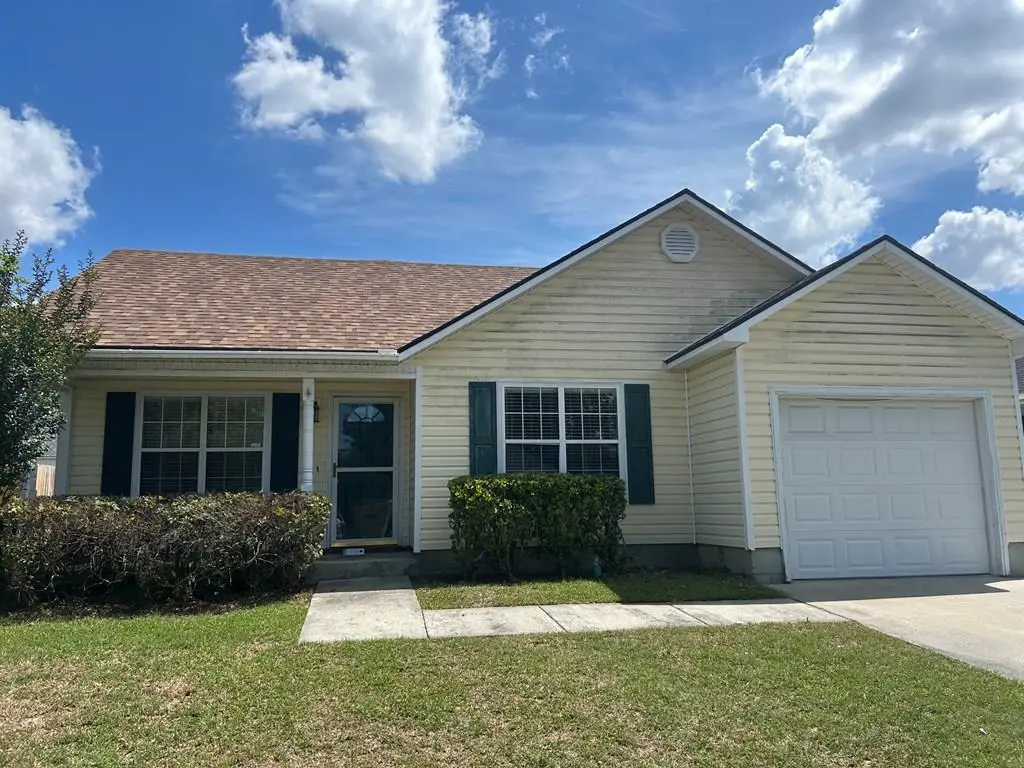
3028 Schroer Dr · Valdosta, GA
Flood risk 1/10 · Minimal
- FEMA flood zone
- X (unshaded)
- Chance of flooding over 30 yrs
- 0.0%
- Est. flood insurance / yr
- $507 – $1,088
Fire risk 4/10 · Minor
- Est. fire insurance / yr
- $963 – $1,789
Heat risk 8/10 · Major
- Hot days now (above 108°F)
- 7 days/yr
- Hot days in 30 yrs
- 21 days/yr
Wind risk 8/10 · Major
- Chance of severe wind over 30 yrs
- 99.0%
Air-quality risk 6/10 · Moderate
- Unhealthy air days now
- 10 days/yr
- Unhealthy air days in 30 yrs
- 11 days/yr
Risk factors via First Street. Map © Google.
Why this score? — see what drove the D grade
The composite is a weighted blend of 9 inputs, each scored 0–100. Each bar is that input's sub-score; the figure is the points it added to the 100-point composite (weight × sub-score).
- Cash flow +15.4/30.0
- ARV discount +8.6/15.0
- DSCR +4.7/10.0
- Rent growth +3.8/5.0
- 1% rule +3.5/10.0
- Livability +3.0/5.0
- Condition / age +2.5/5.0
- Schools +1.5/10.0
- Appreciation +0.0/10.0
$165,000
🖨 Deal sheet (PDF) 📄 Offer letter ✓ Due diligence
Listing remarks
This is a real deal, Large GR with plenty or room for large furniture. Large kitchen with all appliance presently in the kitchen, breakfast bar, Nice dining room, Nice sized master bedroom and a walk in closet plus shower tub combo, separate dressing area. 2 other nice sized Bedrooms and a good size hall bathroom. single garage, fenced yard, vinyl siding. Front porch, Make this nice home your home today.
Key facts
- Fenced yard
- Front porch
- Large kitchen
Tags
Property features AI
Exterior
- Parking: 1-car garage with garage door opener
- Utilities: Public water; Public sewer
- Home design: Single-family residence; 1 story; Vinyl siding construction
- Construction: Vinyl siding
- Exterior features: Fenced yard
Interior
- Kitchen: Dishwasher; Refrigerator
- Flooring: Carpet; Laminate; Vinyl
- Bathrooms: 2 full bathrooms
- Interior features: Dishwasher; Refrigerator
- Laundry & utility: Dedicated laundry room
Neighborhood map
What this means for you Summary
Snapshot
- This is a 3-bed/2.0-bath single-family listed at $165k.
Deal economics
- At list price, monthly cash flow is $63 ($761/yr) — positive.
- The deal already cash-flows at list — no discount required.
- To meet the 1% rule (rent ≥ 1% of price), the offer needs to be $140k (15.0% below list).
- Recommended offer: $140k (15.0% below list) — sets the bar for 1% rule.
- Cap rate 6.8% vs local median 4.3% in Valdosta — top-decile yield for the area; either an underpriced asset or a hidden risk that comps aren't pricing in. Stress-test before assuming the spread holds.
Location & tenants
- Location reads 60/100 on livability (#392 in GA) — a middle-class / working-renter tenant base. Strengths: cost of living A+, health & safety A+, housing A-; Watch: crime F, amenities F, commute F.
- Valdosta City (urban): math 15% / reading 22% proficiency, ranked #149 of 174 in GA (top 86%) — low school quality limits family demand, transient renter base, plan for 1-2y turnover; 74% free/reduced lunch — lower-income household profile, screen leases tightly.
- Zoned schools: Sallas Mahone Elementary (math 22% / reading 21%, grade F, #845 of 1,228 statewide, top 69%, 1,078 students, 90% FRL); Valdosta Middle School (math 17% / reading 32%, grade F, #301 of 470 statewide, top 66%, 1,060 students, 95% FRL); Valdosta High School (math 7% / reading 24%, grade F, #290 of 424 statewide, top 69%, 2,381 students, 95% FRL) — zoned schools average 93% FRL vs 74% district-wide (19 pts higher); higher-poverty schools than district average — tighter screening recommended.
- Market conditions: Rents rising fast (+5.1%/yr); 233 active listings in the ZIP; 40 comparable units currently listed for rent nearby; rentals lingering (median 46d on market — plan ~5-8 weeks vacancy on turnover, expect pricing pressure); 58% of comp listings sitting > 30 days — soft ceiling on asking rent; solid renter incomes; 896 units permitted in Lowndes County in 2024 (0 in 5+ unit buildings).
Forward outlook
- Local home prices are declining (-3.0%/yr); year-one equity from $1k of loan paydown is wiped out by about $5k of value loss. Plan a longer hold.
- Lowndes County population projected at +10% by 2050 — modest demand growth; plan on rents tracking national, not racing it.
Negotiation context
- It's been on market 19 days — a 2% lower offer ($163k) is reasonable based on typical stale-listing flexibility.
- Current owner paid $77k; list at $165k implies a 114% gain — meaningful room to come down on a strong offer.
Risks & watch-outs
- Climate carrying-cost: severe wind risk, 99% chance of damaging wind over 30y; extreme-heat days projected 7→21/yr by 2055 (HVAC capex compounding) — expect insurance premiums to compound above CPI over the hold.
Questions for the listing agent
- Is there a deadline driving the sale (1031 exchange, divorce, estate, relocation)? That informs how much negotiation room exists.
- Schools are F-rated, which usually means shorter tenancies and higher turnover. Who's the typical renter profile here, and what's been the actual vacancy rate?
- Crime grade is F in this area — have there been break-ins, vandalism, or insurance claims at this property in the last 3 years? What carrier currently insures it and at what premium?
- The area grade is low — what's the realistic commute time and amenity access for the typical tenant pool here? Any planned neighborhood developments (good or bad) we should know about?
- What's the average days-on-market for RENTAL listings here right now (not sales)? A rising rental-DOM trend means longer vacancies and softer asking-rent achievability than the comps imply.
- What's the recent tenant-quality profile in this submarket — average credit score on applications, eviction rate, late-payment / NSF rate, and stable-employment percentage? A property-management company in the area should have these aggregated.
- How much new for-sale + rental construction is in the pipeline within 1–3 miles? Heavy new supply typically softens prices + rents 12–24 months out; constrained supply supports both.
Investment metrics
- 1% rule
- 0.85% ✗
- Cap rate
- 6.75%
- Cash-on-cash
- 1.65%
- DSCR
- 1.07
- GRM
- 9.8
CMA / ARV
- ARV (on-the-fly)
- $168,960
- Comps found
- 12
Show comp detail 12 sales within ~0.75 mi
| Address | Dist | Beds/Ba | Sqft | Sold | Price | $/sf | Match |
|---|---|---|---|---|---|---|---|
| 3246 Wingfield Way | 0.27mi | 3/2.0 | 1,336 (+1%) | 4mo | $199,900 | $150 | 82 |
| 3017 Amy Cir | 0.21mi | 3/2.0 | 1,294 (-2%) | 9mo | $160,000 | $124 | 80 |
| 3077 Schroer Dr | 0.17mi | 3/2.0 | 1,229 (-7%) | 12mo | $170,000 | $138 | 71 |
| 203 Blue Pool Dr | 0.23mi | 3/2.0 | 1,123 (-15%) | 1mo | $145,000 | $129 | 63 |
| 3013 Kensington Ln | 0.30mi | 3/2.0 | 1,177 (-11%) | 8mo | $144,000 | $122 | 61 |
| 2712 Clayton Dr | 0.69mi | 3/2.0 | 1,312 (-1%) | 8mo | $168,000 | $128 | 60 |
| 3118 Wingfield Way | 0.33mi | 3/2.0 | 1,443 (+9%) | 11mo | $214,000 | $148 | 59 |
| 237 Blue Pool Dr | 0.16mi | 3/2.0 | 1,126 (-15%) | 12mo | $143,000 | $127 | 58 |
| 4002 Mulberry Pl | 0.65mi | 3/2.0 | 1,402 (+6%) | 9mo | $180,000 | $128 | 52 |
| 419 University Dr | 0.63mi | 3/2.0 | 1,233 (-7%) | 12mo | $168,000 | $136 | 49 |
| 339 Brookfield Rd | 0.29mi | 2/2.5 (-1) | 1,139 (-14%) | 13mo | $99,900 | $88 | 46 |
| 4006 Mulberry Pl | 0.70mi | 3/2.0 | 1,496 (+13%) | 10mo | $189,680 | $127 | 37 |
Match score weights: distance 35% · size 25% · config 20% · recency 20%. Top-matched comps best support the ARV.
Projected returns pro-forma
-3.0% appreciation · 5.07% rent growth · sell at horizon
- IRR
- -11.6%
- Equity multiple
- 0.57×
- Total profit
- $-19,753
- Equity at exit
- $24,602
- IRR
- 0.2%
- Equity multiple
- 1.01×
- Total profit
- $619
- Equity at exit
- $14,266
Cash invested: $46,200 (down + closing). Projections, not guarantees.
Landlord ↔ Tenant lean methodology
- Overall (STATE)
- 90 Strongly Landlord-Friendly
- State Georgia
- 90 Strongly Landlord-Friendly · R+3
- County
- — inherits STATE
- City
- — inherits STATE
ZIP-level market 31605
- Home prices YoY
- -11.5%
- Rents YoY
- 5.1%
- Active inventory
- 233
- Price-to-rent
- 9.8×
Monthly cashflow live
- Estimated rent
- $1,403 high interval (Pro) →
- Mortgage (P&I)
- −$865
- Tax from tax record
- −$111 /mo · $1,334/yr
- Insurance
- −$69
- HOA
- −$0
- Vacancy / Maint / Mgmt
- −$295
- Net cashflow
- $63
Break-even live
Sensitivity live
| Price | -10% $157 | -5% $110 | +0% $63 | +5% $17 | +10% $-30 |
|---|---|---|---|---|---|
| Rent | -10% $-47 | -5% $8 | +0% $63 | +5% $119 | +10% $174 |
| Rate | -1.0pp $147 | -0.5pp $105 | base $63 | +0.5pp $21 | +1.0pp $-23 |
UW: 25.0% down · 7.5% · 30yr · 1.5% tax · 5.0% vac · 8.0% maint · 8.0% mgmt
Financing live
Cash to close
- Down payment
- $41,250
- Closing costs
- $4,950
- Reserves months
- —
- Total cash needed
- —
Loan-product check · same deal, 3 products live
Conventional
25% down · 7.5% · 30yr
- Down + closing
- —
- Monthly P&I
- —
- Monthly cashflow
- —
- DSCR
- —
- Eligible?
- —
Personal DTI + credit; lowest rate.
DSCR
20% down · 8.5% · 30yr
- Down + closing
- —
- Monthly P&I
- —
- Monthly cashflow
- —
- DSCR
- —
- Eligible?
- —
No personal income docs; deal must DSCR.
Hard money
10% down · 12.0% · 12mo
- Down + closing
- —
- Monthly P&I
- —
- Monthly cashflow
- —
- DSCR
- —
- Eligible?
- —
Short-term bridge; refi at stabilization.
Rent comps 40 comps
| Address | Beds | Baths | Sqft | Rent | $/sqft | DOM | Units | Dist |
|---|---|---|---|---|---|---|---|---|
| 3027 Schroer Dr Valdosta, GA | 3.0 | 2.0 | 1184 | $1,295 | $1.09 | 45d | 1 | 0.02mi |
| 3024 Will Dr Valdosta, GA | 3.0 | 2.0 | 1200 | $1,295 | $1.08 | 45d | 1 | 0.03mi |
| 334 Sawgrass Dr Valdosta, GA | 3.0 | 2.0 | 1150 | $1,595 | $1.39 | 23d | 1 | 0.19mi |
| 522 Heritage Pl Valdosta, GA | 2.0 | 1.0 | 979 | $1,050 | $1.07 | 45d | 1 | 0.21mi |
| 439 Heritage Pl Valdosta, GA | 2.0 | 1.0 | 983 | $1,025 | $1.04 | 23d | 1 | 0.22mi |
| 422 Connell Rd Valdosta, GA | 2.0 | 3.0 | 1125 | $1,050 | $0.93 | 23d | 1 | 0.28mi |
| 360 Brookfield Rd Valdosta, GA | 3.0 | 2.5 | 1278 | $1,100 | $0.86 | 45d | 1 | 0.30mi |
| 141 Blue Pool Dr Valdosta, GA | 3.0 | 2.0 | 1109 | $1,200 | $1.08 | 23d | 1 | 0.30mi |
| 420 Connell Rd Valdosta, GA | 1.0–3.0 | 1.0–2.0 | 1051 | $1,375 | $1.31 | 23d | 8 | 0.34mi |
| 5 Kensington Cir Valdosta, GA | 3.0 | 2.0 | 1150 | $1,495 | $1.30 | 23d | 1 | 0.35mi |
| 3 Meadow Run Cir Unit F Valdosta, GA | 2.0 | 1.0 | 920 | $895 | $0.97 | 45d | 1 | 0.39mi |
| 6 Meadow Run Cir Unit F Valdosta, GA | 2.0 | 1.0 | 920 | $895 | $0.97 | 45d | 1 | 0.44mi |
| 411 Northside Dr Valdosta, GA | 2.0 | 2.0 | 950 | $795 | $0.84 | 45d | 1 | 0.53mi |
| 411 Northside Dr Unit G5 Valdosta, GA | 2.0 | 1.5 | 950 | $795 | $0.84 | 45d | 1 | 0.53mi |
| 100 Garden Dr Valdosta, GA | 1.0–3.0 | 1.0–3.0 | 885 | $2,075 | $2.34 | 23d | 13 | 0.57mi |
| 3925 N Oak Street Ext Valdosta, GA | 1.0–2.0 | 1.0–2.0 | 971 | $1,225 | $1.26 | 23d | 1 | 0.75mi |
| 3833 N Oak Street Ext Valdosta, GA | 1.0–3.0 | 1.0–2.0 | 1022 | $1,410 | $1.38 | 23d | 31 | 0.77mi |
| 2437 University Dr Valdosta, GA | 3.0 | 1.0 | 879 | $1,175 | $1.34 | 45d | 1 | 0.80mi |
| 3000 Ginny Dr Valdosta, GA | 3.0 | 2.0 | 1174 | $1,200 | $1.02 | 45d | 1 | 0.85mi |
| 2305 Bemiss Rd Unit T16 Valdosta, GA | 2.0 | 1.5 | 896 | $850 | $0.95 | 45d | 1 | 0.87mi |
| 3276 Oak Garden Dr Valdosta, GA | 2.0 | 2.0 | 1040 | $1,425 | $1.37 | 45d | 1 | 0.88mi |
| 4112 Oak Dr Valdosta, GA | 3.0 | 2.0 | 1349 | $1,250 | $0.93 | 23d | 1 | 0.95mi |
| 4022 Camellia Dr Unit 1 Valdosta, GA | 2.0 | 1.0 | 1040 | $895 | $0.86 | 23d | 1 | 0.95mi |
| 3902 Danube Cir Valdosta, GA | 3.0 | 2.0 | 1208 | $1,150 | $0.95 | 45d | 1 | 0.97mi |
| 611 Pineview Dr Valdosta, GA | 1.0–3.0 | 1.0–2.5 | 1204 | $1,600 | $1.33 | 23d | 3 | 0.97mi |
| 4114 Oak Dr Unit 7 Valdosta, GA | 2.0 | 1.0 | 984 | $850 | $0.86 | 23d | 1 | 0.97mi |
| 2600 Deborah Dr Valdosta, GA | 3.0 | 1.0 | 1333 | $1,495 | $1.12 | 45d | 1 | 1.01mi |
| 407 Northfield Rd Valdosta, GA | 3.0 | 2.0 | 1505 | $1,395 | $0.93 | 23d | 1 | 1.09mi |
| 413 Georgetown Cir Valdosta, GA | 2.0 | 2.0 | 1178 | $1,400 | $1.19 | 45d | 1 | 1.14mi |
| 2878 Fawnwood Cir Valdosta, GA | 3.0 | 2.0 | 1400 | $3,000 | $2.14 | 45d | 1 | 1.21mi |
| 3106 Sundance Cir Valdosta, GA | 2.0 | 1.0 | 891 | $750 | $0.84 | 45d | 1 | 1.21mi |
| 2205 Bemiss Rd Valdosta, GA | 2.0 | 1.0 | 880 | $1,095 | $1.24 | 45d | 3 | 1.22mi |
| 2324 Sterling Pl Valdosta, GA | 3.0 | 1.0 | 1124 | $1,095 | $0.97 | 23d | 1 | 1.27mi |
| 2859 Fawnwood Cir Valdosta, GA | 2.0 | 2.0 | 1173 | $1,400 | $1.19 | 23d | 1 | 1.28mi |
| 3120 Tyndall Dr Valdosta, GA | 3.0 | 3.0 | 1200 | $1,500 | $1.25 | 45d | 1 | 1.30mi |
| 1005 Langdale Dr Unit B Valdosta, GA | 2.0 | 1.0 | 879 | $700 | $0.80 | 23d | 1 | 1.39mi |
| 1717 Largo Cir Valdosta, GA | 3.0 | 2.0 | 1206 | $1,495 | $1.24 | 45d | 1 | 1.42mi |
| 713 Lakeland Ave Valdosta, GA | 2.0 | 1.0 | 1047 | $895 | $0.85 | 45d | 1 | 1.46mi |
| 4125 Sedgwyck Ln Valdosta, GA | 3.0 | 2.0 | 1234 | $1,350 | $1.09 | 45d | 1 | 1.47mi |
| 1109 Timber Line Dr Valdosta, GA | 3.0 | 2.0 | 1436 | $1,300 | $0.91 | 45d | 1 | 1.50mi |
Listing history 14 events
-
2026-06-08status $165,000 Pending 19 DOM
-
2026-06-07days on market $165,000 Active 19 DOM
-
2026-06-05days on market $165,000 Active 16 DOM
-
2026-06-03days on market $165,000 Active 15 DOM
-
2026-06-02days on market $165,000 Active 14 DOM
-
2026-06-01days on market $165,000 Active 13 DOM
-
2026-05-31days on market $165,000 Active 12 DOM
-
2026-05-30days on market $165,000 Active 11 DOM
-
2026-05-19price $165,000
-
2026-05-19$165 Active
-
2017-05-31soldstatus $77,000
-
2007-08-21soldstatus $110,600
-
2004-06-24soldstatus $83,500
-
2000-11-28soldstatus $76,900
ⓘ Source: listings_history table (triggers on properties + properties_extension) + one-shot
backfill from property_details.listing_events for pre-trigger history.
Tax reassessment forecast GA · Resets to sale price
- Current annual tax
- $1,334 · $111/mo
- Projected year-2 tax
- $1,518 · $126/mo
- Expected delta
- +$184/yr (+$15/mo · 13.8%)
ⓘ Screening estimate from a state-policy table — verify with the county assessor before closing.
Climate risk First Street
- Flood 1/10 Low FEMA zone X (unshaded) · 0% chance over 30 yrs
- Wildfire 4/10 Moderate
- Heat 8/10 Severe 7 d/yr ≥108°F today · 21 d/yr by 30 yrs out
- Wind 8/10 Severe 99% chance of damaging wind over 30 yrs
- Air quality 6/10 Major 10 unhealthy d/yr today · 11 by 30 yrs out
Nearby sold comps map
Loading sold comps map…
Walkable amenities ~0.75 mi
Loading nearby amenities…
Taxation est. · year 1
- Rental income
- $16,839
- − Mortgage interest
- −$9,243
- − Property taxes
- −$1,334
- − Insurance
- −$825
- − Repairs & maintenance
- −$1,347
- − Management
- −$1,347
- − Depreciation
- −$4,800
- Taxable loss
- −$2,056
- Est. tax savings @ 24.0%
- +$494
- After-tax cash flow
- $1,254/yr
For passive investors: Depreciation is non-cash, so a rental often shows a tax loss while cash-flowing — sheltering income. Rental losses are passive: they offset passive income freely, and up to $25,000/yr can offset ordinary (W-2) income if you actively participate and your MAGI is under $100k (phasing out to $0 by $150k); unused losses carry forward. On sale, claimed depreciation is recaptured at up to 25%, and gains may owe capital-gains tax (a 1031 exchange can defer both). Figures are a year-1 estimate at your 24.0% rate — not tax advice; consult a CPA.
Schools (NCES district)
- District
- Valdosta City
- NCES district ID
- 1305310
- Math proficiency
- 15% ▼ -12.00%
- Reading proficiency
- 22% ▼ -7.00%
- Median HH income
- $30,634
- Composite
- 14.79/100
- National rank
- #9388
- State rank
- #149 of 174 in GA
Livability — Valdosta
- Score
- 60/100
- State rank
- #392
- US rank
- #19544
Category grades
Schools grade is shown separately in the Schools card above.
Census & demographics
- Census place
- Valdosta, GA
- County
- Lowndes County · 107,801 people
- City population
- 91,859
- Metro
- Valdosta, GA
- Population (ZIP)
- 24,829
- Household income
- $79,156
- Rent vs Own
- Severe rent burden
- 642.0
Population outlook (Lowndes County) Hauer SSP2
- Today (2025)
- 120,348 people
- By 2030
- 123,469 · +2.6%
- By 2040
- 128,482 · +6.8%
- By 2050
- 131,907 · +9.6%
- By 2075
- 139,080 · +15.6%
- By 2100
- 133,649 · +11.1%
Race, ethnicity, and origin ACS 2023
- Neighborhood character
- Diverse neighborhood (Simpson 0.58)
- Race & ethnicity
- White 58% Black 27% Two or more races 7% Hispanic / Latino 7% Asian 2%
- Hispanic origin (detail)
- Mexican 3% Puerto Rican 3%
- Common ancestry
- Italian 2% Slovak 2% Lithuanian 2%
- Foreign-born
- 4% · Canada, South Korea, Vietnam
- Languages at home
- 93% English-only · Spanish 3% German/W. Germanic 1%
Political lean MEDSL · Lowndes
- 2024 margin
- R (+18.0) · D 40.8% · R 58.8%
- 2008→2024 swing
- -8.6pp toward R · 2008: -9.4pp · 2024: -18.0pp
- All cycles
- 2024: R+18.0 2020: R+12.0 2016: R+18.2 2012: R+10.5 2008: R+9.4
Not yet ingested
- Civics
- —
Market trends
- HPI YoY
- ▼ -24.74%
- Current HPI
- 189.8471
- Rent YoY
- ▲ 5.07%
- Metro
- Valdosta, GA
- State GDP YoY
- ▲ 2.66%
- F500 in state
- 28
Industry mix (Fortune 500 HQ in GA)
| Industry | F500 HQs | Revenue |
|---|---|---|
| Paper / Packaging | 2 | $29B |
|
||
| Retail | 1 | $160B |
|
||
| Transportation / Logistics | 1 | $91B |
|
||
| Airlines | 1 | $62B |
|
||
| Consumer Goods | 1 | $47B |
|
||
| Utilities | 1 | $25B |
|
||
Price history
+114.6% since first listed7 events — show timeline
- 2026-06-07 Pending — SGMLS
- 2026-05-19 Price Changed $165,000 SGMLS
- 2026-05-19 Listed $165 SGMLS
- 2017-05-31 Sold (Public Records) $77,000 Public Records
- 2007-08-21 Sold (Public Records) $110,600 Public Records
- 2004-06-24 Sold (Public Records) $83,500 Public Records
- 2000-11-28 Sold (Public Records) $76,900 Public Records
Property tax history
+3.4%/yrLatest (2025): $1,334 · -3.8% YoY. Source: county tax records.
Cash-flow waterfall
monthlySold comps — $/sqft
last 12 mo · ≤1 miLoading sold comps…