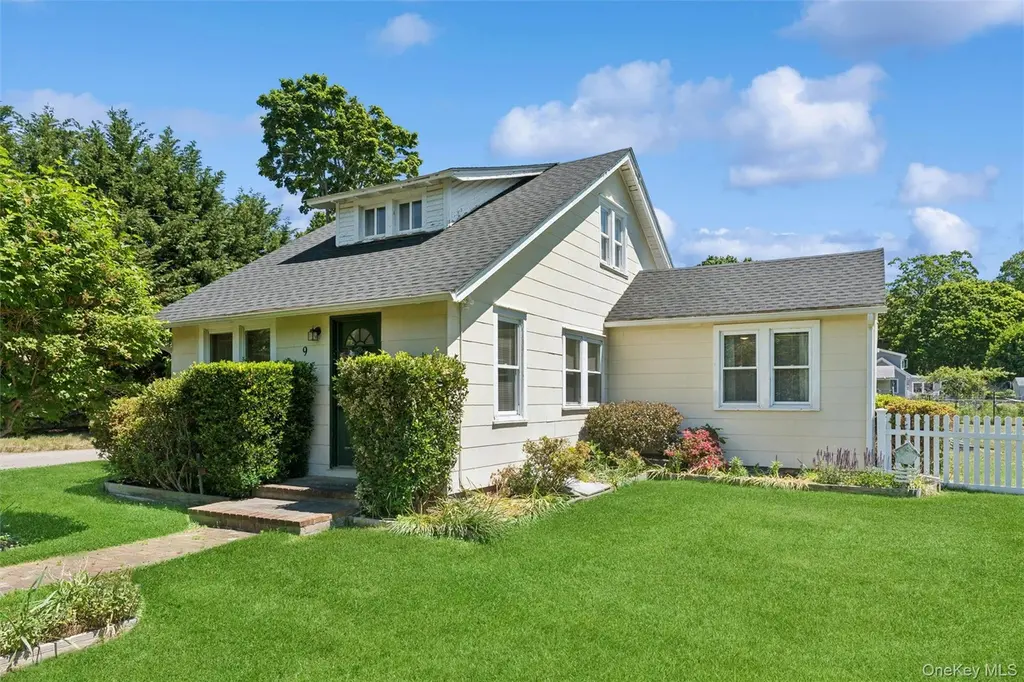
9 7th St · Jamesport, NY
Flood risk No data
- FEMA flood zone
- —
- Chance of flooding over 30 yrs
- —
- Est. flood insurance / yr
- —
Fire risk No data
- Est. fire insurance / yr
- —
Heat risk No data
- Hot days now (above threshold)
- —
- Hot days in 30 yrs
- —
Wind risk No data
- Chance of severe wind over 30 yrs
- —
Air-quality risk No data
- Unhealthy air days now
- —
- Unhealthy air days in 30 yrs
- —
Risk factors via First Street. Map © Google.
Why this score? — see what drove the B- grade
The composite is a weighted blend of 9 inputs, each scored 0–100. Each bar is that input's sub-score; the figure is the points it added to the 100-point composite (weight × sub-score).
- Cash flow +22.1/30.0
- ARV discount +15.0/15.0
- DSCR +7.1/10.0
- 1% rule +5.1/10.0
- Appreciation +5.0/10.0
- Schools +3.6/10.0
- Rent growth +2.5/5.0
- Condition / age +2.5/5.0
- Livability +2.3/5.0
$749,500
🖨 Deal sheet (PDF) 📄 Offer letter ✓ Due diligence
Listing remarks
Comfortable living and the opportunity to enjoy the North Fork lifestyle year-round or seasonally. The home's flexible layout provides multiple living spaces and plenty of potential for a new owner to personalize and make it their own. Whether you're looking for a primary residence, weekend retreat, or investment property, this home and spacious property present a wonderful opportunity in a desirable location. Conveniently situated just minutes from the Jamesport hamlet, local beaches, wineries, farm stands, restaurants, and shopping, you'll enjoy easy access to everything that makes the North Fork so special. Come discover the possibilities and make this Jamesport property your next home.
Key facts
- Easy access
- Flexible layout
- Desirable location
Tags
Property features AI
Exterior
- Parking: Detached parking; Driveway; 1-car garage
- Utilities: Cesspool sewer; Cable available
- Home design: Single family residence
- Construction: Frame construction; Partial attic
- Exterior features: Patio; Back yard; Fenced yard (partial); Corner lot
Interior
- Kitchen: Cooktop; Oven; Dishwasher; Refrigerator; Eat-in layout; Open kitchen with walk-through access
- Bedrooms: Includes a first-floor bedroom
- Bathrooms: 2 full bathrooms
- Heating & cooling: Natural gas heating; Central air conditioning
- Interior features: First-floor bedroom; First-floor full bathroom; Eat-in kitchen; Entrance foyer; Open kitchen; Walk-through kitchen; Walk-in closet(s); Patio
- Laundry & utility: Washer; Dryer; Unfinished basement with Bilco doors
Neighborhood map
What this means for you Summary
Snapshot
- This is a 4-bed/2.0-bath single-family listed at $750k.
Deal economics
- At list price, monthly cash flow is $1k ($14k/yr) — positive.
- The deal already cash-flows at list — no discount required.
- Meets the 1% rule at list price ($8k rent vs $750k).
Location & tenants
- Location reads 46/100 on livability (#1,185 in NY) — a working-class tenant base; expect higher turnover. Strengths: housing A+, crime A; Watch: amenities F, commute F, employment F.
- Riverhead Central School District (suburban): math 34% / reading 48% proficiency, ranked #489 of 590 in NY (top 83%) — families likely to look elsewhere, expect single-tenant / working-renter base with shorter leases.
- Zoned schools: Aquebogue Elementary School (math 47% / reading 57%, grade C-, #988 of 2,108 statewide, top 49%, 474 students, 40% FRL); Riverhead Middle School (math 18% / reading 35%, grade F, #594 of 729 statewide, top 81%, 827 students, 57% FRL); Riverhead Senior High School (math 80% / reading 86%, grade A, #440 of 1,100 statewide, top 40%, 2,001 students, 52% FRL).
- Zoned-school proficiency averages 54% at this address vs 41% district-wide (+13 pts) — the actual schools serving this property are materially stronger than the Riverhead Central School District average implies; a family-tenant draw the district grade alone would hide.
- Market conditions: 18 active listings in the ZIP; 4 comparable units currently listed for rent nearby; rentals lingering (median 45d on market — plan ~5-8 weeks vacancy on turnover, expect pricing pressure); 50% of comp listings sitting > 30 days — soft ceiling on asking rent; 1,366 units permitted in Suffolk County in 2024 (216 in 5+ unit buildings).
Forward outlook
- In year one you build about $28k of equity ($5k loan paydown + $22k appreciation (3.0% local appreciation)).
- Suffolk County population projected to shrink 5% by 2050 — rents likely to lag national; underwrite the cash flow, not the appreciation.
- At projected returns (3.0% appreciation + 3.0% rent growth), your $210k cash investment doubles in ~5 years — after that, you're playing with house money.
- By year 2, paydown + projected appreciation supports a ~$45k cash-out refi (75% LTV) — recoverable capital for the next deal without selling this one.
Negotiation context
- Only 9 days on market — expect competitive offers; lowballing is unlikely to land.
Risks & watch-outs
- Watch-outs: built in 1935 — expect roof / HVAC / electrical / plumbing capex.
Questions for the listing agent
- Built in 1935 — when were the roof, HVAC, electrical panel, plumbing, and water heater last replaced?
- Is there a deadline driving the sale (1031 exchange, divorce, estate, relocation)? That informs how much negotiation room exists.
- What's the average days-on-market for RENTAL listings here right now (not sales)? A rising rental-DOM trend means longer vacancies and softer asking-rent achievability than the comps imply.
- What's the recent tenant-quality profile in this submarket — average credit score on applications, eviction rate, late-payment / NSF rate, and stable-employment percentage? A property-management company in the area should have these aggregated.
- How much new for-sale + rental construction is in the pipeline within 1–3 miles? Heavy new supply typically softens prices + rents 12–24 months out; constrained supply supports both.
Investment metrics
- 1% rule
- 1.01% ✓
- Cap rate
- 8.22%
- Cash-on-cash
- 6.90%
- DSCR
- 1.31
- GRM
- 8.3
CMA / ARV
- ARV (on-the-fly)
- $957,264
- Comps found
- 6
Show comp detail 6 sales within ~0.75 mi
| Address | Dist | Beds/Ba | Sqft | Sold | Price | $/sf | Match |
|---|---|---|---|---|---|---|---|
| 898 Peconic Bay Blvd | 0.17mi | 3/2.0 (-1) | 1,772 (-0%) | 3mo | $955,000 | $539 | 84 |
| 56 Dougs Ln | 0.43mi | 3/2.0 (-1) | 1,800 (+1%) | 4mo | $910,000 | $506 | 70 |
| 27 White Birch Ct | 0.34mi | 4/2.0 | 1,700 (-4%) | 20mo | $849,000 | $499 | 60 |
| 44 Legend Ln | 0.42mi | 3/2.5 (-1) | 1,922 (+8%) | 0mo | $1,095,000 | $570 | 59 |
| 105 Lockitt Dr | 0.50mi | 3/3.0 (-1) | 1,571 (-12%) | 6mo | $1,950,000 | $1,241 | 44 |
| 21 Lagoon Ct | 0.63mi | 3/3.0 (-1) | 1,900 (+7%) | 18mo | $975,000 | $513 | 35 |
Match score weights: distance 35% · size 25% · config 20% · recency 20%. Top-matched comps best support the ARV.
Projected returns pro-forma
3.0% appreciation · 3.0% rent growth · sell at horizon
- IRR
- 13.9%
- Equity multiple
- 1.80×
- Total profit
- $166,942
- Equity at exit
- $337,008
- IRR
- 15.8%
- Equity multiple
- 3.32×
- Total profit
- $486,569
- Equity at exit
- $519,369
Cash invested: $209,860 (down + closing). Projections, not guarantees.
Landlord ↔ Tenant lean methodology
- Overall (STATE)
- 15 Strongly Tenant-Friendly
- State New York
- 15 Strongly Tenant-Friendly · D+10
- County
- — inherits STATE
- City
- — inherits STATE
ZIP-level market 11947
- Active inventory
- 18
- Price-to-rent
- 8.3×
Monthly cashflow live
- Estimated rent
- $7,538 medium interval (Pro) →
- Mortgage (P&I)
- −$3,930
- Tax from tax record
- −$506 /mo · $6,074/yr
- Insurance
- −$312
- HOA
- −$0
- Vacancy / Maint / Mgmt
- −$1,583
- Net cashflow
- $1,206
Break-even live
Sensitivity live
| Price | -10% $1,630 | -5% $1,418 | +0% $1,206 | +5% $994 | +10% $782 |
|---|---|---|---|---|---|
| Rent | -10% $610 | -5% $908 | +0% $1,206 | +5% $1,504 | +10% $1,801 |
| Rate | -1.0pp $1,583 | -0.5pp $1,397 | base $1,206 | +0.5pp $1,012 | +1.0pp $814 |
UW: 25.0% down · 7.5% · 30yr · 1.5% tax · 5.0% vac · 8.0% maint · 8.0% mgmt
Financing live
Cash to close
- Down payment
- $187,375
- Closing costs
- $22,485
- Reserves months
- —
- Total cash needed
- —
Loan-product check · same deal, 3 products live
Conventional
25% down · 7.5% · 30yr
- Down + closing
- —
- Monthly P&I
- —
- Monthly cashflow
- —
- DSCR
- —
- Eligible?
- —
Personal DTI + credit; lowest rate.
DSCR
20% down · 8.5% · 30yr
- Down + closing
- —
- Monthly P&I
- —
- Monthly cashflow
- —
- DSCR
- —
- Eligible?
- —
No personal income docs; deal must DSCR.
Hard money
10% down · 12.0% · 12mo
- Down + closing
- —
- Monthly P&I
- —
- Monthly cashflow
- —
- DSCR
- —
- Eligible?
- —
Short-term bridge; refi at stabilization.
Rent comps 4 comps
| Address | Beds | Baths | Sqft | Rent | $/sqft | DOM | Units | Dist |
|---|---|---|---|---|---|---|---|---|
| 23 Scallop Ln South Jamesport, NY | 3.0 | 2.0 | 1285 | $25,000 | $19.46 | 44d | 1 | 0.48mi |
| 1727 Main Rd Unit 1538864P Laurel, NY | 3.0 | 2.5 | 1937 | $7,548 | $3.90 | 14d | 1 | 0.79mi |
| 144 Manor Ln Jamesport, NY | 4.0 | 2.5 | 2100 | $9,500 | $4.52 | 5d | 1 | 0.85mi |
| 33 Beach Rd Laurel, NY | 3.0 | 2.5 | 1607 | $4,500 | $2.80 | 44d | 1 | 1.40mi |
Listing history 7 events
-
2026-06-21days on market $749,500 Active 9 DOM
-
2026-06-18days on market $749,500 Active 6 DOM
-
2026-06-17days on market $749,500 Active 5 DOM
-
2026-06-16days on market $749,500 Active 4 DOM
-
2026-06-15days on market $749,500 Active 3 DOM
-
2026-06-13remarks 698-char remark
-
2026-06-13$749,500 Active 1 DOM
ⓘ Source: listings_history table (triggers on properties + properties_extension) + one-shot
backfill from property_details.listing_events for pre-trigger history.
Tax reassessment forecast NY · Partial reset (capped growth)
- Current annual tax
- $6,074 · $506/mo
- Projected year-2 tax
- $9,371 · $781/mo
- Expected delta
- +$3,296/yr (+$275/mo · 54.3%)
ⓘ Screening estimate from a state-policy table — verify with the county assessor before closing.
Nearby sold comps map
Loading sold comps map…
Walkable amenities ~0.75 mi
Loading nearby amenities…
Taxation est. · year 1
- Rental income
- $90,454
- − Mortgage interest
- −$41,984
- − Property taxes
- −$6,074
- − Insurance
- −$3,748
- − Repairs & maintenance
- −$7,236
- − Management
- −$7,236
- − Depreciation
- −$21,804
- Taxable income
- $2,372
- Est. tax owed @ 24.0%
- −$569
- After-tax cash flow
- $13,902/yr
For passive investors: Depreciation is non-cash, so a rental often shows a tax loss while cash-flowing — sheltering income. Rental losses are passive: they offset passive income freely, and up to $25,000/yr can offset ordinary (W-2) income if you actively participate and your MAGI is under $100k (phasing out to $0 by $150k); unused losses carry forward. On sale, claimed depreciation is recaptured at up to 25%, and gains may owe capital-gains tax (a 1031 exchange can defer both). Figures are a year-1 estimate at your 24.0% rate — not tax advice; consult a CPA.
Schools (NCES district)
- District
- Riverhead Central School District
- NCES district ID
- 3624690
- Math proficiency
- 34% ▼ -4.00%
- Reading proficiency
- 48% ▲ 13.00%
- Median HH income
- $61,607
- Composite
- 36.38/100
- National rank
- #4683
- State rank
- #489 of 590 in NY
Livability — Jamesport
- Score
- 46/100
- State rank
- #1185
- US rank
- #26497
Category grades
Schools grade is shown separately in the Schools card above.
Census & demographics
- Census place
- Jamesport, NY
- City population
- 716
- Population (ZIP)
- 248
Population outlook (Suffolk County) Hauer SSP2
- Today (2025)
- 1,505,262 people
- By 2030
- 1,498,318 · -0.5%
- By 2040
- 1,471,101 · -2.3%
- By 2050
- 1,424,848 · -5.3%
- By 2075
- 1,337,157 · -11.2%
- By 2100
- 1,217,720 · -19.1%
Race, ethnicity, and origin ACS 2023
- Neighborhood character
- Predominantly White (100%)
- Race & ethnicity
- White 100%
Political lean MEDSL · Suffolk
- 2024 margin
- Lean R (+10.0) · D 45.0% · R 55.0%
- 2008→2024 swing
- -16.0pp toward R · 2008: 6.0pp · 2024: -10.0pp
- All cycles
- 2024: R+10.0 2020: R+0.0 2016: R+8.2 2012: D+2.9 2008: D+6.0
Not yet ingested
- Civics
- —
Market trends
- HPI YoY
- —
- Current HPI
- —
- Rent YoY
- —
- Metro
- —
- State GDP YoY
- ▲ 2.60%
- F500 in state
- 92
Industry mix (Fortune 500 HQ in NY)
| Industry | F500 HQs | Revenue |
|---|---|---|
| Financial Services | 10 | $950B |
|
||
| Consumer Goods | 9 | $162B |
|
||
| Insurance | 4 | $225B |
|
||
| Telecommunications | 2 | $144B |
|
||
| Pharmaceuticals | 2 | $112B |
|
||
| Media / Entertainment | 2 | $69B |
|
||
Price history
1 event — show timeline
- 2026-06-11 Listed $749,500 OneKey® MLS as Distributed by MLS Grid
Property tax history
+1.3%/yrLatest (2025): $6,074 · +0.0% YoY. Source: county tax records.
Cash-flow waterfall
monthlySold comps — $/sqft
last 12 mo · ≤1 miLoading sold comps…