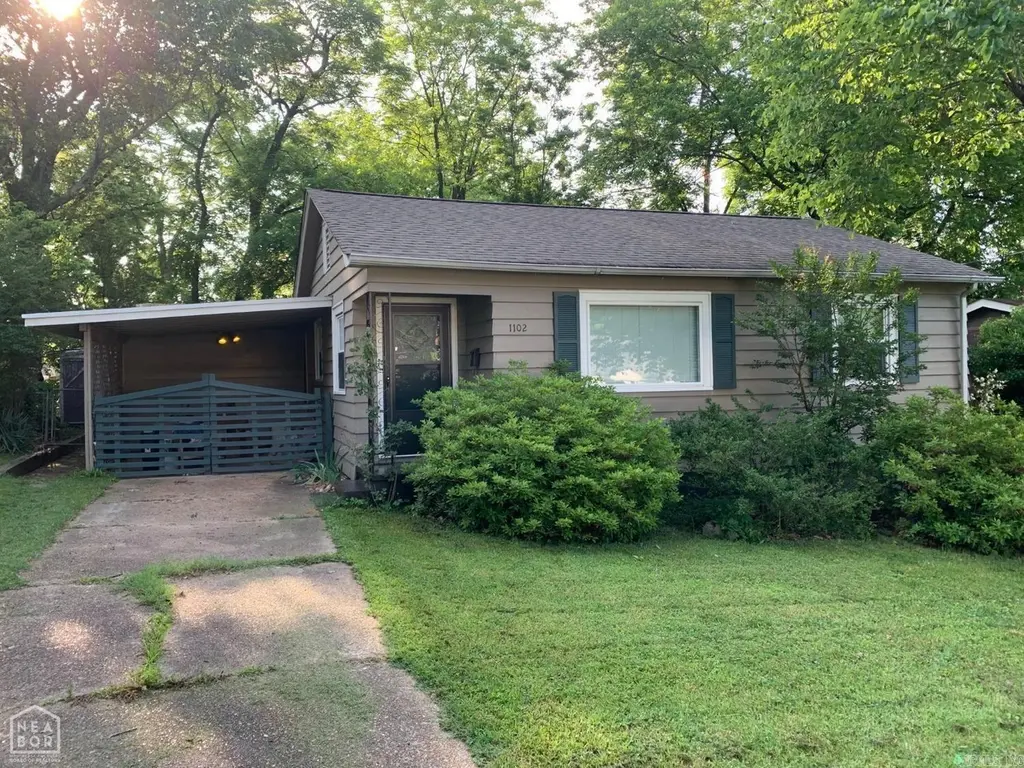
1102 Turner St · Jonesboro, AR
Flood risk 1/10 · Minimal
- FEMA flood zone
- X
- Chance of flooding over 30 yrs
- 0.0%
- Est. flood insurance / yr
- $507 – $1,088
Fire risk 1/10 · Minimal
- Est. fire insurance / yr
- $1,499 – $2,785
Heat risk 5/10 · Moderate
- Hot days now (above 109°F)
- 7 days/yr
- Hot days in 30 yrs
- 20 days/yr
Wind risk 4/10 · Minor
- Chance of severe wind over 30 yrs
- 8.0%
Air-quality risk 1/10 · Minimal
- Unhealthy air days now
- 0 days/yr
- Unhealthy air days in 30 yrs
- 0 days/yr
Risk factors via First Street. Map © Google.
Why this score? — see what drove the C grade
The composite is a weighted blend of 9 inputs, each scored 0–100. Each bar is that input's sub-score; the figure is the points it added to the 100-point composite (weight × sub-score).
- Cash flow +23.5/30.0
- ARV discount +12.1/15.0
- DSCR +7.6/10.0
- 1% rule +5.0/10.0
- Rent growth +3.4/5.0
- Livability +3.2/5.0
- Condition / age +2.5/5.0
- Schools +2.3/10.0
- Appreciation +0.0/10.0
$99,900
🖨 Deal sheet (PDF) 📄 Offer letter ✓ Due diligence
Listing remarks MLS
Move-in ready 2-bedroom and 1 full bath home centrally located and close proximity to St Bernards Hospital. Original hardwood floors and separate laundry room. Backyard is quaint with greenhouse for the avid gardener.
Key facts
- Backyard
- Greenhouse
- Move in ready
Tags
Property features AI
Finance
- Other: Approximate living area reported as 900 (source: other); Approximate lot size not provided
- Financial info: Financing available: Conventional loan, cash, or in-house financing
Exterior
- Parking: Carport for 1 car
- Utilities: Public sewer; Public water; Municipal electric (Entergy); Natural gas
- Home design: Single-family property; Entry level information not provided; Facing direction not provided
- Construction: Wood exterior; 3-tab shingle roof; Crawl space foundation; Built year not provided
- Exterior features: Greenhouse; Paved road access; Level lot; Inside city limits
Interior
- Kitchen: Electric range
- Flooring: Wood flooring; Tile flooring; Concrete flooring
- Bathrooms: 1 full bathroom
- Heating & cooling: Central electric cooling; Central gas heating
- Interior features: Gas water heater; Wood, tile and concrete floors; Central electric cooling; Central gas heating
Neighborhood map
What this means for you Summary
Snapshot
- This is a 2-bed/1.0-bath single-family listed at $100k.
Deal economics
- At list price, monthly cash flow is $186 ($2k/yr) — positive.
- The deal already cash-flows at list — no discount required.
- Meets the 1% rule at list price ($1k rent vs $100k).
- Recommended offer: $97k (3.0% below list) — sets the bar for market timing.
- Cap rate 8.5% vs local median 4.4% in Jonesboro — top-decile yield for the area; either an underpriced asset or a hidden risk that comps aren't pricing in. Stress-test before assuming the spread holds.
Location & tenants
- Location reads 65/100 on livability (#145 in AR) — a middle-class / working-renter tenant base. Strengths: cost of living A+, housing A+, health & safety A+; Watch: crime F, amenities F, commute F.
- Jonesboro School District (urban): math 28% / reading 28% proficiency, ranked #169 of 238 in AR (top 71%) — low school quality limits family demand, transient renter base, plan for 1-2y turnover; 67% free/reduced lunch — lower-income household profile, screen leases tightly.
- Zoned schools: Kindergarten Center (503 students, 100% FRL); Annie Camp Jr. High School (math 22% / reading 34%, grade F, #150 of 201 statewide, top 76%, 784 students, 100% FRL); The Academies At Jonesboro High School (math 16% / reading 27%, grade F, #225 of 292 statewide, top 78%, 1,386 students, 100% FRL) — zoned schools average 100% FRL vs 67% district-wide (33 pts higher); higher-poverty schools than district average — tighter screening recommended.
- Market conditions: Rents rising (+3.6%/yr); 301 active listings in the ZIP; 926 units permitted in Craighead County in 2024 (69 in 5+ unit buildings).
Forward outlook
- Local home prices are declining (-3.0%/yr); year-one equity from $691 of loan paydown is wiped out by about $3k of value loss. Plan a longer hold.
- Craighead County population projected at +38% by 2050 — long-run rental-demand tailwind backs the buy-and-hold thesis.
Negotiation context
- It's been on market 58 days — a 3% lower offer ($97k) is reasonable based on typical stale-listing flexibility.
- 5 sale attempts since 23y ago; this cycle's ask has dropped $10k (9%) from the opening price — seller is motivated, your offer sets the floor, not the list.
Risks & watch-outs
- Climate carrying-cost: extreme-heat days projected 7→20/yr by 2055 (HVAC capex compounding) — expect insurance premiums to compound above CPI over the hold.
Questions for the listing agent
- It's been on market 58 days. Have you received any prior offers? Is the seller open to a 3% concession, seller financing, or rate buy-down credit?
- Built in 1970 — when were the roof, HVAC, electrical panel, plumbing, and water heater last replaced?
- Is there a deadline driving the sale (1031 exchange, divorce, estate, relocation)? That informs how much negotiation room exists.
- Schools are D-rated, which usually means shorter tenancies and higher turnover. Who's the typical renter profile here, and what's been the actual vacancy rate?
- Crime grade is F in this area — have there been break-ins, vandalism, or insurance claims at this property in the last 3 years? What carrier currently insures it and at what premium?
- What's the average days-on-market for RENTAL listings here right now (not sales)? A rising rental-DOM trend means longer vacancies and softer asking-rent achievability than the comps imply.
- What's the recent tenant-quality profile in this submarket — average credit score on applications, eviction rate, late-payment / NSF rate, and stable-employment percentage? A property-management company in the area should have these aggregated.
- How much new for-sale + rental construction is in the pipeline within 1–3 miles? Heavy new supply typically softens prices + rents 12–24 months out; constrained supply supports both.
Investment metrics
- 1% rule
- 1.00% ✓
- Cap rate
- 8.53%
- Cash-on-cash
- 8.00%
- DSCR
- 1.36
- GRM
- 8.3
CMA / ARV
- ARV (on-the-fly)
- $111,300
- Comps found
- 3
Show comp detail 3 sales within ~0.75 mi
| Address | Dist | Beds/Ba | Sqft | Sold | Price | $/sf | Match |
|---|---|---|---|---|---|---|---|
| 509 Altman Ave | 0.06mi | 2/1.0 | 756 (+8%) | 16mo | $120,000 | $159 | 71 |
| 1325 Haven St | 0.62mi | 1/1.0 (-1) | 640 (-9%) | 23mo | $135,000 | $211 | 32 |
| 403 Houghton Rd | 0.65mi | 3/1.0 (+1) | 800 (+14%) | 17mo | $43,500 | $54 | 26 |
Match score weights: distance 35% · size 25% · config 20% · recency 20%. Top-matched comps best support the ARV.
Projected returns pro-forma
-3.0% appreciation · 3.64% rent growth · sell at horizon
- IRR
- -3.5%
- Equity multiple
- 0.87×
- Total profit
- $-3,700
- Equity at exit
- $14,895
- IRR
- 6.8%
- Equity multiple
- 1.52×
- Total profit
- $14,619
- Equity at exit
- $8,638
Cash invested: $27,972 (down + closing). Projections, not guarantees.
Landlord ↔ Tenant lean methodology
- Overall (STATE)
- 92 Strongly Landlord-Friendly
- State Arkansas
- 92 Strongly Landlord-Friendly · R+14
- County
- — inherits STATE
- City
- — inherits STATE
ZIP-level market 72401
- Home prices YoY
- -34.2%
- Rents YoY
- 3.6%
- Active inventory
- 301
- Price-to-rent
- 8.3×
Monthly cashflow live
- Estimated rent
- $1,002 medium interval (Pro) →
- Mortgage (P&I)
- −$524
- Tax from tax record
- −$40 /mo · $476/yr
- Insurance
- −$42
- HOA
- −$0
- Vacancy / Maint / Mgmt
- −$210
- Net cashflow
- $186
Break-even live
Sensitivity live
| Price | -10% $243 | -5% $215 | +0% $186 | +5% $158 | +10% $130 |
|---|---|---|---|---|---|
| Rent | -10% $107 | -5% $147 | +0% $186 | +5% $226 | +10% $266 |
| Rate | -1.0pp $237 | -0.5pp $212 | base $186 | +0.5pp $161 | +1.0pp $134 |
UW: 25.0% down · 7.5% · 30yr · 1.5% tax · 5.0% vac · 8.0% maint · 8.0% mgmt
Financing live
Cash to close
- Down payment
- $24,975
- Closing costs
- $2,997
- Reserves months
- —
- Total cash needed
- —
Loan-product check · same deal, 3 products live
Conventional
25% down · 7.5% · 30yr
- Down + closing
- —
- Monthly P&I
- —
- Monthly cashflow
- —
- DSCR
- —
- Eligible?
- —
Personal DTI + credit; lowest rate.
DSCR
20% down · 8.5% · 30yr
- Down + closing
- —
- Monthly P&I
- —
- Monthly cashflow
- —
- DSCR
- —
- Eligible?
- —
No personal income docs; deal must DSCR.
Hard money
10% down · 12.0% · 12mo
- Down + closing
- —
- Monthly P&I
- —
- Monthly cashflow
- —
- DSCR
- —
- Eligible?
- —
Short-term bridge; refi at stabilization.
Listing history 13 events
-
2026-04-28price $99,900
-
2026-04-27price $99,900 217-char remark
Show marketing remark (217 chars)
Move-in ready 2-bedroom and 1 full bath home centrally located and close proximity to St Bernards Hospital. Original hardwood floors and separate laundry room. Backyard is quaint with greenhouse for the avid gardener.
-
2026-03-27$110,000 New Listing
Show marketing remark (217 chars)
Move-in ready 2-bedroom and 1 full bath home centrally located and close proximity to St Bernards Hospital. Original hardwood floors and separate laundry room. Backyard is quaint with greenhouse for the avid gardener.
-
2026-03-27$110,000 Active 217-char remark
Show marketing remark (217 chars)
Move-in ready 2-bedroom and 1 full bath home centrally located and close proximity to St Bernards Hospital. Original hardwood floors and separate laundry room. Backyard is quaint with greenhouse for the avid gardener.
-
2024-06-10soldstatus $90,000 Sold 180-char remark
Show marketing remark (180 chars)
Move in ready 2 bed 1 bath home, centrally located with in walking distance to area schools. Original hardwood flooring inside. Outside there is a greenhouse for the avid gardener.
-
2024-06-10soldstatus $90,000 Closed
Show marketing remark (180 chars)
Move in ready 2 bed 1 bath home, centrally located with in walking distance to area schools. Original hardwood flooring inside. Outside there is a greenhouse for the avid gardener.
-
2024-05-29historical
-
2024-05-28status Under Contract 180-char remark
Show marketing remark (180 chars)
Move in ready 2 bed 1 bath home, centrally located with in walking distance to area schools. Original hardwood flooring inside. Outside there is a greenhouse for the avid gardener.
-
2024-05-24$89,900 Active
Show marketing remark (180 chars)
Move in ready 2 bed 1 bath home, centrally located with in walking distance to area schools. Original hardwood flooring inside. Outside there is a greenhouse for the avid gardener.
-
2024-05-24$89,900 New Listing 180-char remark
Show marketing remark (180 chars)
Move in ready 2 bed 1 bath home, centrally located with in walking distance to area schools. Original hardwood flooring inside. Outside there is a greenhouse for the avid gardener.
-
2003-09-19soldstatus $44,000
-
2003-05-29soldstatus $26,275
-
2003-04-10$24,000
ⓘ Source: listings_history table (triggers on properties + properties_extension) + one-shot
backfill from property_details.listing_events for pre-trigger history.
Tax reassessment forecast AR · Resets to sale price
- Current annual tax
- $476 · $40/mo
- Projected year-2 tax
- $639 · $53/mo
- Expected delta
- +$163/yr (+$14/mo · 34.2%)
ⓘ Screening estimate from a state-policy table — verify with the county assessor before closing.
Climate risk First Street
- Flood 1/10 Low FEMA zone X · 0% chance over 30 yrs
- Wildfire 1/10 Low
- Heat 5/10 Major 7 d/yr ≥109°F today · 20 d/yr by 30 yrs out
- Wind 4/10 Moderate 8% chance of damaging wind over 30 yrs
- Air quality 1/10 Low 0 unhealthy d/yr today · 0 by 30 yrs out
Nearby sold comps map
Loading sold comps map…
Walkable amenities ~0.75 mi
Loading nearby amenities…
Taxation est. · year 1
- Rental income
- $12,025
- − Mortgage interest
- −$5,596
- − Property taxes
- −$476
- − Insurance
- −$500
- − Repairs & maintenance
- −$962
- − Management
- −$962
- − Depreciation
- −$2,906
- Taxable income
- $623
- Est. tax owed @ 24.0%
- −$150
- After-tax cash flow
- $2,088/yr
For passive investors: Depreciation is non-cash, so a rental often shows a tax loss while cash-flowing — sheltering income. Rental losses are passive: they offset passive income freely, and up to $25,000/yr can offset ordinary (W-2) income if you actively participate and your MAGI is under $100k (phasing out to $0 by $150k); unused losses carry forward. On sale, claimed depreciation is recaptured at up to 25%, and gains may owe capital-gains tax (a 1031 exchange can defer both). Figures are a year-1 estimate at your 24.0% rate — not tax advice; consult a CPA.
Schools (NCES district)
- District
- Jonesboro School District
- NCES district ID
- 0508280
- Math proficiency
- 28% ▼ -9.00%
- Reading proficiency
- 28% ▼ -8.00%
- Median HH income
- $34,347
- Composite
- 23.06/100
- National rank
- #7967
- State rank
- #169 of 238 in AR
Livability — Jonesboro
- Score
- 65/100
- State rank
- #145
- US rank
- #12692
Category grades
Schools grade is shown separately in the Schools card above.
Census & demographics
- Census place
- Jonesboro, AR
- County
- Craighead County · 97,185 people
- City population
- 91,245
- Metro
- Jonesboro, AR
- Population (ZIP)
- 42,602
- Household income
- $45,329
- Rent vs Own
- Severe rent burden
- 2606.0
Population outlook (Craighead County) Hauer SSP2
- Today (2025)
- 122,235 people
- By 2030
- 131,338 · +7.4%
- By 2040
- 149,862 · +22.6%
- By 2050
- 168,034 · +37.5%
- By 2075
- 208,094 · +70.2%
- By 2100
- 233,251 · +90.8%
Race, ethnicity, and origin ACS 2023
- Neighborhood character
- Diverse neighborhood (Simpson 0.56)
- Race & ethnicity
- White 60% Black 26% Hispanic / Latino 9% Two or more races 7%
- Hispanic origin (detail)
- Mexican 8%
- Common ancestry
- Slovak 2% Italian 1% Lithuanian 1%
- Foreign-born
- 4% · Canada
- Languages at home
- 92% English-only · Spanish 7%
Political lean MEDSL · Craighead
- 2024 margin
- Solid R (+37.4) · D 30.1% · R 67.5% · Other 2.4%
- 2008→2024 swing
- -12.9pp toward R · 2008: -24.5pp · 2024: -37.4pp
- All cycles
- 2024: R+37.4 2020: R+35.4 2016: R+35.2 2012: R+31.1 2008: R+24.5
Not yet ingested
- Civics
- —
Market trends
- HPI YoY
- ▼ -108.25%
- Current HPI
- 208.2079
- Rent YoY
- ▲ 3.64%
- Metro
- Jonesboro, AR
- State GDP YoY
- ▲ 3.80%
- F500 in state
- 10
Industry mix (Fortune 500 HQ in AR)
| Industry | F500 HQs | Revenue |
|---|---|---|
| Retail | 1 | $681B |
|
||
| Food / Agriculture | 1 | $53B |
|
||
| Retail / Energy | 1 | $22B |
|
||
| Transportation / Logistics | 1 | $12B |
|
||
| Energy | 1 | $4B |
|
||
Price history
+316.2% since first listed13 events — show timeline
- 2026-04-28 Price Changed $99,900 CARMLS
- 2026-04-27 Price Changed $99,900 NEABOR MLS
- 2026-03-27 Listed $110,000 NEABOR MLS
- 2026-03-27 Listed $110,000 CARMLS
- 2024-06-10 Sold (MLS) $90,000 NEABOR MLS
- 2024-06-10 Sold (MLS) $90,000 CARMLS
- 2024-05-29 Delisted — NEABOR MLS
- 2024-05-28 Pending — CARMLS
- 2024-05-24 Listed $89,900 NEABOR MLS
- 2024-05-24 Listed $89,900 CARMLS
- 2003-09-19 Sold (Public Records) $44,000 Public Records
- 2003-05-29 Sold (MLS) $26,275 Memphis Area Association of Realtors(R) MLS
- 2003-04-10 Listed $24,000 Memphis Area Association of Realtors(R) MLS
Cash-flow waterfall
monthlySold comps — $/sqft
last 12 mo · ≤1 miLoading sold comps…