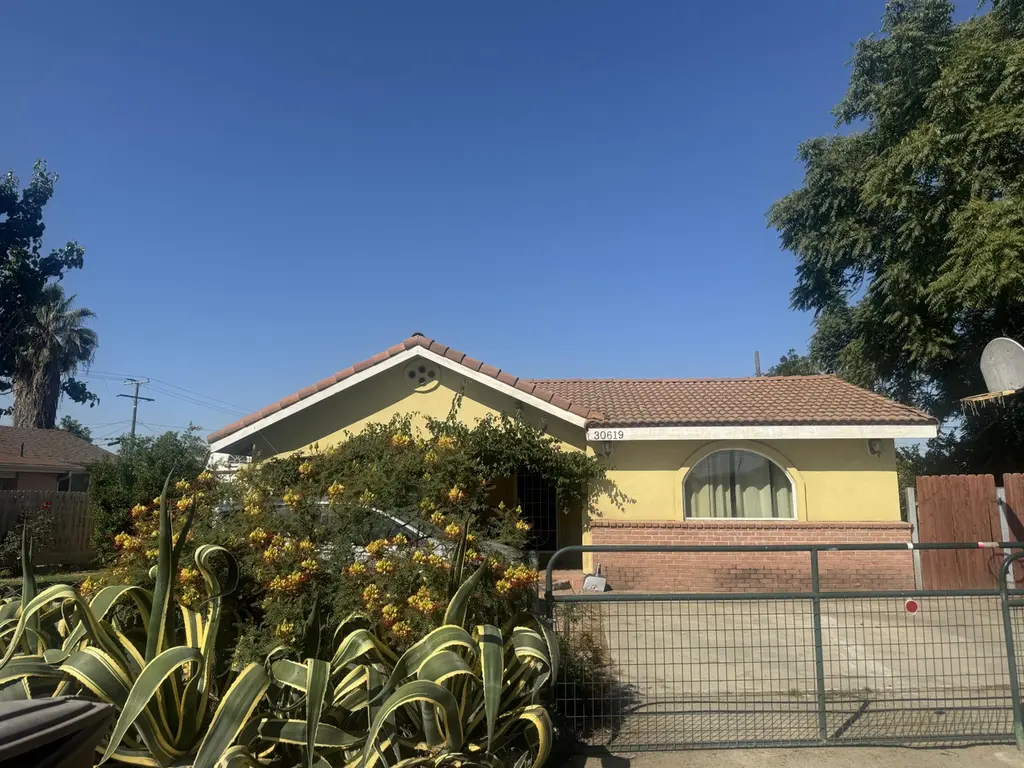
30619 Kame Dr · Goshen, CA
Flood risk 1/10 · Minimal
- FEMA flood zone
- X (shaded)
- Chance of flooding over 30 yrs
- 0.0%
- Est. flood insurance / yr
- $507 – $1,088
Fire risk 4/10 · Minor
- Est. fire insurance / yr
- $659 – $1,223
Heat risk 8/10 · Major
- Hot days now (above 106°F)
- 7 days/yr
- Hot days in 30 yrs
- 17 days/yr
Wind risk 1/10 · Minimal
- Chance of severe wind over 30 yrs
- —
Air-quality risk 10/10 · Severe
- Unhealthy air days now
- 37 days/yr
- Unhealthy air days in 30 yrs
- 39 days/yr
Risk factors via First Street. Map © Google.
Why this score? — see what drove the C grade
The composite is a weighted blend of 9 inputs, each scored 0–100. Each bar is that input's sub-score; the figure is the points it added to the 100-point composite (weight × sub-score).
- Cash flow +17.1/30.0
- ARV discount +15.0/15.0
- Appreciation +5.6/10.0
- DSCR +5.3/10.0
- 1% rule +3.9/10.0
- Schools +3.0/10.0
- Rent growth +2.5/5.0
- Livability +2.5/5.0
- Condition / age +2.5/5.0
$225,000
🖨 Deal sheet 📄 Offer letter ✓ Due diligence
Listing remarks
Investor Special! Unlock the potential in this spacious home situated on a generously sized lot. With plenty of room to renovate, expand, or reimagine, this property is ideal for investors looking to add value and maximize returns. Features include a functional layout, ample outdoor space, and strong upside potential in a growing area. Whether you're planning a fix-and-flip, rental, or long-term hold, this property offers the flexibility to fit your investment strategy. Don't miss this opportunity to bring your vision to life— especially with properties that have this much potential
Key facts
- Ample outdoor space
- Generously sized lot
- Spacious home
Tags
Property features AI
Exterior
- Utilities: Public water; Public sewer; Electricity connected; Water connected; Sewer connected
- Home design: Single family residence; One story
- Construction: Built as a residential single family home
- Exterior features: Tile roof
Interior
- Bathrooms: 2 full bathrooms
- Interior features: Free‑standing fireplace; Central heating and central air
Neighborhood map
What this means for you Summary
Snapshot
- This is a 2-bed/1.0-bath single-family listed at $225k.
Deal economics
- At list price, monthly cash flow is $156 ($2k/yr) — positive.
- The deal already cash-flows at list — no discount required.
- To meet the 1% rule (rent ≥ 1% of price), the offer needs to be $200k (11.1% below list).
- Recommended offer: $200k (11.1% below list) — sets the bar for 1% rule.
- Cap rate 7.1% vs local median 3.7% in Goshen — top-decile yield for the area; either an underpriced asset or a hidden risk that comps aren't pricing in. Stress-test before assuming the spread holds.
Location & tenants
- Location reads 50/100 on livability (#1,113 in CA) — a working-class tenant base; expect higher turnover. Strengths: housing A+; Watch: commute C-, employment C-, schools F.
- Visalia Unified (urban): math 30% / reading 40% proficiency, ranked #273 of 517 in CA (top 53%) — families likely to look elsewhere, expect single-tenant / working-renter base with shorter leases.
- Market conditions: 1 active listings in the ZIP; 1 comparable units currently listed for rent nearby; 1,447 units permitted in Tulare County in 2024 (307 in 5+ unit buildings).
Forward outlook
- In year one you build about $4k of equity ($2k loan paydown + $3k appreciation (1.1% local appreciation)).
- Tulare County population projected at +10% by 2050 — modest demand growth; plan on rents tracking national, not racing it.
- At projected returns (1.1% appreciation + 3.0% rent growth), your $63k cash investment doubles in ~8 years — after that, you're playing with house money.
- By year 8, paydown + projected appreciation supports a ~$32k cash-out refi (75% LTV) — recoverable capital for the next deal without selling this one.
Negotiation context
- Only 3 days on market — expect competitive offers; lowballing is unlikely to land.
Risks & watch-outs
- Climate carrying-cost: extreme-heat days projected 7→17/yr by 2055 (HVAC capex compounding) — expect insurance premiums to compound above CPI over the hold.
Questions for the listing agent
- Built in 1967 — when were the roof, HVAC, electrical panel, plumbing, and water heater last replaced?
- Is there a deadline driving the sale (1031 exchange, divorce, estate, relocation)? That informs how much negotiation room exists.
- Schools are F-rated, which usually means shorter tenancies and higher turnover. Who's the typical renter profile here, and what's been the actual vacancy rate?
- Crime grade is F in this area — have there been break-ins, vandalism, or insurance claims at this property in the last 3 years? What carrier currently insures it and at what premium?
- What's the average days-on-market for RENTAL listings here right now (not sales)? A rising rental-DOM trend means longer vacancies and softer asking-rent achievability than the comps imply.
- What's the recent tenant-quality profile in this submarket — average credit score on applications, eviction rate, late-payment / NSF rate, and stable-employment percentage? A property-management company in the area should have these aggregated.
- How much new for-sale + rental construction is in the pipeline within 1–3 miles? Heavy new supply typically softens prices + rents 12–24 months out; constrained supply supports both.
Investment metrics
- 1% rule
- 0.89% ✗
- Cap rate
- 7.12%
- Cash-on-cash
- 2.96%
- DSCR
- 1.13
- GRM
- 9.4
CMA / ARV
- ARV (median comp)
- $341,919
- List price
- $225,000
- Delta
- -34.19%
- Verdict
- UNDERPRICED
- Comps
- 20 within 1.0 mi
Show comp detail 12 sales within ~0.75 mi
| Address | Dist | Beds/Ba | Sqft | Sold | Price | $/sf | Match |
|---|---|---|---|---|---|---|---|
| 30619 Kame Dr | 0.00mi | 2/2.0 | 1,385 (0%) | 1mo | $221,000 | $160 | 95 |
| 7350 Ave 306 | 0.58mi | 3/2.0 (+1) | 1,416 (+2%) | 3mo | $355,000 | $251 | 58 |
| 30716 Road 64 | 0.61mi | 2/1.0 | 1,246 (-10%) | 2mo | $248,000 | $199 | 53 |
| 7337 Ashworth Ave | 0.58mi | 3/2.0 (+1) | 1,262 (-9%) | 0mo | $327,000 | $259 | 49 |
| 7329 Ensminger Ave | 0.58mi | 3/2.0 (+1) | 1,497 (+8%) | 8mo | $350,000 | $234 | 44 |
| 30639 Kit Fox Ct | 0.57mi | 3/2.0 (+1) | 1,249 (-10%) | 7mo | $325,000 | $260 | 42 |
| 7144 Wren Ave | 0.67mi | 3/2.0 (+1) | 1,546 (+12%) | 1mo | $379,090 | $245 | 40 |
| 7111 W Wren Ave | 0.65mi | 3/2.0 (+1) | 1,546 (+12%) | 4mo | $379,140 | $245 | 38 |
| 31081 Rd 70 | 0.59mi | 3/2.0 (+1) | 1,546 (+12%) | 8mo | $382,940 | $248 | 37 |
| 7039 W Wren Ave | 0.62mi | 3/2.0 (+1) | 1,546 (+12%) | 8mo | $405,340 | $262 | 37 |
| 7038 W Wren Ave | 0.64mi | 3/2.0 (+1) | 1,546 (+12%) | 7mo | $377,990 | $244 | 36 |
| 7020 W Wren Ave | 0.64mi | 3/2.0 (+1) | 1,546 (+12%) | 8mo | $377,140 | $244 | 35 |
Match score weights: distance 35% · size 25% · config 20% · recency 20%. Top-matched comps best support the ARV.
Projected returns pro-forma
1.12% appreciation · 3.0% rent growth · sell at horizon
- IRR
- 4.8%
- Equity multiple
- 1.24×
- Total profit
- $15,393
- Equity at exit
- $78,222
- IRR
- 9.0%
- Equity multiple
- 2.11×
- Total profit
- $69,854
- Equity at exit
- $105,050
Cash invested: $63,000 (down + closing). Projections, not guarantees.
Landlord ↔ Tenant lean methodology
- Overall (STATE)
- 18 Strongly Tenant-Friendly
- State California
- 18 Strongly Tenant-Friendly · D+13
- County
- — inherits STATE
- City
- — inherits STATE
ZIP-level market 93227
- Home prices YoY
- 0.5%
- Active inventory
- 1
- Price-to-rent
- 9.4×
Monthly cashflow live
- Estimated rent
- $2,000 medium interval (Pro) →
- Mortgage (P&I)
- −$1,180
- Tax from tax record
- −$151 /mo · $1,809/yr
- Insurance
- −$94
- HOA
- −$0
- Vacancy / Maint / Mgmt
- −$420
- Net cashflow
- $156
Break-even live
UW: 25.0% down · 7.5% · 30yr · 1.5% tax · 5.0% vac · 8.0% maint · 8.0% mgmt
Financing live
Cash to close
- Down payment
- $56,250
- Closing costs
- $6,750
- Reserves months
- —
- Total cash needed
- —
Loan-product check · same deal, 3 products live
Conventional
25% down · 7.5% · 30yr
- Down + closing
- —
- Monthly P&I
- —
- Monthly cashflow
- —
- DSCR
- —
- Eligible?
- —
Personal DTI + credit; lowest rate.
DSCR
20% down · 8.5% · 30yr
- Down + closing
- —
- Monthly P&I
- —
- Monthly cashflow
- —
- DSCR
- —
- Eligible?
- —
No personal income docs; deal must DSCR.
Hard money
10% down · 12.0% · 12mo
- Down + closing
- —
- Monthly P&I
- —
- Monthly cashflow
- —
- DSCR
- —
- Eligible?
- —
Short-term bridge; refi at stabilization.
Rent comps 1 comps
| Address | Beds | Baths | Sqft | Rent | $/sqft | DOM | Units | Dist |
|---|---|---|---|---|---|---|---|---|
| 30743 Cottontail St Visalia, CA | 3.0 | 2.0 | 1167 | $2,000 | $1.71 | 13d | 1 | 0.54mi |
Listing history 3 events
-
2026-05-04status Pending 595-char remark
-
2026-04-30$225,000 Active 595-char remark
-
1980-02-01soldstatus $9,500
ⓘ Source: listings_history table (triggers on properties + properties_extension) + one-shot
backfill from property_details.listing_events for pre-trigger history.
Tax reassessment forecast CA · Resets to sale price
- Current annual tax
- $1,809 · $151/mo
- Projected year-2 tax
- $1,809 · $151/mo
- Expected delta
- $0/yr ($0/mo · 0.0%)
ⓘ Screening estimate from a state-policy table — verify with the county assessor before closing.
Climate risk First Street
- Flood 1/10 Low FEMA zone X (shaded) · 0% chance over 30 yrs
- Wildfire 4/10 Moderate
- Heat 8/10 Severe 7 d/yr ≥106°F today · 17 d/yr by 30 yrs out
- Wind 1/10 Low
- Air quality 10/10 Extreme 37 unhealthy d/yr today · 39 by 30 yrs out
Nearby sold comps map
Loading sold comps map…
Walkable amenities ~0.75 mi
Loading nearby amenities…
Taxation est. · year 1
- Rental income
- $24,000
- − Mortgage interest
- −$12,603
- − Property taxes
- −$1,809
- − Insurance
- −$1,125
- − Repairs & maintenance
- −$1,920
- − Management
- −$1,920
- − Depreciation
- −$6,545
- Taxable loss
- −$1,923
- Est. tax savings @ 24.0%
- +$461
- After-tax cash flow
- $2,329/yr
For passive investors: Depreciation is non-cash, so a rental often shows a tax loss while cash-flowing — sheltering income. Rental losses are passive: they offset passive income freely, and up to $25,000/yr can offset ordinary (W-2) income if you actively participate and your MAGI is under $100k (phasing out to $0 by $150k); unused losses carry forward. On sale, claimed depreciation is recaptured at up to 25%, and gains may owe capital-gains tax (a 1031 exchange can defer both). Figures are a year-1 estimate at your 24.0% rate — not tax advice; consult a CPA.
Schools (NCES district)
- District
- Visalia Unified
- NCES district ID
- 0641160
- Math proficiency
- 30% ▼ -3.00%
- Reading proficiency
- 40% ▼ -10.00%
- Median HH income
- $51,672
- Composite
- 30.47/100
- National rank
- #6223
- State rank
- #273 of 517 in CA
Livability — Goshen
- Score
- 50/100
- State rank
- #1113
- US rank
- #25601
Category grades
Schools grade is shown separately in the Schools card above.
Census & demographics
- Census place
- Goshen, CA
- City population
- 177
- Population (ZIP)
- 177
Population outlook (Tulare County) Hauer SSP2
- Today (2025)
- 484,681 people
- By 2030
- 496,241 · +2.4%
- By 2040
- 518,507 · +7.0%
- By 2050
- 534,920 · +10.4%
- By 2075
- 548,417 · +13.2%
- By 2100
- 513,085 · +5.9%
Race, ethnicity, and origin ACS 2023
- Neighborhood character
- Predominantly Hispanic (100%)
- Race & ethnicity
- Hispanic / Latino 100% Two or more races 100%
- Hispanic origin (detail)
- Mexican 42%
- Foreign-born
- 33% · Canada
- Languages at home
- 58% English-only · Spanish 42%
Political lean MEDSL · Tulare
- 2024 margin
- Strong R (+20.7) · D 38.5% · R 59.2% · Other 2.3%
- 2008→2024 swing
- -5.4pp toward R · 2008: -15.3pp · 2024: -20.7pp
- All cycles
- 2024: R+20.7 2020: R+7.8 2016: R+12.1 2012: R+17.8 2008: R+15.3
Not yet ingested
- Civics
- —
Market trends
- HPI YoY
- ▲ 1.12%
- Current HPI
- 247.1388
- Rent YoY
- —
- Metro
- —
- State GDP YoY
- ▲ 3.21%
- F500 in state
- 116
Industry mix (Fortune 500 HQ in CA)
| Industry | F500 HQs | Revenue |
|---|---|---|
| Technology | 27 | $1,492B |
|
||
| Financial Services | 3 | $174B |
|
||
| Retail | 3 | $44B |
|
||
| Insurance | 3 | $26B |
|
||
| Media / Entertainment | 2 | $115B |
|
||
| Pharmaceuticals / Biotech | 2 | $62B |
|
||
Price history
+2226.3% since first listed5 events — show timeline
- 2026-05-29 Sold (Public Records) $221,000 Public Records
- 2026-05-29 Sold (MLS) $221,000 TCMLS
- 2026-05-04 Pending — TCMLS
- 2026-04-30 Listed $225,000 TCMLS
- 1980-02-01 Sold (Public Records) $9,500 Public Records
Property tax history
+12.2%/yrLatest (2025): $1,809 · +180.2% YoY. Source: county tax records.
Cash-flow waterfall
monthlySold comps — $/sqft
last 12 mo · ≤1 miLoading sold comps…