2661 Lampasas Dr · Midland, TX
Flood risk 1/10 · Minimal
- FEMA flood zone
- —
- Chance of flooding over 30 yrs
- 0.0%
- Est. flood insurance / yr
- —
Fire risk 8/10 · Major
- Est. fire insurance / yr
- $1,222 – $2,270
Heat risk 6/10 · Moderate
- Hot days now (above 102°F)
- 7 days/yr
- Hot days in 30 yrs
- 22 days/yr
Wind risk 3/10 · Minor
- Chance of severe wind over 30 yrs
- 5.0%
Air-quality risk 1/10 · Minimal
- Unhealthy air days now
- 0 days/yr
- Unhealthy air days in 30 yrs
- 0 days/yr
Risk factors via First Street. Map © Google.
Why this score? — see what drove the C- grade
The composite is a weighted blend of 9 inputs, each scored 0–100. Each bar is that input's sub-score; the figure is the points it added to the 100-point composite (weight × sub-score).
- Cash flow +19.1/30.0
- ARV discount +7.5/15.0
- DSCR +6.0/10.0
- Condition / age +4.8/5.0
- 1% rule +4.1/10.0
- Livability +4.0/5.0
- Schools +3.4/10.0
- Rent growth +3.1/5.0
- Appreciation +0.0/10.0
$225,000
🖨 Deal sheet (PDF) 📄 Offer letter ✓ Due diligence
Listing remarks MLS
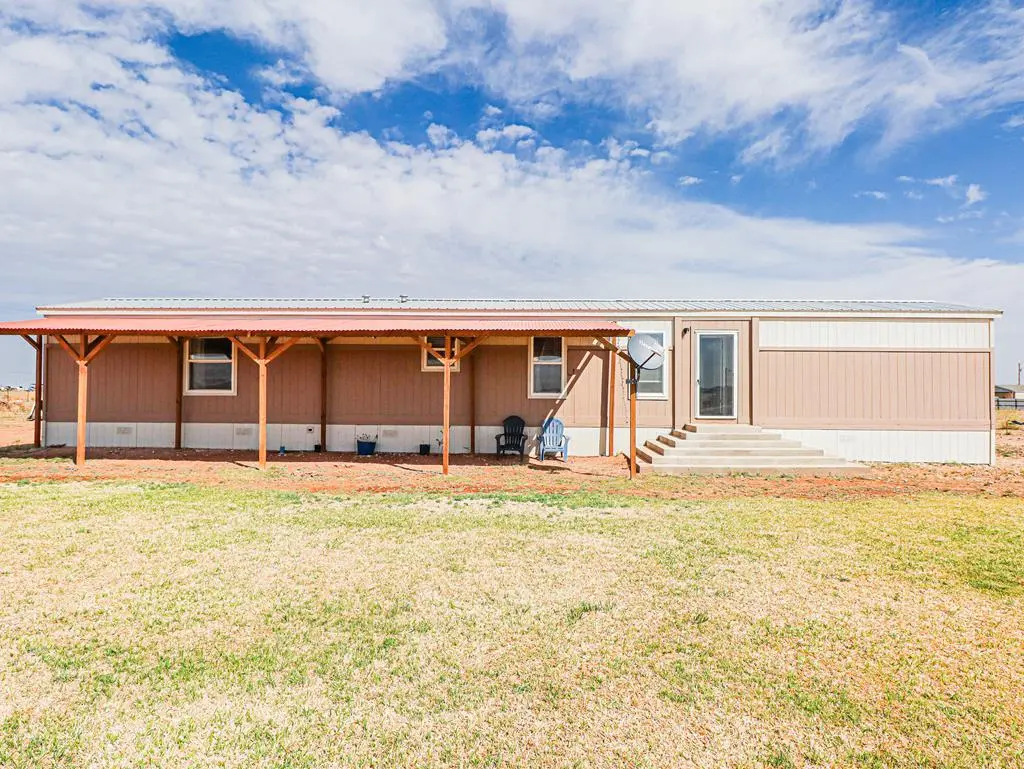
Beautiful country property 3 bedrooms, 2 bathrooms, with an 810 sq ft shop. Situated on 1.03 acres, this property offers ample space for trucks, equipment, and animals, while providing the privacy and tranquility of country living with convenient access to the city. Built in 2023, Modern open-concept layout with spacious living areas and is in excellent, move-in ready condition. The versatile shop adds valuable functionality, ideal for storage, hobbies, or work use. Schedule a showing today!
Key facts
- 810 sq ft shop
- Versatile shop
- 1.03 acres
Tags
Neighborhood map
What this means for you Summary
Snapshot
- This is a 3-bed/2.0-bath manufactured listed at $225k. Condition is rated excellent.
Deal economics
- At list price, monthly cash flow is $240 ($3k/yr) — positive.
- The deal already cash-flows at list — no discount required.
- To meet the 1% rule (rent ≥ 1% of price), the offer needs to be $206k (8.6% below list).
- Recommended offer: $206k (8.6% below list) — sets the bar for 1% rule.
- Cap rate 7.6% vs local median 4.7% in Midland — top-decile yield for the area; either an underpriced asset or a hidden risk that comps aren't pricing in. Stress-test before assuming the spread holds.
Location & tenants
- Location reads 79/100 on livability (#57 in TX, #2,192 nationally) — a middle-class / working-renter tenant base. Strengths: employment A+, housing A+, health & safety A+; Watch: crime C-, commute D+, amenities D.
- Stanton ISD (rural): math 40% / reading 39% proficiency, ranked #426 of 826 in TX (top 52%) — families likely to look elsewhere, expect single-tenant / working-renter base with shorter leases.
- Zoned schools: Stanton El (math 43% / reading 37%, grade F, #1,514 of 4,322 statewide, top 36%, 518 students, 59% FRL); Stanton Middle (math 37% / reading 38%, grade F, #736 of 1,662 statewide, top 45%, 256 students, 54% FRL); Stanton H S (math 44% / reading 47%, grade D-, #630 of 1,632 statewide, top 39%, 307 students, 39% FRL).
- Market conditions: Rents rising (+2.6%/yr); 452 active listings in the ZIP; solid renter incomes; 5 units permitted in Martin County in 2024 (0 in 5+ unit buildings).
Forward outlook
- Local home prices are declining (-3.0%/yr); year-one equity from $2k of loan paydown is wiped out by about $7k of value loss. Plan a longer hold.
- Martin County population projected at +74% by 2050 — long-run rental-demand tailwind backs the buy-and-hold thesis.
Negotiation context
- It's been on market 87 days — a 6% lower offer ($212k) is reasonable based on typical stale-listing flexibility.
- 2 sale attempts with the ask held roughly flat each time — persistent listings suggest the price (not the market) is what's stuck; bring a comps-based counter.
Risks & watch-outs
- Climate carrying-cost: severe wildfire risk; extreme-heat days projected 7→22/yr by 2055 (HVAC capex compounding) — expect insurance premiums to compound above CPI over the hold.
Questions for the listing agent
- It's been on market 87 days. Have you received any prior offers? Is the seller open to a 9% concession, seller financing, or rate buy-down credit?
- What does the HOA fee cover, when was the last increase, and are there any pending special assessments or reserve-fund shortfalls?
- Why hasn't it sold? Are there any deal-killer items the seller is aware of (foundation, flood, title, zoning, code violations)?
- Is there a deadline driving the sale (1031 exchange, divorce, estate, relocation)? That informs how much negotiation room exists.
- What's the average days-on-market for RENTAL listings here right now (not sales)? A rising rental-DOM trend means longer vacancies and softer asking-rent achievability than the comps imply.
- What's the recent tenant-quality profile in this submarket — average credit score on applications, eviction rate, late-payment / NSF rate, and stable-employment percentage? A property-management company in the area should have these aggregated.
- How much new for-sale + rental construction is in the pipeline within 1–3 miles? Heavy new supply typically softens prices + rents 12–24 months out; constrained supply supports both.
Investment metrics
- 1% rule
- 0.91% ✗
- Cap rate
- 7.57%
- Cash-on-cash
- 4.57%
- DSCR
- 1.20
- GRM
- 9.1
CMA / ARV
No comps found within radius.
Projected returns pro-forma
-3.0% appreciation · 2.56% rent growth · sell at horizon
- IRR
- -9.7%
- Equity multiple
- 0.65×
- Total profit
- $-22,164
- Equity at exit
- $33,548
- IRR
- -0.8%
- Equity multiple
- 0.94×
- Total profit
- $-3,616
- Equity at exit
- $19,454
Cash invested: $63,000 (down + closing). Projections, not guarantees.
Landlord ↔ Tenant lean methodology
- Overall (STATE)
- 87 Strongly Landlord-Friendly
- State Texas
- 87 Strongly Landlord-Friendly · R+5
- County
- — inherits STATE
- City
- — inherits STATE
ZIP-level market 79705
- Rents YoY
- 2.6%
- Active inventory
- 452
- Price-to-rent
- 9.1×
Monthly cashflow live
- Estimated rent
- $2,056 medium interval (Pro) →
- Mortgage (P&I)
- −$1,180
- Tax from tax record
- −$61 /mo · $733/yr
- Insurance
- −$94
- HOA
- −$50
- Vacancy / Maint / Mgmt
- −$432
- Net cashflow
- $240
Break-even live
Sensitivity live
| Price | -10% $367 | -5% $304 | +0% $240 | +5% $176 | +10% $112 |
|---|---|---|---|---|---|
| Rent | -10% $77 | -5% $159 | +0% $240 | +5% $321 | +10% $402 |
| Rate | -1.0pp $353 | -0.5pp $297 | base $240 | +0.5pp $182 | +1.0pp $122 |
UW: 25.0% down · 7.5% · 30yr · 1.5% tax · 5.0% vac · 8.0% maint · 8.0% mgmt
Financing live
Cash to close
- Down payment
- $56,250
- Closing costs
- $6,750
- Reserves months
- —
- Total cash needed
- —
Loan-product check · same deal, 3 products live
Conventional
25% down · 7.5% · 30yr
- Down + closing
- —
- Monthly P&I
- —
- Monthly cashflow
- —
- DSCR
- —
- Eligible?
- —
Personal DTI + credit; lowest rate.
DSCR
20% down · 8.5% · 30yr
- Down + closing
- —
- Monthly P&I
- —
- Monthly cashflow
- —
- DSCR
- —
- Eligible?
- —
No personal income docs; deal must DSCR.
Hard money
10% down · 12.0% · 12mo
- Down + closing
- —
- Monthly P&I
- —
- Monthly cashflow
- —
- DSCR
- —
- Eligible?
- —
Short-term bridge; refi at stabilization.
HOA detail
- Monthly dues
- $50 · $600/yr
Listing history 18 events
-
2026-06-21days on market $225,000 Active 87 DOM
-
2026-06-19days on market $225,000 Active 85 DOM
-
2026-06-18days on market $225,000 Active 84 DOM
-
2026-06-17days on market $225,000 Active 83 DOM
-
2026-06-16days on market $225,000 Active 82 DOM
-
2026-06-15days on market $225,000 Active 81 DOM
-
2026-06-14days on market $225,000 Active 79 DOM
-
2026-06-13days on market $225,000 Active 78 DOM
-
2026-06-10days on market $225,000 Active 76 DOM
-
2026-06-09days on market $225,000 Active 75 DOM
-
2026-06-08days on market $225,000 Active 74 DOM
-
2026-06-07days on market $225,000 Active 73 DOM
-
2026-06-02days on market $225,000 Active 68 DOM
-
2026-06-01days on market $225,000 Active 67 DOM
-
2026-05-31days on market $225,000 Active 66 DOM
-
2026-05-30days on market $225,000 Active 65 DOM
-
2026-03-27$225,000 Active 496-char remark
Show marketing remark (496 chars)
Beautiful country property 3 bedrooms, 2 bathrooms, with an 810 sq ft shop. Situated on 1.03 acres, this property offers ample space for trucks, equipment, and animals, while providing the privacy and tranquility of country living with convenient access to the city. Built in 2023, Modern open-concept layout with spacious living areas and is in excellent, move-in ready condition. The versatile shop adds valuable functionality, ideal for storage, hobbies, or work use. Schedule a showing today!
-
2026-03-26$225,000 Active 496-char remark
Show marketing remark (496 chars)
Beautiful country property 3 bedrooms, 2 bathrooms, with an 810 sq ft shop. Situated on 1.03 acres, this property offers ample space for trucks, equipment, and animals, while providing the privacy and tranquility of country living with convenient access to the city. Built in 2023, Modern open-concept layout with spacious living areas and is in excellent, move-in ready condition. The versatile shop adds valuable functionality, ideal for storage, hobbies, or work use. Schedule a showing today!
ⓘ Source: listings_history table (triggers on properties + properties_extension) + one-shot
backfill from property_details.listing_events for pre-trigger history.
Tax reassessment forecast TX · Resets to sale price
- Current annual tax
- $733 · $61/mo
- Projected year-2 tax
- $4,118 · $343/mo
- Expected delta
- +$3,385/yr (+$282/mo · 462.0%)
ⓘ Screening estimate from a state-policy table — verify with the county assessor before closing.
Climate risk First Street
- Flood 1/10 Low 0% chance over 30 yrs
- Wildfire 8/10 Severe
- Heat 6/10 Major 7 d/yr ≥102°F today · 22 d/yr by 30 yrs out
- Wind 3/10 Moderate 5% chance of damaging wind over 30 yrs
- Air quality 1/10 Low 0 unhealthy d/yr today · 0 by 30 yrs out
Nearby sold comps map
Loading sold comps map…
Walkable amenities ~0.75 mi
Loading nearby amenities…
Taxation est. · year 1
- Rental income
- $24,677
- − Mortgage interest
- −$12,603
- − Property taxes
- −$733
- − Insurance
- −$1,125
- − Repairs & maintenance
- −$1,974
- − Management
- −$1,974
- − HOA
- −$600
- − Depreciation
- −$6,545
- Taxable loss
- −$878
- Est. tax savings @ 24.0%
- +$211
- After-tax cash flow
- $3,089/yr
For passive investors: Depreciation is non-cash, so a rental often shows a tax loss while cash-flowing — sheltering income. Rental losses are passive: they offset passive income freely, and up to $25,000/yr can offset ordinary (W-2) income if you actively participate and your MAGI is under $100k (phasing out to $0 by $150k); unused losses carry forward. On sale, claimed depreciation is recaptured at up to 25%, and gains may owe capital-gains tax (a 1031 exchange can defer both). Figures are a year-1 estimate at your 24.0% rate — not tax advice; consult a CPA.
Condition & rehab AI · 6 photos
This modern, move-in ready manufactured home is in excellent condition with a spacious layout and ample outdoor space. It offers a great opportunity for a buyer or renter seeking a comfortable and functional living space in a peaceful setting.
Value-add opportunities
- Both Landscaping and curb appeal improvements — Enhances the home's curb appeal and can attract more buyers or renters.
- Both Add a small garden or flower bed near the front porch — Improves the home's aesthetic and can increase its value.
- Both Install a security system — Enhances safety and can attract more buyers or renters.
- Both Paint the exterior walls — Fresh paint can make the home look more appealing and can increase its value.
- Both Install a smart thermostat — Can save on energy costs and attract more buyers or renters who value energy efficiency.
Renovation cost estimate screening
Value-add ROI direction
- Both Landscaping and curb appeal improvements — Enhances the home's curb appeal and can attract more buyers or renters. ↑
- Both Add a small garden or flower bed near the front porch — Improves the home's aesthetic and can increase its value. ↑
- Both Install a security system — Enhances safety and can attract more buyers or renters. ↑
- Both Paint the exterior walls — Fresh paint can make the home look more appealing and can increase its value. ↑
- Both Install a smart thermostat — Can save on energy costs and attract more buyers or renters who value energy efficiency. ↑
ⓘ Cost ranges are severity-bucket heuristics (US national rule-of-thumb). Get contractor quotes + a written scope before underwriting a rehab budget.
Schools (NCES district)
- District
- Stanton ISD
- NCES district ID
- 4841430
- Math proficiency
- 40% ▼ -1.00%
- Reading proficiency
- 39% ▲ 5.00%
- Median HH income
- $47,595
- Composite
- 33.86/100
- National rank
- #5353
- State rank
- #426 of 826 in TX
Livability — Midland
- Score
- 79/100
- State rank
- #57
- US rank
- #2192
Category grades
Schools grade is shown separately in the Schools card above.
Census & demographics
- County
- Midland County · 168,494 people
- City population
- 168,494
- Metro
- Midland, TX
- Population (ZIP)
- 46,653
- Household income
- $105,310
- Rent vs Own
- Severe rent burden
- 1557.0
Population outlook (Martin County) Hauer SSP2
- Today (2025)
- 7,556 people
- By 2030
- 8,556 · +13.2%
- By 2040
- 10,786 · +42.7%
- By 2050
- 13,158 · +74.1%
- By 2075
- 19,334 · +155.9%
- By 2100
- 23,704 · +213.7%
Race, ethnicity, and origin ACS 2023
- Neighborhood character
- Diverse neighborhood (Simpson 0.60)
- Race & ethnicity
- White 46% Hispanic / Latino 43% Two or more races 20% Black 8%
- Hispanic origin (detail)
- Mexican 35%
- Common ancestry
- Slovak 1% Lithuanian 1% Serbian 1%
- Foreign-born
- 10% · Canada, Jamaica
- Languages at home
- 72% English-only · Spanish 24% Arabic 1%
Political lean MEDSL · Martin
- 2024 margin
- Solid R (+75.8) · D 11.9% · R 87.6%
- 2008→2024 swing
- -13.1pp toward R · 2008: -62.7pp · 2024: -75.8pp
- All cycles
- 2024: R+75.8 2020: R+72.6 2016: R+67.6 2012: R+68.5 2008: R+62.7
Not yet ingested
- Civics
- —
Market trends
- HPI YoY
- ▼ -300.44%
- Current HPI
- 207.2904
- Rent YoY
- ▲ 2.56%
- Metro
- Midland, TX
- State GDP YoY
- ▲ 3.95%
- F500 in state
- 110
Industry mix (Fortune 500 HQ in TX)
| Industry | F500 HQs | Revenue |
|---|---|---|
| Energy | 16 | $1,198B |
|
||
| Technology | 5 | $198B |
|
||
| Engineering / Construction | 4 | $72B |
|
||
| Energy Services | 3 | $60B |
|
||
| Utilities | 3 | $41B |
|
||
| Healthcare | 2 | $330B |
|
||
Price history
+0.0% since first listed2 events — show timeline
- 2026-03-27 Listed $225,000 PBBOR
- 2026-03-26 Listed $225,000 ODMLS
Property tax history
+7.3%/yrLatest (2025): $733 · +7.3% YoY. Source: county tax records.
Cash-flow waterfall
monthlySold comps — $/sqft
last 12 mo · ≤1 miLoading sold comps…