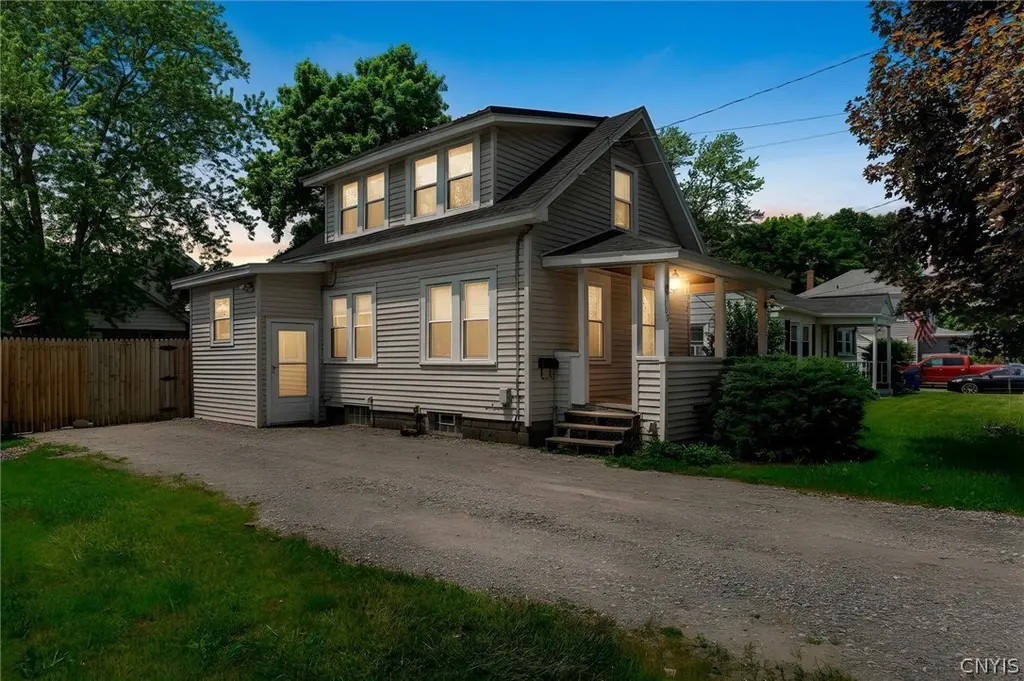
109 Germania Ave · Fairmount, NY
Flood risk 1/10 · Minimal
- FEMA flood zone
- X (unshaded)
- Chance of flooding over 30 yrs
- 0.0%
- Est. flood insurance / yr
- $473 – $860
Fire risk 1/10 · Minimal
- Est. fire insurance / yr
- $691 – $1,283
Heat risk 3/10 · Minor
- Hot days now (above 94°F)
- 7 days/yr
- Hot days in 30 yrs
- 17 days/yr
Wind risk 1/10 · Minimal
- Chance of severe wind over 30 yrs
- 1.0%
Air-quality risk 2/10 · Minimal
- Unhealthy air days now
- 0 days/yr
- Unhealthy air days in 30 yrs
- 1 days/yr
Risk factors via First Street. Map © Google.
Why this score? — see what drove the B- grade
The composite is a weighted blend of 9 inputs, each scored 0–100. Each bar is that input's sub-score; the figure is the points it added to the 100-point composite (weight × sub-score).
- Cash flow +22.8/30.0
- ARV discount +15.0/15.0
- DSCR +7.3/10.0
- 1% rule +6.8/10.0
- Schools +5.1/10.0
- Livability +3.6/5.0
- Rent growth +2.5/5.0
- Condition / age +2.5/5.0
- Appreciation +0.0/10.0
$169,900
🖨 Deal sheet 📄 Offer letter ✓ Due diligence
Listing remarks
Welcome to 109 Germania Ave — a fantastic opportunity in the heart of Camillus! This charming house offers peace of mind with a brand-new roof. Step outside and fall in love with the oversized, fully fenced backyard — perfect for entertaining, letting the kids and pets roam freely, or simply enjoying your own private outdoor retreat. Ready for its next chapter, this house is the perfect canvas to make your own — move right in and update at your own pace, adding your personal touch along the way. Nestled in a desirable Camillus location, this property combines comfort, functionality, and value. Don't miss your chance to make it yours — schedule your private showing to
Key facts
- Brand new roof
- 7,500 sq ft lot
- Built 1930
Tags
Property features AI
Exterior
- Parking: No garage
- Utilities: Public water connected; Sewer connected
- Home design: 2-story existing home
- Construction: Vinyl siding; Stone foundation; Shingle roof
- Exterior features: Gravel driveway; Shed(s) and storage
Interior
- Kitchen: Gas range; Gas oven; Refrigerator
- Bedrooms: 1 bedroom on the main level
- Flooring: Hardwood; Varies
- Bathrooms: 1 full bathroom (on the main level)
- Heating & cooling: Gas forced-air heating; Has heating
- Interior features: Bedroom on main level; See remarks
- Laundry & utility: Washer; Dryer; Gas water heater
Neighborhood map
What this means for you Summary
Snapshot
- This is a 3-bed/1.0-bath single-family listed at $170k.
Deal economics
- At list price, monthly cash flow is $296 ($4k/yr) — positive.
- The deal already cash-flows at list — no discount required.
- Meets the 1% rule at list price ($2k rent vs $170k).
- Cap rate 8.4% vs local median 4.1% in Fairmount — top-decile yield for the area; either an underpriced asset or a hidden risk that comps aren't pricing in. Stress-test before assuming the spread holds.
Location & tenants
- Location reads 72/100 on livability (#366 in NY) — a middle-class / working-renter tenant base. Strengths: housing A+, health & safety A+, employment A-; Watch: schools C-, crime D, amenities F.
- West Genesee Central School District (suburban): math 56% / reading 61% proficiency, ranked #241 of 590 in NY (top 41%) — acceptable for families but not a draw, mixed tenant base, ~2y average lease; only 15% free/reduced lunch — higher-income household profile.
- Market conditions: 52 active listings in the ZIP; 3 comparable units currently listed for rent nearby; rentals leasing fast (median 14d on market — plan ~1-2 weeks tenant-placement turnaround); solid renter incomes; 616 units permitted in Onondaga County in 2024 (256 in 5+ unit buildings).
Forward outlook
- Local home prices are declining (-3.0%/yr); year-one equity from $1k of loan paydown is wiped out by about $5k of value loss. Plan a longer hold.
- Onondaga County population projected to shrink 9% by 2050 — rents likely to lag national; underwrite the cash flow, not the appreciation.
Negotiation context
- Only 7 days on market — expect competitive offers; lowballing is unlikely to land.
- Current owner paid $40k; list at $170k implies a 330% gain — meaningful room to come down on a strong offer.
Risks & watch-outs
- Watch-outs: built in 1930 — expect roof / HVAC / electrical / plumbing capex.
Questions for the listing agent
- Built in 1930 — when were the roof, HVAC, electrical panel, plumbing, and water heater last replaced?
- Is there a deadline driving the sale (1031 exchange, divorce, estate, relocation)? That informs how much negotiation room exists.
- Crime grade is D in this area — have there been break-ins, vandalism, or insurance claims at this property in the last 3 years? What carrier currently insures it and at what premium?
- What's the average days-on-market for RENTAL listings here right now (not sales)? A rising rental-DOM trend means longer vacancies and softer asking-rent achievability than the comps imply.
- What's the recent tenant-quality profile in this submarket — average credit score on applications, eviction rate, late-payment / NSF rate, and stable-employment percentage? A property-management company in the area should have these aggregated.
- How much new for-sale + rental construction is in the pipeline within 1–3 miles? Heavy new supply typically softens prices + rents 12–24 months out; constrained supply supports both.
Investment metrics
- 1% rule
- 1.18% ✓
- Cap rate
- 8.38%
- Cash-on-cash
- 7.46%
- DSCR
- 1.33
- GRM
- 7.1
CMA / ARV
- ARV (on-the-fly)
- $246,636
- Comps found
- 12
Show comp detail 12 sales within ~0.75 mi
| Address | Dist | Beds/Ba | Sqft | Sold | Price | $/sf | Match |
|---|---|---|---|---|---|---|---|
| 216 Turner Ave | 0.22mi | 2/1.0 (-1) | 1,094 (-2%) | 6mo | $175,000 | $160 | 76 |
| 121 Gillespie Ave | 0.11mi | 3/1.5 | 1,008 (-10%) | 5mo | $200,000 | $198 | 73 |
| 301 Hillbrook Rd | 0.24mi | 3/1.0 | 1,008 (-10%) | 3mo | $210,000 | $208 | 70 |
| 212 Turner Ave | 0.20mi | 2/1.0 (-1) | 1,052 (-6%) | 8mo | $195,000 | $185 | 70 |
| 1101 Sidney St | 0.26mi | 3/1.0 | 1,008 (-10%) | 3mo | $185,000 | $184 | 69 |
| 105 Skyview Ter | 0.44mi | 3/1.0 | 1,080 (-3%) | 6mo | $240,000 | $222 | 69 |
| 37 Sherry Dr | 0.49mi | 3/2.0 | 1,123 (+1%) | 6mo | $290,000 | $258 | 67 |
| 219 Inwood Dr | 0.34mi | 3/2.0 | 1,212 (+9%) | 6mo | $250,000 | $206 | 61 |
| 225 Male Ave | 0.24mi | 3/2.0 | 998 (-11%) | 8mo | $220,213 | $221 | 60 |
| 108 Matterson Ave | 0.51mi | 3/1.5 | 1,203 (+8%) | 7mo | $272,000 | $226 | 55 |
| 504 Beverly Dr | 0.58mi | 4/2.0 (+1) | 1,152 (+3%) | 6mo | $267,500 | $232 | 54 |
| 200 E Arbordale Rd | 0.72mi | 2/1.5 (-1) | 1,232 (+10%) | 3mo | $301,000 | $244 | 40 |
Match score weights: distance 35% · size 25% · config 20% · recency 20%. Top-matched comps best support the ARV.
Projected returns pro-forma
-3.0% appreciation · 3.0% rent growth · sell at horizon
- IRR
- -4.8%
- Equity multiple
- 0.82×
- Total profit
- $-8,590
- Equity at exit
- $25,333
- IRR
- 4.9%
- Equity multiple
- 1.36×
- Total profit
- $17,191
- Equity at exit
- $14,690
Cash invested: $47,572 (down + closing). Projections, not guarantees.
Landlord ↔ Tenant lean methodology
- Overall (STATE)
- 15 Strongly Tenant-Friendly
- State New York
- 15 Strongly Tenant-Friendly · D+10
- County
- — inherits STATE
- City
- — inherits STATE
ZIP-level market 13219
- Home prices YoY
- -20.6%
- Active inventory
- 52
- Price-to-rent
- 7.1×
Monthly cashflow live
- Estimated rent
- $2,008 medium interval (Pro) →
- Mortgage (P&I)
- −$891
- Tax from tax record
- −$329 /mo · $3,944/yr
- Insurance
- −$71
- HOA
- −$0
- Vacancy / Maint / Mgmt
- −$422
- Net cashflow
- $296
Break-even live
UW: 25.0% down · 7.5% · 30yr · 1.5% tax · 5.0% vac · 8.0% maint · 8.0% mgmt
Financing live
Cash to close
- Down payment
- $42,475
- Closing costs
- $5,097
- Reserves months
- —
- Total cash needed
- —
Loan-product check · same deal, 3 products live
Conventional
25% down · 7.5% · 30yr
- Down + closing
- —
- Monthly P&I
- —
- Monthly cashflow
- —
- DSCR
- —
- Eligible?
- —
Personal DTI + credit; lowest rate.
DSCR
20% down · 8.5% · 30yr
- Down + closing
- —
- Monthly P&I
- —
- Monthly cashflow
- —
- DSCR
- —
- Eligible?
- —
No personal income docs; deal must DSCR.
Hard money
10% down · 12.0% · 12mo
- Down + closing
- —
- Monthly P&I
- —
- Monthly cashflow
- —
- DSCR
- —
- Eligible?
- —
Short-term bridge; refi at stabilization.
Rent comps 3 comps
| Address | Beds | Baths | Sqft | Rent | $/sqft | DOM | Units | Dist |
|---|---|---|---|---|---|---|---|---|
| 8 Kings Ct Camillus, NY | 1.0–2.0 | 1.0–2.0 | 994 | $1,855 | $1.87 | 13d | 5 | 0.89mi |
| 189 Lookout Cir Syracuse, NY | 2.0 | 1.5 | 1304 | $2,200 | $1.69 | 43d | 1 | 0.96mi |
| 3877 Milton Ave Camillus, NY | 1.0–2.0 | 1.0 | 725 | $2,300 | $3.17 | 13d | 6 | 1.39mi |
Listing history 7 events
-
2026-06-18days on market $169,900 Active 7 DOM
-
2026-06-17days on market $169,900 Active 6 DOM
-
2026-06-16days on market $169,900 Active 5 DOM
-
2026-06-15days on market $169,900 Active 4 DOM
-
2026-06-14days on market $169,900 Active 2 DOM
-
2026-06-13remarks 675-char remark
-
2026-06-13$169,900 Active 1 DOM
ⓘ Source: listings_history table (triggers on properties + properties_extension) + one-shot
backfill from property_details.listing_events for pre-trigger history.
Tax reassessment forecast NY · Partial reset (capped growth)
- Current annual tax
- $3,944 · $329/mo
- Projected year-2 tax
- $3,944 · $329/mo
- Expected delta
- $0/yr ($0/mo · 0.0%)
ⓘ Screening estimate from a state-policy table — verify with the county assessor before closing.
Climate risk First Street
- Flood 1/10 Low FEMA zone X (unshaded) · 0% chance over 30 yrs
- Wildfire 1/10 Low
- Heat 3/10 Moderate 7 d/yr ≥94°F today · 17 d/yr by 30 yrs out
- Wind 1/10 Low 100% chance of damaging wind over 30 yrs
- Air quality 2/10 Low 0 unhealthy d/yr today · 1 by 30 yrs out
Nearby sold comps map
Loading sold comps map…
Walkable amenities ~0.75 mi
Loading nearby amenities…
Taxation est. · year 1
- Rental income
- $24,095
- − Mortgage interest
- −$9,517
- − Property taxes
- −$3,944
- − Insurance
- −$850
- − Repairs & maintenance
- −$1,928
- − Management
- −$1,928
- − Depreciation
- −$4,943
- Taxable income
- $986
- Est. tax owed @ 24.0%
- −$237
- After-tax cash flow
- $3,313/yr
For passive investors: Depreciation is non-cash, so a rental often shows a tax loss while cash-flowing — sheltering income. Rental losses are passive: they offset passive income freely, and up to $25,000/yr can offset ordinary (W-2) income if you actively participate and your MAGI is under $100k (phasing out to $0 by $150k); unused losses carry forward. On sale, claimed depreciation is recaptured at up to 25%, and gains may owe capital-gains tax (a 1031 exchange can defer both). Figures are a year-1 estimate at your 24.0% rate — not tax advice; consult a CPA.
Schools (NCES district)
- District
- West Genesee Central School District
- NCES district ID
- 3630630
- Math proficiency
- 56% ▼ -13.00%
- Reading proficiency
- 61% ▲ 3.00%
- Median HH income
- $65,588
- Composite
- 51.31/100
- National rank
- #1745
- State rank
- #241 of 590 in NY
Livability — Fairmount
- Score
- 72/100
- State rank
- #366
- US rank
- #6334
Category grades
Schools grade is shown separately in the Schools card above.
Census & demographics
- Census place
- Fairmount, NY
- County
- Onondaga County · 247,257 people
- Metro
- Syracuse, NY
- Population (ZIP)
- 14,744
- Household income
- $85,149
- Rent vs Own
- Severe rent burden
- 222.0
Population outlook (Onondaga County) Hauer SSP2
- Today (2025)
- 467,894 people
- By 2030
- 463,381 · -1.0%
- By 2040
- 447,697 · -4.3%
- By 2050
- 426,399 · -8.9%
- By 2075
- 373,661 · -20.1%
- By 2100
- 307,967 · -34.2%
Race, ethnicity, and origin ACS 2023
- Neighborhood character
- Predominantly White (87%)
- Race & ethnicity
- White 87% Two or more races 5% Hispanic / Latino 5% Black 4% Asian 1%
- Common ancestry
- Romanian 8% Lithuanian 4% Subsaharan African 3%
- Foreign-born
- 7% · Canada
- Languages at home
- 91% English-only · Russian/Polish/Slavic 3% Spanish 2% Arabic 1%
Political lean MEDSL · Onondaga
- 2024 margin
- D (+17.3) · D 58.6% · R 41.4%
- 2008→2024 swing
- -3.0pp toward R · 2008: 20.3pp · 2024: 17.3pp
- All cycles
- 2024: D+17.3 2020: D+20.6 2016: D+12.8 2012: D+21.1 2008: D+20.3
Not yet ingested
- Civics
- —
Market trends
- HPI YoY
- ▼ -77.80%
- Current HPI
- 300.7211
- Rent YoY
- —
- Metro
- Syracuse, NY
- State GDP YoY
- ▲ 2.60%
- F500 in state
- 92
Industry mix (Fortune 500 HQ in NY)
| Industry | F500 HQs | Revenue |
|---|---|---|
| Financial Services | 10 | $950B |
|
||
| Consumer Goods | 9 | $162B |
|
||
| Insurance | 4 | $225B |
|
||
| Telecommunications | 2 | $144B |
|
||
| Pharmaceuticals | 2 | $112B |
|
||
| Media / Entertainment | 2 | $69B |
|
||
Price history
+330.1% since first listed2 events — show timeline
- 2026-06-11 Listed $169,900 CNYIS
- 1996-07-12 Sold (Public Records) $39,500 Public Records
Property tax history
+5.4%/yrLatest (2025): $3,944 · +1.9% YoY. Source: county tax records.
Cash-flow waterfall
monthlySold comps — $/sqft
last 12 mo · ≤1 miLoading sold comps…