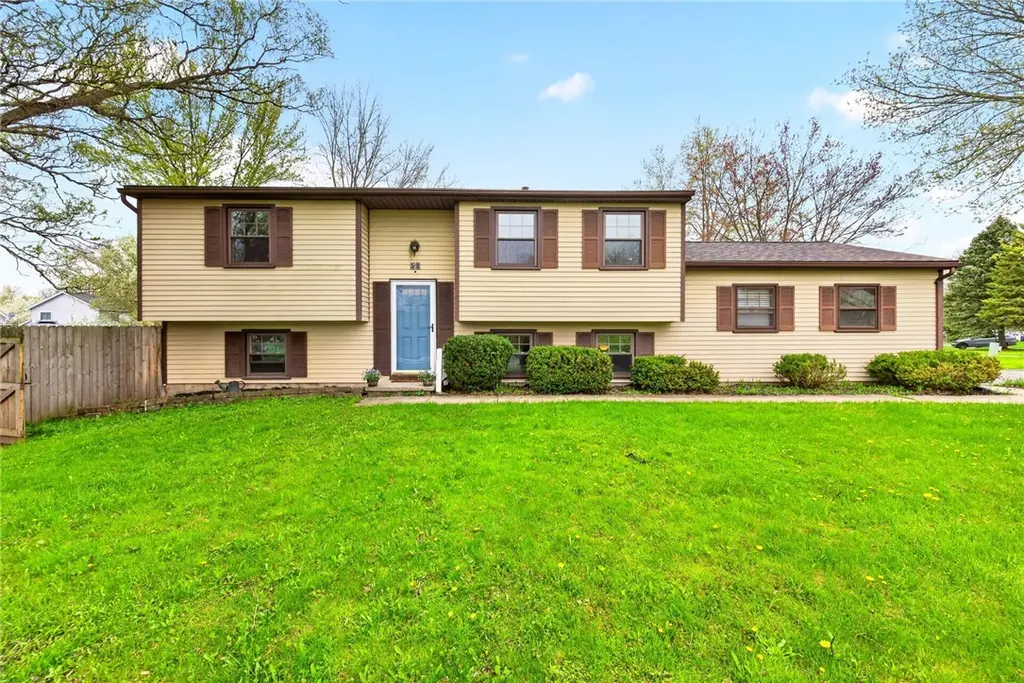
55 Blue Ridge Trl · Rochester, NY
Flood risk 1/10 · Minimal
- FEMA flood zone
- X (unshaded)
- Chance of flooding over 30 yrs
- 0.0%
- Est. flood insurance / yr
- $473 – $860
Fire risk 1/10 · Minimal
- Est. fire insurance / yr
- $691 – $1,283
Heat risk 2/10 · Minimal
- Hot days now (above 95°F)
- 7 days/yr
- Hot days in 30 yrs
- 15 days/yr
Wind risk 1/10 · Minimal
- Chance of severe wind over 30 yrs
- —
Air-quality risk 2/10 · Minimal
- Unhealthy air days now
- 1 days/yr
- Unhealthy air days in 30 yrs
- 1 days/yr
Risk factors via First Street. Map © Google.
Why this score? — see what drove the B- grade
The composite is a weighted blend of 9 inputs, each scored 0–100. Each bar is that input's sub-score; the figure is the points it added to the 100-point composite (weight × sub-score).
- Cash flow +25.6/30.0
- ARV discount +15.0/15.0
- DSCR +8.5/10.0
- 1% rule +8.1/10.0
- Livability +3.8/5.0
- Schools +3.6/10.0
- Rent growth +2.5/5.0
- Condition / age +2.5/5.0
- Appreciation +0.0/10.0
$199,900
🖨 Deal sheet 📄 Offer letter ✓ Due diligence
Listing remarks MLS
Need more space? This move in ready home has 2 bedrooms on the main level and 2 possible bedrooms downstairs with a second bath room equipped with a standing shower. Very well maintained with a lot of fresh paint through out. Plenty of storage space with an attached 2 car garage and a well built shed. Make an offer before it is SOLD! Check out the 3D tour (will be available later on 1/25)
Key facts
- Tear off roof
- Recent updates
- Move in ready
Tags
Property features AI
Exterior
- Parking: Attached garage with automatic door opener; Driveway; 2-car garage
- Utilities: Sewer connected; Water from spring
- Home design: Single-story home; Resale property; Asphalt roof; Vinyl siding exterior; City street frontage; Irregular residential lot (77 x 135)
- Construction: Built as existing structure; Block foundation
- Exterior features: Blacktop driveway; Shed(s) and storage
Interior
- Kitchen: Electric oven; Electric range; Dishwasher; Refrigerator
- Bedrooms: Two main-level bedrooms
- Flooring: Carpet; Ceramic tile; Laminate; Varies
- Bathrooms: Two full bathrooms; One main-level bathroom
- Heating & cooling: Gas forced-air heating; Central air conditioning
- Interior features: Entrance foyer; Kitchen/family room combo; Living/dining room; Bedroom on main level; Main level primary; Full, partially finished basement
- Laundry & utility: Washer; Dryer; Gas water heater
Neighborhood map
What this means for you Summary
Snapshot
- This is a 4-bed/2.0-bath single-family listed at $200k.
Deal economics
- At list price, monthly cash flow is $470 ($6k/yr) — positive.
- The deal already cash-flows at list — no discount required.
- Meets the 1% rule at list price ($3k rent vs $200k).
Location & tenants
- Location reads 76/100 on livability (#222 in NY, #3,482 nationally) — a middle-class / working-renter tenant base. Strengths: commute A+, cost of living A+, housing A+; Watch: schools D+, crime F, employment F.
- Gates-Chili Central School District (suburban): math 41% / reading 42% proficiency, ranked #491 of 590 in NY (top 83%) — families likely to look elsewhere, expect single-tenant / working-renter base with shorter leases.
- Market conditions: 127 active listings in the ZIP; 1 comparable units currently listed for rent nearby; solid renter incomes; 1,169 units permitted in Monroe County in 2024 (591 in 5+ unit buildings).
- This rent runs 36% of the median local income ($88k/yr) — at the standard rent-burdened threshold; future hikes will face affordability resistance.
Forward outlook
- Local home prices are declining (-3.0%/yr); year-one equity from $1k of loan paydown is wiped out by about $6k of value loss. Plan a longer hold.
- Monroe County population projected to shrink 6% by 2050 — rents likely to lag national; underwrite the cash flow, not the appreciation.
Negotiation context
- Only 7 days on market — expect competitive offers; lowballing is unlikely to land.
- 6 sale attempts since 14y ago with the ask held roughly flat each time — persistent listings suggest the price (not the market) is what's stuck; bring a comps-based counter.
Risks & watch-outs
- Watch-outs: property tax is 2.8% of price.
Questions for the listing agent
- Built in 1979 — when were the roof, HVAC, electrical panel, plumbing, and water heater last replaced?
- Property tax is high relative to price — has the assessment been appealed recently, and will the sale trigger a re-assessment?
- Is there a deadline driving the sale (1031 exchange, divorce, estate, relocation)? That informs how much negotiation room exists.
- Schools are D-rated, which usually means shorter tenancies and higher turnover. Who's the typical renter profile here, and what's been the actual vacancy rate?
- Crime grade is F in this area — have there been break-ins, vandalism, or insurance claims at this property in the last 3 years? What carrier currently insures it and at what premium?
- What's the average days-on-market for RENTAL listings here right now (not sales)? A rising rental-DOM trend means longer vacancies and softer asking-rent achievability than the comps imply.
- What's the recent tenant-quality profile in this submarket — average credit score on applications, eviction rate, late-payment / NSF rate, and stable-employment percentage? A property-management company in the area should have these aggregated.
- How much new for-sale + rental construction is in the pipeline within 1–3 miles? Heavy new supply typically softens prices + rents 12–24 months out; constrained supply supports both.
Investment metrics
- 1% rule
- 1.31% ✓
- Cap rate
- 9.11%
- Cash-on-cash
- 10.07%
- DSCR
- 1.45
- GRM
- 6.4
CMA / ARV
- ARV (median comp)
- $303,190
- List price
- $199,900
- Delta
- -34.07%
- Verdict
- UNDERPRICED
- Comps
- 20 within 1.0 mi
Show comp detail 12 sales within ~0.75 mi
| Address | Dist | Beds/Ba | Sqft | Sold | Price | $/sf | Match |
|---|---|---|---|---|---|---|---|
| 15 Jacklyn Dr | 0.57mi | 3/1.5 (-1) | 1,408 (+1%) | 1mo | $195,000 | $138 | 63 |
| 5 Yankee Ct | 0.31mi | 3/1.5 (-1) | 1,514 (+9%) | 10mo | $220,000 | $145 | 55 |
| 11 Battle Green Dr | 0.42mi | 3/2.0 (-1) | 1,520 (+10%) | 6mo | $283,000 | $186 | 54 |
| 27 Flint Lock Cir | 0.20mi | 3/1.5 (-1) | 1,570 (+13%) | 13mo | $254,000 | $162 | 51 |
| 58 Hay Market Rd | 0.62mi | 4/1.5 | 1,512 (+9%) | 5mo | $253,000 | $167 | 50 |
| 3 Kings Way | 0.52mi | 3/2.0 (-1) | 1,579 (+14%) | 0mo | $331,500 | $210 | 48 |
| 30 Constitution Cir | 0.25mi | 3/1.5 (-1) | 1,576 (+14%) | 14mo | $322,000 | $204 | 47 |
| 29 Jacklyn Dr | 0.45mi | 4/2.0 | 1,588 (+14%) | 11mo | $235,000 | $148 | 46 |
| 5 Wellington Ponds | 0.70mi | 3/1.5 (-1) | 1,440 (+4%) | 18mo | $250,000 | $174 | 39 |
| 9 Hillcrest Dr | 0.74mi | 3/1.5 (-1) | 1,542 (+11%) | 7mo | $211,000 | $137 | 34 |
| 773 Marshall Rd | 0.73mi | 4/1.0 | 1,572 (+13%) | 8mo | $230,000 | $146 | 34 |
| 15 Wellington Ponds | 0.72mi | 3/2.5 (-1) | 1,560 (+12%) | 17mo | $184,000 | $118 | 25 |
Match score weights: distance 35% · size 25% · config 20% · recency 20%. Top-matched comps best support the ARV.
Projected returns pro-forma
-3.0% appreciation · 3.0% rent growth · sell at horizon
- IRR
- -1.1%
- Equity multiple
- 0.96×
- Total profit
- $-2,300
- Equity at exit
- $29,806
- IRR
- 8.7%
- Equity multiple
- 1.66×
- Total profit
- $37,218
- Equity at exit
- $17,284
Cash invested: $55,972 (down + closing). Projections, not guarantees.
Landlord ↔ Tenant lean methodology
- Overall (STATE)
- 15 Strongly Tenant-Friendly
- State New York
- 15 Strongly Tenant-Friendly · D+10
- County
- — inherits STATE
- City
- — inherits STATE
ZIP-level market 14624
- Active inventory
- 127
- Price-to-rent
- 6.4×
Monthly cashflow live
- Estimated rent
- $2,612 medium interval (Pro) →
- Mortgage (P&I)
- −$1,048
- Tax from tax record
- −$462 /mo · $5,547/yr
- Insurance
- −$83
- HOA
- −$0
- Vacancy / Maint / Mgmt
- −$549
- Net cashflow
- $470
Break-even live
UW: 25.0% down · 7.5% · 30yr · 1.5% tax · 5.0% vac · 8.0% maint · 8.0% mgmt
Financing live
Cash to close
- Down payment
- $49,975
- Closing costs
- $5,997
- Reserves months
- —
- Total cash needed
- —
Loan-product check · same deal, 3 products live
Conventional
25% down · 7.5% · 30yr
- Down + closing
- —
- Monthly P&I
- —
- Monthly cashflow
- —
- DSCR
- —
- Eligible?
- —
Personal DTI + credit; lowest rate.
DSCR
20% down · 8.5% · 30yr
- Down + closing
- —
- Monthly P&I
- —
- Monthly cashflow
- —
- DSCR
- —
- Eligible?
- —
No personal income docs; deal must DSCR.
Hard money
10% down · 12.0% · 12mo
- Down + closing
- —
- Monthly P&I
- —
- Monthly cashflow
- —
- DSCR
- —
- Eligible?
- —
Short-term bridge; refi at stabilization.
Rent comps 1 comps
| Address | Beds | Baths | Sqft | Rent | $/sqft | DOM | Units | Dist |
|---|---|---|---|---|---|---|---|---|
| 25 Red Bud Rd Rochester, NY | 4.0 | 1.5 | 1568 | $2,600 | $1.66 | 19d | 1 | 1.23mi |
Listing history 15 events
-
2026-05-07status Pending 1024-char remark
-
2026-04-30$199,900 Active 1024-char remark
-
2019-05-17soldstatus $132,000
-
2019-05-16soldstatus $132,000 Closed Sale or Rented 391-char remark
Show marketing remark (391 chars)
Need more space? This move in ready home has 2 bedrooms on the main level and 2 possible bedrooms downstairs with a second bath room equipped with a standing shower. Very well maintained with a lot of fresh paint through out. Plenty of storage space with an attached 2 car garage and a well built shed. Make an offer before it is SOLD! Check out the 3D tour (will be available later on 1/25)
-
2019-01-29status Under Contract- Do Not Show 391-char remark
Show marketing remark (391 chars)
Need more space? This move in ready home has 2 bedrooms on the main level and 2 possible bedrooms downstairs with a second bath room equipped with a standing shower. Very well maintained with a lot of fresh paint through out. Plenty of storage space with an attached 2 car garage and a well built shed. Make an offer before it is SOLD! Check out the 3D tour (will be available later on 1/25)
-
2019-01-25$132,000 Active 391-char remark
Show marketing remark (391 chars)
Need more space? This move in ready home has 2 bedrooms on the main level and 2 possible bedrooms downstairs with a second bath room equipped with a standing shower. Very well maintained with a lot of fresh paint through out. Plenty of storage space with an attached 2 car garage and a well built shed. Make an offer before it is SOLD! Check out the 3D tour (will be available later on 1/25)
-
2016-12-30historical
-
2016-07-14status Active
-
2016-07-14historical
-
2016-06-28$124,900 Active
-
2015-11-03price $124,900
-
2015-10-19$124,900
-
2012-05-21soldstatus $106,000
-
2012-05-07soldstatus $106,000
-
2012-01-06$109,900
ⓘ Source: listings_history table (triggers on properties + properties_extension) + one-shot
backfill from property_details.listing_events for pre-trigger history.
Tax reassessment forecast NY · Partial reset (capped growth)
- Current annual tax
- $5,547 · $462/mo
- Projected year-2 tax
- $5,547 · $462/mo
- Expected delta
- $0/yr ($0/mo · 0.0%)
ⓘ Screening estimate from a state-policy table — verify with the county assessor before closing.
Climate risk First Street
- Flood 1/10 Low FEMA zone X (unshaded) · 0% chance over 30 yrs
- Wildfire 1/10 Low
- Heat 2/10 Low 7 d/yr ≥95°F today · 15 d/yr by 30 yrs out
- Wind 1/10 Low
- Air quality 2/10 Low 1 unhealthy d/yr today · 1 by 30 yrs out
Nearby sold comps map
Loading sold comps map…
Walkable amenities ~0.75 mi
Loading nearby amenities…
Taxation est. · year 1
- Rental income
- $31,347
- − Mortgage interest
- −$11,198
- − Property taxes
- −$5,547
- − Insurance
- −$1,000
- − Repairs & maintenance
- −$2,508
- − Management
- −$2,508
- − Depreciation
- −$5,815
- Taxable income
- $2,772
- Est. tax owed @ 24.0%
- −$665
- After-tax cash flow
- $4,973/yr
For passive investors: Depreciation is non-cash, so a rental often shows a tax loss while cash-flowing — sheltering income. Rental losses are passive: they offset passive income freely, and up to $25,000/yr can offset ordinary (W-2) income if you actively participate and your MAGI is under $100k (phasing out to $0 by $150k); unused losses carry forward. On sale, claimed depreciation is recaptured at up to 25%, and gains may owe capital-gains tax (a 1031 exchange can defer both). Figures are a year-1 estimate at your 24.0% rate — not tax advice; consult a CPA.
Schools (NCES district)
- District
- Gates-Chili Central School District
- NCES district ID
- 3611880
- Math proficiency
- 41% ▼ -12.00%
- Reading proficiency
- 42% ▼ -6.00%
- Median HH income
- $55,045
- Composite
- 36.23/100
- National rank
- #4719
- State rank
- #491 of 590 in NY
Livability — Rochester
- Score
- 76/100
- State rank
- #222
- US rank
- #3482
Category grades
Schools grade is shown separately in the Schools card above.
Census & demographics
- County
- Monroe County · 674,131 people
- City population
- 432,803
- Metro
- Rochester, NY
- Population (ZIP)
- 38,626
- Household income
- $87,989
- Rent vs Own
- Severe rent burden
- 584.0
Population outlook (Monroe County) Hauer SSP2
- Today (2025)
- 759,460 people
- By 2030
- 757,154 · -0.3%
- By 2040
- 740,644 · -2.5%
- By 2050
- 714,443 · -5.9%
- By 2075
- 645,883 · -15.0%
- By 2100
- 547,084 · -28.0%
Race, ethnicity, and origin ACS 2023
- Neighborhood character
- Predominantly White (78%)
- Race & ethnicity
- White 78% Black 9% Hispanic / Latino 6% Two or more races 5% Asian 3%
- Hispanic origin (detail)
- Puerto Rican 4%
- Common ancestry
- Romanian 6% Iranian 2% Lithuanian 2%
- Foreign-born
- 7% · Canada, China, India
- Languages at home
- 90% English-only · Spanish 3% Other Indo-European 3% Russian/Polish/Slavic 1%
Political lean MEDSL · Monroe
- 2024 margin
- D (+19.1) · D 59.5% · R 40.5%
- 2008→2024 swing
- +1.4pp toward D · 2008: 17.7pp · 2024: 19.1pp
- All cycles
- 2024: D+19.1 2020: D+21.0 2016: D+14.1 2012: D+17.4 2008: D+17.7
Not yet ingested
- Civics
- —
Market trends
- HPI YoY
- ▼ -151.26%
- Current HPI
- 267.356
- Rent YoY
- —
- Metro
- Rochester, NY
- State GDP YoY
- ▲ 2.60%
- F500 in state
- 92
Industry mix (Fortune 500 HQ in NY)
| Industry | F500 HQs | Revenue |
|---|---|---|
| Financial Services | 10 | $950B |
|
||
| Consumer Goods | 9 | $162B |
|
||
| Insurance | 4 | $225B |
|
||
| Telecommunications | 2 | $144B |
|
||
| Pharmaceuticals | 2 | $112B |
|
||
| Media / Entertainment | 2 | $69B |
|
||
Price history
+150.2% since first listed16 events — show timeline
- 2026-06-12 Sold (MLS) $275,000 UNYREIS
- 2026-05-07 Pending — UNYREIS
- 2026-04-30 Listed $199,900 UNYREIS
- 2019-05-17 Sold (Public Records) $132,000 Public Records
- 2019-05-16 Sold (MLS) $132,000 UNYREIS
- 2019-01-29 Pending — UNYREIS
- 2019-01-25 Listed $132,000 UNYREIS
- 2016-12-30 Listing Removed — UNYREIS
- 2016-07-14 Relisted — UNYREIS
- 2016-07-14 Listing Removed — UNYREIS
- 2016-06-28 Listed $124,900 UNYREIS
- 2015-11-03 Price Changed $124,900 WNYREIS
- 2015-10-19 Listed $124,900 UNYREIS
- 2012-05-21 Sold (Public Records) $106,000 Public Records
- 2012-05-07 Sold (MLS) $106,000 UNYREIS
- 2012-01-06 Listed $109,900 UNYREIS
Property tax history
+1.1%/yrLatest (2025): $5,547 · -8.5% YoY. Source: county tax records.
Cash-flow waterfall
monthlySold comps — $/sqft
last 12 mo · ≤1 miLoading sold comps…