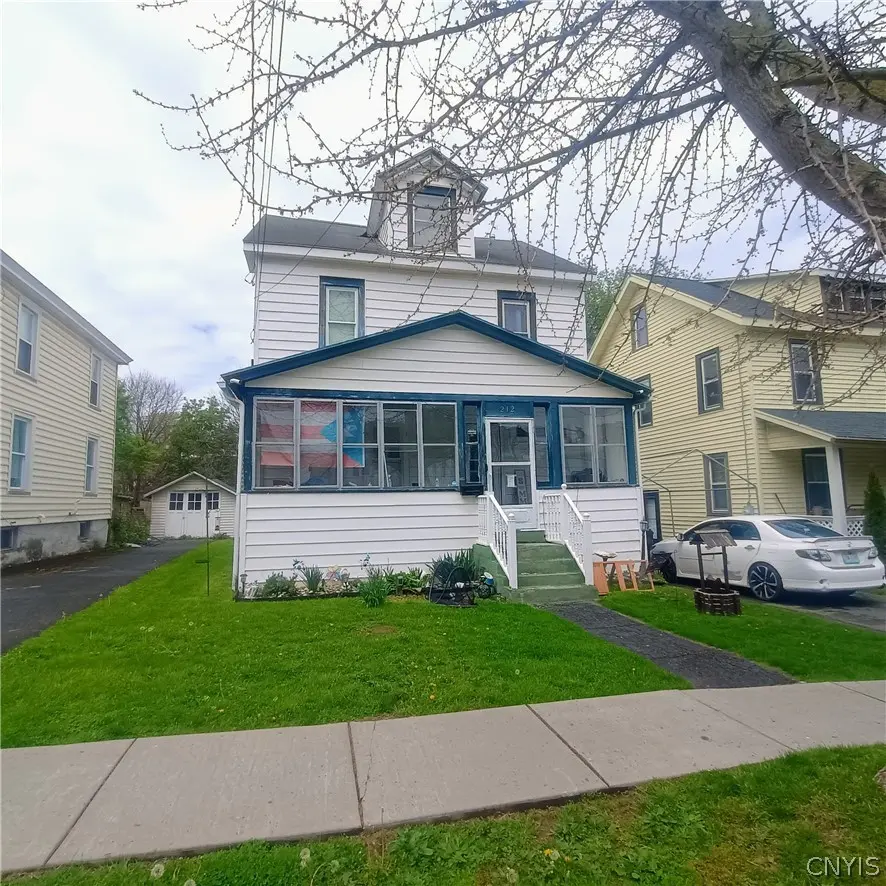
212 Stafford Ave · Syracuse, NY
Flood risk 1/10 · Minimal
- FEMA flood zone
- X (unshaded)
- Chance of flooding over 30 yrs
- 0.0%
- Est. flood insurance / yr
- $473 – $860
Fire risk 1/10 · Minimal
- Est. fire insurance / yr
- $691 – $1,283
Heat risk 3/10 · Minor
- Hot days now (above 94°F)
- 7 days/yr
- Hot days in 30 yrs
- 16 days/yr
Wind risk 1/10 · Minimal
- Chance of severe wind over 30 yrs
- 0.0%
Air-quality risk 2/10 · Minimal
- Unhealthy air days now
- 0 days/yr
- Unhealthy air days in 30 yrs
- 1 days/yr
Risk factors via First Street. Map © Google.
Why this score? — see what drove the B- grade
The composite is a weighted blend of 9 inputs, each scored 0–100. Each bar is that input's sub-score; the figure is the points it added to the 100-point composite (weight × sub-score).
- Cash flow +24.7/30.0
- ARV discount +15.0/15.0
- DSCR +8.0/10.0
- 1% rule +5.6/10.0
- Rent growth +4.0/5.0
- Livability +3.9/5.0
- Condition / age +2.5/5.0
- Schools +1.8/10.0
- Appreciation +0.0/10.0
$169,900
🖨 Deal sheet 📄 Offer letter ✓ Due diligence
Listing remarks MLS
Excellent opportunity for a well maintained property close to all amenities. This one is a must see!
Key facts
- 6,040 sq ft lot
- Garage
- Built 1925
Tags
Property features AI
Exterior
- Parking: Detached garage; 1 garage space
- Utilities: Public water connected; Sewer connected
- Home design: 2-story wood-sided residence; Existing (previously built) property; Block foundation
- Construction: Wood siding; Block foundation
- Exterior features: Concrete driveway; City street frontage; Rectangular residential lot (40 x 151)
Interior
- Kitchen: Refrigerator
- Bedrooms: Total of 8 rooms (includes bedrooms and other rooms)
- Flooring: Carpet; Varied flooring
- Bathrooms: 1 full bathroom
- Heating & cooling: Gas forced-air heating
- Interior features: Eat-in kitchen; Other interior features (see remarks); Full basement
- Laundry & utility: Gas water heater
Neighborhood map
What this means for you Summary
Snapshot
- This is a 3-bed/1.0-bath single-family listed at $170k.
Deal economics
- At list price, monthly cash flow is $355 ($4k/yr) — positive.
- The deal already cash-flows at list — no discount required.
- Meets the 1% rule at list price ($2k rent vs $170k).
- Recommended offer: $167k (1.5% below list) — sets the bar for market timing.
Location & tenants
- Location reads 77/100 on livability (#187 in NY, #2,869 nationally) — a middle-class / working-renter tenant base. Strengths: amenities A+, commute A+, cost of living A+; Watch: schools D+, crime F, employment D-.
- Syracuse City School District (urban): math 18% / reading 26% proficiency, ranked #590 of 590 in NY (top 100%) — low school quality limits family demand, transient renter base, plan for 1-2y turnover; 74% free/reduced lunch — lower-income household profile, screen leases tightly.
- Market conditions: Rents rising fast (+5.8%/yr); 42 active listings in the ZIP; 12 comparable units currently listed for rent nearby; rentals leasing fast (median 14d on market — plan ~1-2 weeks tenant-placement turnaround); 616 units permitted in Onondaga County in 2024 (256 in 5+ unit buildings).
- This rent runs 34% of the median local income ($63k/yr) — at the standard rent-burdened threshold; future hikes will face affordability resistance.
Forward outlook
- Local home prices are declining (-3.0%/yr); year-one equity from $1k of loan paydown is wiped out by about $5k of value loss. Plan a longer hold.
- Onondaga County population projected to shrink 9% by 2050 — rents likely to lag national; underwrite the cash flow, not the appreciation.
- At projected returns (-3.0% appreciation + 5.8% rent growth), your $48k cash investment doubles in ~9 years — after that, you're playing with house money.
Negotiation context
- It's been on market 30 days — a 2% lower offer ($167k) is reasonable based on typical stale-listing flexibility.
- 2 sale attempts since 5y ago with the ask held roughly flat each time — persistent listings suggest the price (not the market) is what's stuck; bring a comps-based counter.
Risks & watch-outs
- Watch-outs: built in 1925 — expect roof / HVAC / electrical / plumbing capex.
Questions for the listing agent
- Built in 1925 — when were the roof, HVAC, electrical panel, plumbing, and water heater last replaced?
- Is there a deadline driving the sale (1031 exchange, divorce, estate, relocation)? That informs how much negotiation room exists.
- Schools are D-rated, which usually means shorter tenancies and higher turnover. Who's the typical renter profile here, and what's been the actual vacancy rate?
- Crime grade is F in this area — have there been break-ins, vandalism, or insurance claims at this property in the last 3 years? What carrier currently insures it and at what premium?
- What's the average days-on-market for RENTAL listings here right now (not sales)? A rising rental-DOM trend means longer vacancies and softer asking-rent achievability than the comps imply.
- What's the recent tenant-quality profile in this submarket — average credit score on applications, eviction rate, late-payment / NSF rate, and stable-employment percentage? A property-management company in the area should have these aggregated.
- How much new for-sale + rental construction is in the pipeline within 1–3 miles? Heavy new supply typically softens prices + rents 12–24 months out; constrained supply supports both.
Investment metrics
- 1% rule
- 1.06% ✓
- Cap rate
- 8.80%
- Cash-on-cash
- 8.96%
- DSCR
- 1.40
- GRM
- 7.8
CMA / ARV
- ARV (on-the-fly)
- $225,456
- Comps found
- 12
Show comp detail 12 sales within ~0.75 mi
| Address | Dist | Beds/Ba | Sqft | Sold | Price | $/sf | Match |
|---|---|---|---|---|---|---|---|
| 337 Lillian Ave | 0.43mi | 3/1.5 | 1,436 (-2%) | 3mo | $100,000 | $70 | 72 |
| 362 Hickok Ave | 0.26mi | 3/1.0 | 1,320 (-10%) | 3mo | $199,900 | $151 | 69 |
| 227 Hixson St | 0.38mi | 3/1.5 | 1,536 (+5%) | 5mo | $154,900 | $101 | 68 |
| 125 Paul Ave | 0.40mi | 4/1.5 (+1) | 1,527 (+4%) | 1mo | $210,000 | $138 | 66 |
| 136 S Collingwood Ave | 0.29mi | 4/1.0 (+1) | 1,344 (-8%) | 3mo | $60,236 | $45 | 65 |
| 127 Schuler St | 0.65mi | 4/1.5 (+1) | 1,448 (-1%) | 1mo | $225,000 | $155 | 60 |
| 158 Norwood Ave | 0.37mi | 4/1.0 (+1) | 1,292 (-12%) | 3mo | $200,000 | $155 | 56 |
| 305 Ashdale Ave | 0.59mi | 2/1.0 (-1) | 1,361 (-7%) | 2mo | $210,000 | $154 | 54 |
| 124 Winthrop Rd | 0.71mi | 3/1.0 | 1,320 (-10%) | 4mo | $240,000 | $182 | 47 |
| 259 Homecroft Rd | 0.55mi | 3/2.0 | 1,260 (-14%) | 5mo | $251,000 | $199 | 43 |
| 129 Noble Ave | 0.70mi | 3/2.0 | 1,276 (-13%) | 1mo | $205,000 | $161 | 42 |
| 135 Plymouth Dr | 0.68mi | 3/1.5 | 1,671 (+14%) | 4mo | $188,000 | $113 | 39 |
Match score weights: distance 35% · size 25% · config 20% · recency 20%. Top-matched comps best support the ARV.
Projected returns pro-forma
-3.0% appreciation · 5.85% rent growth · sell at horizon
- IRR
- 0.2%
- Equity multiple
- 1.01×
- Total profit
- $379
- Equity at exit
- $25,333
- IRR
- 12.4%
- Equity multiple
- 2.10×
- Total profit
- $52,479
- Equity at exit
- $14,690
Cash invested: $47,572 (down + closing). Projections, not guarantees.
Landlord ↔ Tenant lean methodology
- Overall (STATE)
- 15 Strongly Tenant-Friendly
- State New York
- 15 Strongly Tenant-Friendly · D+10
- County
- — inherits STATE
- City
- — inherits STATE
ZIP-level market 13206
- Home prices YoY
- -7.1%
- Rents YoY
- 5.8%
- Active inventory
- 42
- Price-to-rent
- 7.8×
Monthly cashflow live
- Estimated rent
- $1,805 high interval (Pro) →
- Mortgage (P&I)
- −$891
- Tax from tax record
- −$109 /mo · $1,312/yr
- Insurance
- −$71
- HOA
- −$0
- Vacancy / Maint / Mgmt
- −$379
- Net cashflow
- $355
Break-even live
UW: 25.0% down · 7.5% · 30yr · 1.5% tax · 5.0% vac · 8.0% maint · 8.0% mgmt
Financing live
Cash to close
- Down payment
- $42,475
- Closing costs
- $5,097
- Reserves months
- —
- Total cash needed
- —
Loan-product check · same deal, 3 products live
Conventional
25% down · 7.5% · 30yr
- Down + closing
- —
- Monthly P&I
- —
- Monthly cashflow
- —
- DSCR
- —
- Eligible?
- —
Personal DTI + credit; lowest rate.
DSCR
20% down · 8.5% · 30yr
- Down + closing
- —
- Monthly P&I
- —
- Monthly cashflow
- —
- DSCR
- —
- Eligible?
- —
No personal income docs; deal must DSCR.
Hard money
10% down · 12.0% · 12mo
- Down + closing
- —
- Monthly P&I
- —
- Monthly cashflow
- —
- DSCR
- —
- Eligible?
- —
Short-term bridge; refi at stabilization.
Rent comps 12 comps
| Address | Beds | Baths | Sqft | Rent | $/sqft | DOM | Units | Dist |
|---|---|---|---|---|---|---|---|---|
| 202 Stafford Ave Syracuse, NY | 3.0 | 1.0 | 1692 | $1,800 | $1.06 | 13d | 1 | 0.02mi |
| 225 Marlborough Rd Syracuse, NY | 2.0 | 1.0 | 1040 | $1,800 | $1.73 | 13d | 1 | 0.33mi |
| 204 Mariposa St Unit pvt house Syracuse, NY | 3.0 | 1.0 | 1128 | $2,137 | $1.89 | 13d | 1 | 0.42mi |
| 1801 James St #2 Syracuse, NY | 3.0 | 1.0 | 1244 | $1,800 | $1.45 | 13d | 1 | 0.45mi |
| 297 Norwood Ave Syracuse, NY | 3.0 | 1.0 | 1188 | $2,050 | $1.73 | 21d | 1 | 0.52mi |
| 1618 James St #3 Syracuse, NY | 2.0 | 1.0 | 1150 | $2,200 | $1.91 | 13d | 1 | 0.63mi |
| 112 Gale Ave Unit 1 Syracuse, NY | 2.0 | 1.0 | 1848 | $1,400 | $0.76 | 43d | 1 | 0.64mi |
| 417 Hazelhurst Ave Syracuse, NY | 2.0 | 1.0 | 1536 | $1,250 | $0.81 | 21d | 1 | 0.74mi |
| 423 Wendell Ter Syracuse, NY | 4.0 | 1.0 | 1312 | $2,500 | $1.91 | 13d | 1 | 0.92mi |
| 213 Beattie St Syracuse, NY | 2.0 | 1.0 | 975 | $1,370 | $1.41 | 13d | 1 | 1.11mi |
| 126 Woodruff Ave Syracuse, NY | 3.0 | 1.0 | 1200 | $1,675 | $1.40 | 43d | 1 | 1.26mi |
| 118 Niven St Syracuse, NY | 3.0 | 1.0 | 1150 | $1,650 | $1.43 | 21d | 1 | 1.32mi |
Listing history 21 events
-
2026-06-18days on market $169,900 Active 30 DOM
-
2026-06-17days on market $169,900 Active 29 DOM
-
2026-06-16days on market $169,900 Active 28 DOM
-
2026-06-15days on market $169,900 Active 27 DOM
-
2026-06-14days on market $169,900 Active 25 DOM
-
2026-06-13days on market $169,900 Active 24 DOM
-
2026-06-10days on market $169,900 Active 22 DOM
-
2026-06-09days on market $169,900 Active 21 DOM
-
2026-06-08days on market $169,900 Active 20 DOM
-
2026-06-07days on market $169,900 Active 19 DOM
-
2026-06-05days on market $169,900 Active 16 DOM
-
2026-06-02days on market $169,900 Active 14 DOM
-
2026-06-01days on market $169,900 Active 13 DOM
-
2026-05-31days on market $169,900 Active 12 DOM
-
2026-05-30days on market $169,900 Active 11 DOM
-
2026-05-19$169,900 Active
-
2026-04-29soldstatus $504,425
-
2022-03-01soldstatus $109,900
-
2022-02-18soldstatus $109,900 Closed Sale or Rented 100-char remark
Show marketing remark (100 chars)
Excellent opportunity for a well maintained property close to all amenities. This one is a must see!
-
2021-12-21status Under Contract- Do Not Show 100-char remark
Show marketing remark (100 chars)
Excellent opportunity for a well maintained property close to all amenities. This one is a must see!
-
2021-12-16$109,900 Active 100-char remark
Show marketing remark (100 chars)
Excellent opportunity for a well maintained property close to all amenities. This one is a must see!
ⓘ Source: listings_history table (triggers on properties + properties_extension) + one-shot
backfill from property_details.listing_events for pre-trigger history.
Tax reassessment forecast NY · Partial reset (capped growth)
- Current annual tax
- $1,312 · $109/mo
- Projected year-2 tax
- $2,092 · $174/mo
- Expected delta
- +$780/yr (+$65/mo · 59.4%)
ⓘ Screening estimate from a state-policy table — verify with the county assessor before closing.
Climate risk First Street
- Flood 1/10 Low FEMA zone X (unshaded) · 0% chance over 30 yrs
- Wildfire 1/10 Low
- Heat 3/10 Moderate 7 d/yr ≥94°F today · 16 d/yr by 30 yrs out
- Wind 1/10 Low 0% chance of damaging wind over 30 yrs
- Air quality 2/10 Low 0 unhealthy d/yr today · 1 by 30 yrs out
Nearby sold comps map
Loading sold comps map…
Walkable amenities ~0.75 mi
Loading nearby amenities…
Taxation est. · year 1
- Rental income
- $21,665
- − Mortgage interest
- −$9,517
- − Property taxes
- −$1,312
- − Insurance
- −$850
- − Repairs & maintenance
- −$1,733
- − Management
- −$1,733
- − Depreciation
- −$4,943
- Taxable income
- $1,578
- Est. tax owed @ 24.0%
- −$379
- After-tax cash flow
- $3,884/yr
For passive investors: Depreciation is non-cash, so a rental often shows a tax loss while cash-flowing — sheltering income. Rental losses are passive: they offset passive income freely, and up to $25,000/yr can offset ordinary (W-2) income if you actively participate and your MAGI is under $100k (phasing out to $0 by $150k); unused losses carry forward. On sale, claimed depreciation is recaptured at up to 25%, and gains may owe capital-gains tax (a 1031 exchange can defer both). Figures are a year-1 estimate at your 24.0% rate — not tax advice; consult a CPA.
Schools (NCES district)
- District
- Syracuse City School District
- NCES district ID
- 3628590
- Math proficiency
- 18% ▼ -5.00%
- Reading proficiency
- 26% ▬ 0.00%
- Median HH income
- $32,097
- Composite
- 17.83/100
- National rank
- #9007
- State rank
- #590 of 590 in NY
Livability — Syracuse
- Score
- 77/100
- State rank
- #187
- US rank
- #2869
Category grades
Schools grade is shown separately in the Schools card above.
Census & demographics
- Census place
- Syracuse, NY
- County
- Onondaga County · 247,257 people
- City population
- 152,627
- Metro
- Syracuse, NY
- Population (ZIP)
- 16,245
- Household income
- $63,136
- Rent vs Own
- Severe rent burden
- 725.0
Population outlook (Onondaga County) Hauer SSP2
- Today (2025)
- 467,894 people
- By 2030
- 463,381 · -1.0%
- By 2040
- 447,697 · -4.3%
- By 2050
- 426,399 · -8.9%
- By 2075
- 373,661 · -20.1%
- By 2100
- 307,967 · -34.2%
Race, ethnicity, and origin ACS 2023
- Neighborhood character
- Predominantly White (67%)
- Race & ethnicity
- White 67% Black 13% Two or more races 9% Hispanic / Latino 8% Asian 5%
- Hispanic origin (detail)
- Puerto Rican 4%
- Common ancestry
- Romanian 6% Lithuanian 4% Slovak 2%
- Foreign-born
- 8% · Canada, Jamaica, China
- Languages at home
- 89% English-only · Spanish 3% Arabic 2% Other Indo-European 1%
Political lean MEDSL · Onondaga
- 2024 margin
- D (+17.3) · D 58.6% · R 41.4%
- 2008→2024 swing
- -3.0pp toward R · 2008: 20.3pp · 2024: 17.3pp
- All cycles
- 2024: D+17.3 2020: D+20.6 2016: D+12.8 2012: D+21.1 2008: D+20.3
Not yet ingested
- Civics
- —
Market trends
- HPI YoY
- ▼ -24.60%
- Current HPI
- 322.231
- Rent YoY
- ▲ 5.85%
- Metro
- Syracuse, NY
- State GDP YoY
- ▲ 2.60%
- F500 in state
- 92
Industry mix (Fortune 500 HQ in NY)
| Industry | F500 HQs | Revenue |
|---|---|---|
| Financial Services | 10 | $950B |
|
||
| Consumer Goods | 9 | $162B |
|
||
| Insurance | 4 | $225B |
|
||
| Telecommunications | 2 | $144B |
|
||
| Pharmaceuticals | 2 | $112B |
|
||
| Media / Entertainment | 2 | $69B |
|
||
Price history
+54.6% since first listed6 events — show timeline
- 2026-05-19 Listed $169,900 CNYIS
- 2026-04-29 Sold (Public Records) $504,425 Public Records
- 2022-03-01 Sold (Public Records) $109,900 Public Records
- 2022-02-18 Sold (MLS) $109,900 CNYIS
- 2021-12-21 Pending — CNYIS
- 2021-12-16 Listed $109,900 CNYIS
Property tax history
-0.3%/yrLatest (2025): $1,312 · +0.0% YoY. Source: county tax records.
Cash-flow waterfall
monthlySold comps — $/sqft
last 12 mo · ≤1 miLoading sold comps…