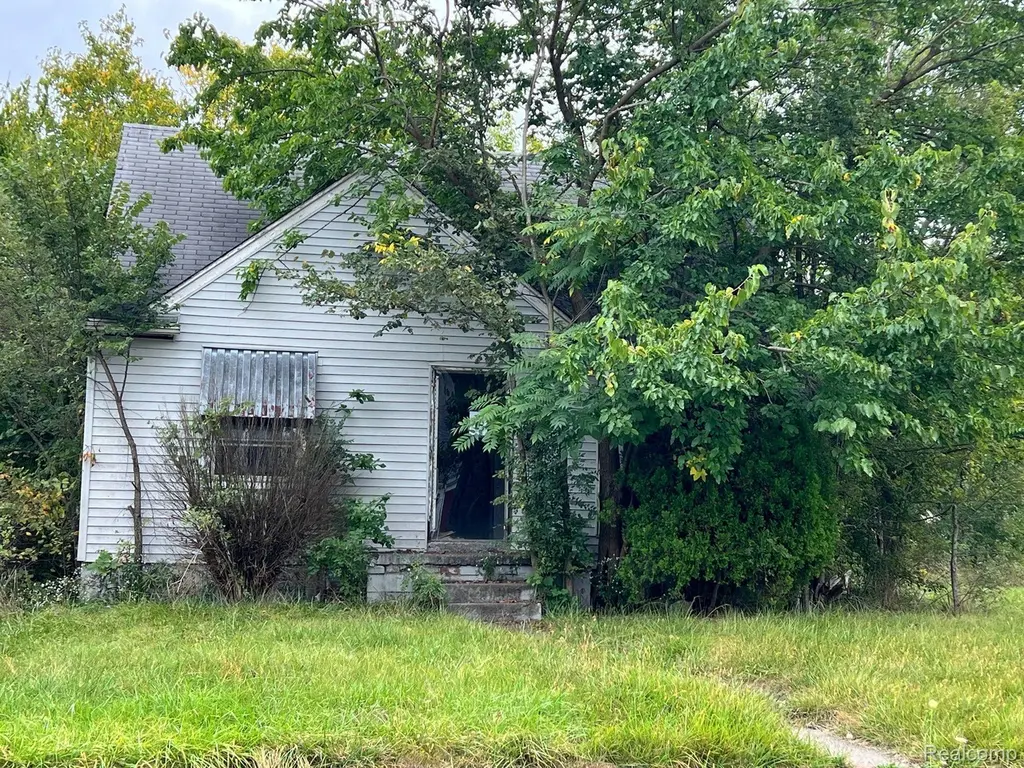
18620 Maine St · Detroit, MI
Flood risk 1/10 · Minimal
- FEMA flood zone
- X (unshaded)
- Chance of flooding over 30 yrs
- 0.0%
- Est. flood insurance / yr
- $473 – $860
Fire risk 1/10 · Minimal
- Est. fire insurance / yr
- $784 – $1,456
Heat risk 3/10 · Minor
- Hot days now (above 97°F)
- 7 days/yr
- Hot days in 30 yrs
- 15 days/yr
Wind risk 2/10 · Minimal
- Chance of severe wind over 30 yrs
- —
Air-quality risk 4/10 · Minor
- Unhealthy air days now
- 4 days/yr
- Unhealthy air days in 30 yrs
- 6 days/yr
Risk factors via First Street. Map © Google.
Why this score? — see what drove the D grade
The composite is a weighted blend of 9 inputs, each scored 0–100. Each bar is that input's sub-score; the figure is the points it added to the 100-point composite (weight × sub-score).
- Cash flow +15.0/30.0
- ARV discount +7.5/15.0
- 1% rule +5.0/10.0
- DSCR +5.0/10.0
- Rent growth +4.2/5.0
- Livability +3.7/5.0
- Condition / age +2.5/5.0
- Schools +1.3/10.0
- Appreciation +0.0/10.0
$12,000
🖨 Deal sheet 📄 Offer letter ✓ Due diligence
Listing remarks MLS
Great investment opportunity in the Northeast Central District and awaiting your vision. Offered by the Detroit Landbank Authority, this home is a 3 bedroom bungalow included with the vacant land, 18610 Maine that is 5271 square feet. Sale contingent on buyer/seller executed development agreement. POF documentation MUST be presented with proposal (not just stated in the proposal), development timelines and offer amounts MUST be included in the proposals. Renovation experience whether DLBA or not, MUST include addresses and BEFORE/AFTER photos. Please note that the Detroit Land Bank Authority is entitled to a tax capture for the 5 tax years subsequent to transferring ownership of the property. The tax capture may be incompatible with tax abatements and lot combinations that are otherwise available to the selected purchaser. DLBA will review requests to waive its tax capture rights and may require a payment in lieu of taxes to approve such requests. The payment will be determined upon reviewing the development proforma and effect of any tax abatements on the purchase and development financing. be determined upon reviewing the development proforma and effect of any tax abatements on the purchase and development.
Key facts
- 4,356 sq ft lot
- Built 1950
- Listed 619 days
Neighborhood map
What this means for you Summary
Snapshot
- This is a 3-bed/1.0-bath single-family listed at $12k.
Deal economics
- At list price, monthly cash flow is $923 ($11k/yr) — positive.
- The deal already cash-flows at list — no discount required.
- Meets the 1% rule at list price ($1k rent vs $12k).
- Recommended offer: $11k (12.0% below list) — sets the bar for market timing.
- Cap rate 98.6% vs local median 10.2% in Detroit — top-decile yield for the area; either an underpriced asset or a hidden risk that comps aren't pricing in. Stress-test before assuming the spread holds.
Location & tenants
- Location reads 73/100 on livability (#218 in MI) — a middle-class / working-renter tenant base. Strengths: amenities A+, commute A+, cost of living A+; Watch: schools F, crime F, employment F.
- Detroit Public Schools Community District (urban): math 10% / reading 24% proficiency, ranked #499 of 540 in MI (top 92%) — low school quality limits family demand, transient renter base, plan for 1-2y turnover; 90% free/reduced lunch — lower-income household profile, screen leases tightly.
- Market conditions: Rents rising fast (+6.7%/yr); 226 active listings in the ZIP; 22 comparable units currently listed for rent nearby; rentals at typical pace (median 18d on market — plan ~3-4 weeks tenant-placement turnaround); lower-income renter base — watch delinquency; 2,639 units permitted in Wayne County in 2024 (1,216 in 5+ unit buildings).
- This rent runs 43% of the median local income ($35k/yr) — at the standard rent-burdened threshold; future hikes will face affordability resistance.
Forward outlook
- Local home prices are declining (-3.0%/yr); year-one equity from $83 of loan paydown is wiped out by about $360 of value loss. Plan a longer hold.
- Wayne County population projected at -17% by 2050 — secular population decline; favor cash flow + early exit over multi-decade hold.
- At projected returns (-3.0% appreciation + 6.7% rent growth), your $3k cash investment doubles in ~1 year — after that, you're playing with house money.
Negotiation context
- It's been on market 619 days — a 12% lower offer ($11k) is reasonable based on typical stale-listing flexibility.
- 5 sale attempts since 22y ago with the ask held roughly flat each time — persistent listings suggest the price (not the market) is what's stuck; bring a comps-based counter.
Risks & watch-outs
- Watch-outs: built in 1950 — expect roof / HVAC / electrical / plumbing capex.
Questions for the listing agent
- It's been on market 619 days. Have you received any prior offers? Is the seller open to a 12% concession, seller financing, or rate buy-down credit?
- Built in 1950 — when were the roof, HVAC, electrical panel, plumbing, and water heater last replaced?
- Why hasn't it sold? Are there any deal-killer items the seller is aware of (foundation, flood, title, zoning, code violations)?
- Is there a deadline driving the sale (1031 exchange, divorce, estate, relocation)? That informs how much negotiation room exists.
- Schools are F-rated, which usually means shorter tenancies and higher turnover. Who's the typical renter profile here, and what's been the actual vacancy rate?
- Crime grade is F in this area — have there been break-ins, vandalism, or insurance claims at this property in the last 3 years? What carrier currently insures it and at what premium?
- The area grade is low — what's the realistic commute time and amenity access for the typical tenant pool here? Any planned neighborhood developments (good or bad) we should know about?
- What's the average days-on-market for RENTAL listings here right now (not sales)? A rising rental-DOM trend means longer vacancies and softer asking-rent achievability than the comps imply.
- What's the recent tenant-quality profile in this submarket — average credit score on applications, eviction rate, late-payment / NSF rate, and stable-employment percentage? A property-management company in the area should have these aggregated.
- How much new for-sale + rental construction is in the pipeline within 1–3 miles? Heavy new supply typically softens prices + rents 12–24 months out; constrained supply supports both.
Investment metrics
- 1% rule
- 10.67% ✓
- Cap rate
- 98.63%
- Cash-on-cash
- 329.76%
- DSCR
- 15.67
- GRM
- 0.8
CMA / ARV
- ARV (median comp)
- $50,066
- List price
- $12,000
- Delta
- -76.03%
- Verdict
- UNDERPRICED
- Comps
- 20 within 1.0 mi
Show comp detail 12 sales within ~0.75 mi
| Address | Dist | Beds/Ba | Sqft | Sold | Price | $/sf | Match |
|---|---|---|---|---|---|---|---|
| 18877 Fleming St | 0.23mi | 2/1.0 (-1) | 870 (-2%) | 3mo | $9,900 | $11 | 79 |
| 17955 Charest St | 0.41mi | 3/1.0 | 880 (-1%) | 4mo | $51,800 | $59 | 76 |
| 18660 Klinger St | 0.36mi | 4/2.0 (+1) | 880 (-1%) | 0mo | $21,000 | $24 | 72 |
| 18128 Fleming St | 0.23mi | 2/1.0 (-1) | 950 (+7%) | 1mo | $21,500 | $23 | 72 |
| 18547 Anglin St | 0.07mi | 3/1.0 | 1,000 (+12%) | 6mo | $93,000 | $93 | 71 |
| 17888 Marx St | 0.52mi | 3/1.0 | 937 (+5%) | 2mo | $34,000 | $36 | 65 |
| 17139 Mackay St | 0.75mi | 3/1.0 | 896 (+1%) | 1mo | $30,000 | $33 | 63 |
| 19227 Ryan Rd | 0.71mi | 3/1.0 | 919 (+3%) | 1mo | $38,000 | $41 | 60 |
| 19619 Norwood St | 0.70mi | 3/1.0 | 941 (+6%) | 2mo | $30,500 | $32 | 56 |
| 19300 Binder St | 0.72mi | 2/1.0 (-1) | 820 (-8%) | 4mo | $10,000 | $12 | 45 |
| 18905 Dean St | 0.71mi | 3/1.0 | 990 (+11%) | 6mo | $88,900 | $90 | 43 |
| 17833 Binder St | 0.71mi | 3/1.0 | 1,000 (+12%) | 4mo | $46,000 | $46 | 42 |
Match score weights: distance 35% · size 25% · config 20% · recency 20%. Top-matched comps best support the ARV.
Projected returns pro-forma
-3.0% appreciation · 6.72% rent growth · sell at horizon
- IRR
- —
- Equity multiple
- 19.41×
- Total profit
- $61,856
- Equity at exit
- $1,789
- IRR
- —
- Equity multiple
- 46.15×
- Total profit
- $151,699
- Equity at exit
- $1,038
Cash invested: $3,360 (down + closing). Projections, not guarantees.
Landlord ↔ Tenant lean methodology
- Overall (STATE)
- 62 Landlord-Friendly
- State Michigan
- 62 Landlord-Friendly · EVEN
- County
- — inherits STATE
- City
- — inherits STATE
ZIP-level market 48234
- Home prices YoY
- -11.9%
- Rents YoY
- 6.7%
- Active inventory
- 226
- Price-to-rent
- 0.8×
Monthly cashflow live
- Estimated rent
- $1,280 high interval (Pro) →
- Mortgage (P&I)
- −$63
- Tax from tax record
- −$20 /mo · $240/yr
- Insurance
- −$5
- HOA
- −$0
- Vacancy / Maint / Mgmt
- −$269
- Net cashflow
- $923
Break-even live
UW: 25.0% down · 7.5% · 30yr · 1.5% tax · 5.0% vac · 8.0% maint · 8.0% mgmt
Financing live
Cash to close
- Down payment
- $3,000
- Closing costs
- $360
- Reserves months
- —
- Total cash needed
- —
Loan-product check · same deal, 3 products live
Conventional
25% down · 7.5% · 30yr
- Down + closing
- —
- Monthly P&I
- —
- Monthly cashflow
- —
- DSCR
- —
- Eligible?
- —
Personal DTI + credit; lowest rate.
DSCR
20% down · 8.5% · 30yr
- Down + closing
- —
- Monthly P&I
- —
- Monthly cashflow
- —
- DSCR
- —
- Eligible?
- —
No personal income docs; deal must DSCR.
Hard money
10% down · 12.0% · 12mo
- Down + closing
- —
- Monthly P&I
- —
- Monthly cashflow
- —
- DSCR
- —
- Eligible?
- —
Short-term bridge; refi at stabilization.
Rent comps 22 comps
| Address | Beds | Baths | Sqft | Rent | $/sqft | DOM | Units | Dist |
|---|---|---|---|---|---|---|---|---|
| 18629 Fleming St Detroit, MI | 3.0 | 1.5 | 900 | $1,150 | $1.28 | 24d | 1 | 0.18mi |
| 18666 Joseph Campau St Detroit, MI | 3.0 | 1.0 | 1000 | $1,400 | $1.40 | 16d | 1 | 0.18mi |
| 18084 Goddard St Detroit, MI | 2.0 | 1.5 | 790 | $1,050 | $1.33 | 16d | 1 | 0.22mi |
| 18551 Saint Aubin St Detroit, MI | 3.0 | 1.0 | 962 | $1,200 | $1.25 | 16d | 1 | 0.30mi |
| 18882 Marx St Highland Park, MI | 2.0 | 1.0 | 1000 | $1,300 | $1.30 | 43d | 1 | 0.41mi |
| 19360 Revere St Detroit, MI | 3.0 | 1.0 | 1050 | $1,250 | $1.19 | 24d | 1 | 0.61mi |
| 19450 Norwood St Detroit, MI | 3.0 | 1.0 | 1000 | $1,200 | $1.20 | 5d | 1 | 0.70mi |
| 19694 Gallagher St Detroit, MI | 3.0 | 1.0 | 1000 | $1,150 | $1.15 | 15d | 1 | 0.70mi |
| 18662 Sunset St Detroit, MI | 2.0 | 1.0 | 726 | $1,250 | $1.72 | 18d | 1 | 0.79mi |
| 19930 Binder St Detroit, MI | 3.0 | 1.0 | 1000 | $1,450 | $1.45 | 16d | 1 | 0.97mi |
| 13929 Arlington St Unit 2 Hamtramck, MI | 2.0 | 1.0 | 700 | $950 | $1.36 | 43d | 1 | 1.01mi |
| 20255 Harned St Detroit, MI | 3.0 | 1.0 | 1000 | $1,374 | $1.37 | 16d | 1 | 1.03mi |
| 19162 Conley St Detroit, MI | 2.0 | 1.0 | 1000 | $1,300 | $1.30 | 43d | 1 | 1.24mi |
| 19450 Fenelon St Detroit, MI | 3.0 | 1.0 | 1062 | $1,384 | $1.30 | 5d | 1 | 1.26mi |
| 18891 Moenart St Detroit, MI | 3.0 | 1.0 | 870 | $1,195 | $1.37 | 16d | 1 | 1.32mi |
| 2034 John B Ave Warren, MI | 3.0 | 1.0 | 920 | $1,261 | $1.37 | 43d | 1 | 1.34mi |
| 19361 Moenart St Unit 1 Detroit, MI | 2.0 | 1.0 | 1000 | $1,100 | $1.10 | 24d | 1 | 1.38mi |
| 18884 Bloom St Detroit, MI | 3.0 | 1.0 | 979 | $975 | $1.00 | 22d | 1 | 1.40mi |
| 18884 Bloom St Detroit, MI | 3.0 | 1.0 | 979 | $975 | $1.00 | 43d | 1 | 1.40mi |
| 19703 Keating St Highland Park, MI | 3.0 | 1.0 | 1000 | $1,200 | $1.20 | 16d | 1 | 1.40mi |
| 19260 Bloom St Detroit, MI | 3.0 | 1.0 | 1100 | $1,350 | $1.23 | 4d | 1 | 1.44mi |
| 21155 Warner Ave Warren, MI | 2.0 | 1.0 | 756 | $1,029 | $1.36 | 24d | 1 | 1.46mi |
Listing history 20 events
-
2026-06-18days on market $12,000 Active 619 DOM
-
2026-06-17days on market $12,000 Active 618 DOM
-
2026-06-15days on market $12,000 Active 616 DOM
-
2026-06-13days on market $12,000 Active 614 DOM
-
2026-06-13days on market $12,000 Active 613 DOM
-
2026-06-09days on market $12,000 Active 610 DOM
-
2026-06-08days on market $12,000 Active 609 DOM
-
2026-06-07days on market $12,000 Active 608 DOM
-
2026-06-04days on market $12,000 Active 605 DOM
-
2026-06-03days on market $12,000 Active 604 DOM
-
2026-06-01days on market $12,000 Active 602 DOM
-
2026-05-31days on market $12,000 Active 601 DOM
-
2024-10-07$12,000 Active 1228-char remark
Show marketing remark (1228 chars)
Great investment opportunity in the Northeast Central District and awaiting your vision. Offered by the Detroit Landbank Authority, this home is a 3 bedroom bungalow included with the vacant land, 18610 Maine that is 5271 square feet. Sale contingent on buyer/seller executed development agreement. POF documentation MUST be presented with proposal (not just stated in the proposal), development timelines and offer amounts MUST be included in the proposals. Renovation experience whether DLBA or not, MUST include addresses and BEFORE/AFTER photos. Please note that the Detroit Land Bank Authority is entitled to a tax capture for the 5 tax years subsequent to transferring ownership of the property. The tax capture may be incompatible with tax abatements and lot combinations that are otherwise available to the selected purchaser. DLBA will review requests to waive its tax capture rights and may require a payment in lieu of taxes to approve such requests. The payment will be determined upon reviewing the development proforma and effect of any tax abatements on the purchase and development financing. be determined upon reviewing the development proforma and effect of any tax abatements on the purchase and development.
-
2005-10-28historical
-
2005-07-29historical
-
2005-04-29$40,000
-
2005-04-29$54,900
-
2005-02-07historical
-
2004-08-07$54,900
ⓘ Source: listings_history table (triggers on properties + properties_extension) + one-shot
backfill from property_details.listing_events for pre-trigger history.
Tax reassessment forecast MI · Partial reset (capped growth)
- Current annual tax
- $240 · $20/mo
- Projected year-2 tax
- $240 · $20/mo
- Expected delta
- $0/yr ($0/mo · 0.0%)
ⓘ Screening estimate from a state-policy table — verify with the county assessor before closing.
Climate risk First Street
- Flood 1/10 Low FEMA zone X (unshaded) · 0% chance over 30 yrs
- Wildfire 1/10 Low
- Heat 3/10 Moderate 7 d/yr ≥97°F today · 15 d/yr by 30 yrs out
- Wind 2/10 Low
- Air quality 4/10 Moderate 4 unhealthy d/yr today · 6 by 30 yrs out
Nearby sold comps map
Loading sold comps map…
Walkable amenities ~0.75 mi
Loading nearby amenities…
Taxation est. · year 1
- Rental income
- $15,361
- − Mortgage interest
- −$672
- − Property taxes
- −$240
- − Insurance
- −$60
- − Repairs & maintenance
- −$1,229
- − Management
- −$1,229
- − Depreciation
- −$349
- Taxable income
- $11,582
- Est. tax owed @ 24.0%
- −$2,780
- After-tax cash flow
- $8,300/yr
For passive investors: Depreciation is non-cash, so a rental often shows a tax loss while cash-flowing — sheltering income. Rental losses are passive: they offset passive income freely, and up to $25,000/yr can offset ordinary (W-2) income if you actively participate and your MAGI is under $100k (phasing out to $0 by $150k); unused losses carry forward. On sale, claimed depreciation is recaptured at up to 25%, and gains may owe capital-gains tax (a 1031 exchange can defer both). Figures are a year-1 estimate at your 24.0% rate — not tax advice; consult a CPA.
Schools (NCES district)
- District
- Detroit Public Schools Community District
- NCES district ID
- 2601103
- Math proficiency
- 10% ▼ -2.00%
- Reading proficiency
- 24% ▲ 6.00%
- Median HH income
- $25,815
- Composite
- 13.06/100
- National rank
- #9564
- State rank
- #499 of 540 in MI
Livability — Detroit
- Score
- 73/100
- State rank
- #218
- US rank
- #5427
Category grades
Schools grade is shown separately in the Schools card above.
Census & demographics
- Census place
- Detroit, MI
- County
- Wayne County · 1,562,939 people
- City population
- 572,865
- Metro
- Detroit-Warren-Dearborn, MI
- Population (ZIP)
- 32,760
- Household income
- $35,322
- Rent vs Own
- Severe rent burden
- 2372.0
Population outlook (Wayne County) Hauer SSP2
- Today (2025)
- 1,675,273 people
- By 2030
- 1,620,300 · -3.3%
- By 2040
- 1,502,341 · -10.3%
- By 2050
- 1,384,039 · -17.4%
- By 2075
- 1,124,592 · -32.9%
- By 2100
- 881,193 · -47.4%
Race, ethnicity, and origin ACS 2023
- Neighborhood character
- Predominantly Black (94%)
- Race & ethnicity
- Black 94% White 3% Two or more races 1%
- Common ancestry
- Romanian 1%
- Foreign-born
- 2% · Canada, Vietnam, Philippines
- Languages at home
- 97% English-only · French/Haitian/Cajun 1%
Political lean MEDSL · Wayne
- 2024 margin
- Strong D (+29.0) · D 62.7% · R 33.7% · Other 3.6%
- 2008→2024 swing
- -20.5pp toward R · 2008: 49.5pp · 2024: 29.0pp
- All cycles
- 2024: D+29.0 2020: D+38.1 2016: D+37.3 2012: D+46.9 2008: D+49.5
Not yet ingested
- Civics
- —
Market trends
- HPI YoY
- ▼ -44.65%
- Current HPI
- 328.8978
- Rent YoY
- ▲ 6.72%
- Metro
- Detroit-Warren-Dearborn, MI
- State GDP YoY
- ▲ 1.37%
- F500 in state
- 28
Industry mix (Fortune 500 HQ in MI)
| Industry | F500 HQs | Revenue |
|---|---|---|
| Automotive Parts | 3 | $48B |
|
||
| Automotive | 2 | $372B |
|
||
| Chemicals | 1 | $45B |
|
||
| Automotive Retail | 1 | $29B |
|
||
| Healthcare / Medical Devices | 1 | $23B |
|
||
| Automotive Technology | 1 | $20B |
|
||
Price history
-78.1% since first listed8 events — show timeline
- 2024-10-07 Listed $12,000 MiRealSource-MiMLS
- 2024-10-07 Listed $12,000 REALCOMP
- 2005-10-28 Listing Removed — REALCOMP
- 2005-07-29 Listing Removed — MiRealSource-MiMLS
- 2005-04-29 Listed $54,900 MiRealSource-MiMLS
- 2005-04-29 Listed $40,000 REALCOMP
- 2005-02-07 Listing Removed — REALCOMP
- 2004-08-07 Listed $54,900 REALCOMP
Property tax history
+0.0%/yrLatest (2016): $240 · +0.0% YoY. Source: county tax records.
Cash-flow waterfall
monthlySold comps — $/sqft
last 12 mo · ≤1 miLoading sold comps…