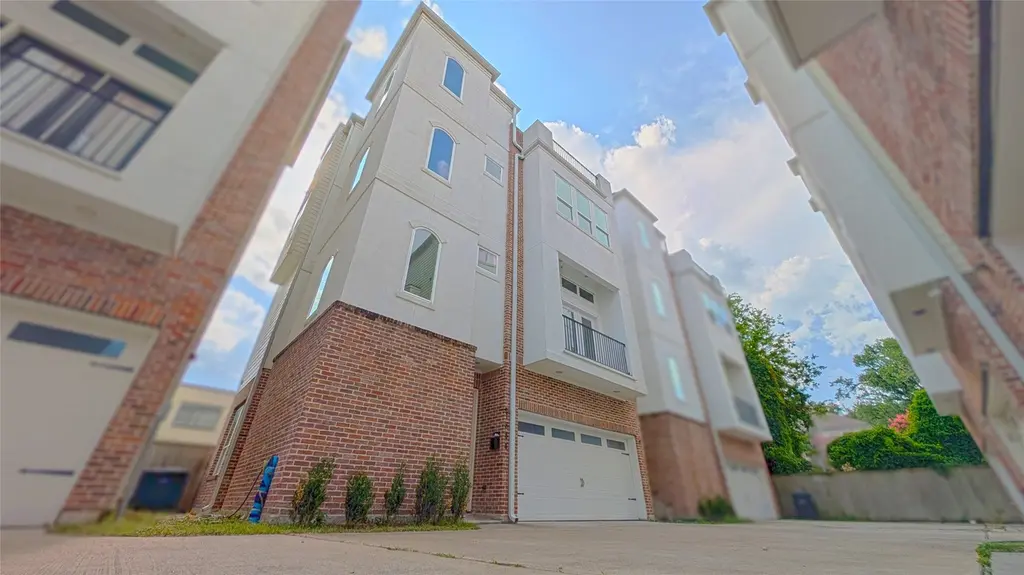
1844 Colquitt St · Houston, TX
Flood risk 7/10 · Major
- FEMA flood zone
- X (unshaded)
- Chance of flooding over 30 yrs
- 0.95%
- Est. flood insurance / yr
- $507 – $1,088
Fire risk 1/10 · Minimal
- Est. fire insurance / yr
- $1,222 – $2,270
Heat risk 9/10 · Severe
- Hot days now (above 109°F)
- 7 days/yr
- Hot days in 30 yrs
- 24 days/yr
Wind risk 9/10 · Severe
- Chance of severe wind over 30 yrs
- 99.0%
Air-quality risk 2/10 · Minimal
- Unhealthy air days now
- 2 days/yr
- Unhealthy air days in 30 yrs
- 2 days/yr
Risk factors via First Street. Map © Google.
Why this score? — see what drove the B- grade
The composite is a weighted blend of 9 inputs, each scored 0–100. Each bar is that input's sub-score; the figure is the points it added to the 100-point composite (weight × sub-score).
- Cash flow +26.8/30.0
- ARV discount +12.6/15.0
- DSCR +9.2/10.0
- 1% rule +8.4/10.0
- Livability +3.7/5.0
- Schools +2.7/10.0
- Condition / age +2.5/5.0
- Rent growth +2.2/5.0
- Appreciation +0.0/10.0
$625,000
🖨 Deal sheet 📄 Offer letter ✓ Due diligence
Listing remarks MLS
Welcome to this luxury 4-story residence in the coveted Montrose/Neartown neighborhood just minutes from Houston’s finest dining, shopping, cultural hotspots, and top-rated schools. This modern gem offers 4 bedrooms, 4.5 baths, and 2,960 sqft of contemporary living space, blending sleek design with top-tier finishes throughout. Gourmet chef’s kitchen, Expansive primary suite, Private en-suite bedrooms, Rooftop terrace including 2-car attached garage, sleek stucco and brick exterior, slab foundation, energy-efficient appliances, marble countertops, balcony, and a central vacuum system. This home masterfully balances urban sophistication with comfortable family living. Its multi-level layout offers defined spaces for both gathering and tranquil retreat. The rooftop terrace sets the stage for memorable moments—whether unwinding under the stars or hosting guests in style. Plus, it's located in one of Houston’s most vibrant, walkable neighborhoods. Come to see your next Home!
Key facts
- Rooftop terrace
- Marble countertops
- 1,594 sq ft lot
Tags
Neighborhood map
What this means for you Summary
Snapshot
- This is a 4-bed/4.5-bath single-family listed at $625k.
Deal economics
- At list price, monthly cash flow is $2k ($20k/yr) — positive.
- The deal already cash-flows at list — no discount required.
- Meets the 1% rule at list price ($8k rent vs $625k).
- Recommended offer: $588k (6.0% below list) — sets the bar for market timing.
- Cap rate 9.6% vs local median 3.2% in Houston — top-decile yield for the area; either an underpriced asset or a hidden risk that comps aren't pricing in. Stress-test before assuming the spread holds.
Location & tenants
- Location reads 74/100 on livability (#184 in TX, #4,771 nationally) — a middle-class / working-renter tenant base. Strengths: amenities A+, cost of living A+, housing A+; Watch: schools D, crime F.
- Houston ISD (urban): math 27% / reading 35% proficiency, ranked #593 of 826 in TX (top 72%) — families likely to look elsewhere, expect single-tenant / working-renter base with shorter leases; 71% free/reduced lunch — lower-income household profile, screen leases tightly.
- Market conditions: Rents soft (-1.1%/yr); 139 active listings in the ZIP; 28 comparable units currently listed for rent nearby; rentals at typical pace (median 14d on market — plan ~3-4 weeks tenant-placement turnaround); high-income renter base; 29,883 units permitted in Harris County in 2024 (8,621 in 5+ unit buildings).
- At $8,370/mo this rent would consume 86% of the median local household income ($117k/yr) (locally 1069% of renters already pay >50% of income on rent) — very limited rent-growth headroom before tenants either downsize or default.
Forward outlook
- Local home prices are declining (-3.0%/yr); year-one equity from $4k of loan paydown is wiped out by about $19k of value loss. Plan a longer hold.
- Harris County population projected at +47% by 2050 — long-run rental-demand tailwind backs the buy-and-hold thesis.
Negotiation context
- It's been on market 69 days — a 6% lower offer ($588k) is reasonable based on typical stale-listing flexibility.
- 14 sale attempts since 12y ago with the ask held roughly flat each time — persistent listings suggest the price (not the market) is what's stuck; bring a comps-based counter.
- Current owner paid $400k; list at $625k implies a 56% gain — meaningful room to come down on a strong offer.
Risks & watch-outs
- Watch-outs: property tax is 2.6% of price; flood insurance adds $66/mo.
- Climate carrying-cost: major flood risk; severe wind risk, 99% chance of damaging wind over 30y; extreme-heat days projected 7→24/yr by 2055 (HVAC capex compounding) — expect insurance premiums to compound above CPI over the hold.
Questions for the listing agent
- It's been on market 69 days. Have you received any prior offers? Is the seller open to a 6% concession, seller financing, or rate buy-down credit?
- Property tax is high relative to price — has the assessment been appealed recently, and will the sale trigger a re-assessment?
- What's the actual annual flood-insurance premium (NFIP or private), and is the property in a SFHA with mandatory coverage?
- Why hasn't it sold? Are there any deal-killer items the seller is aware of (foundation, flood, title, zoning, code violations)?
- Is there a deadline driving the sale (1031 exchange, divorce, estate, relocation)? That informs how much negotiation room exists.
- Schools are D-rated, which usually means shorter tenancies and higher turnover. Who's the typical renter profile here, and what's been the actual vacancy rate?
- Crime grade is F in this area — have there been break-ins, vandalism, or insurance claims at this property in the last 3 years? What carrier currently insures it and at what premium?
- What's the average days-on-market for RENTAL listings here right now (not sales)? A rising rental-DOM trend means longer vacancies and softer asking-rent achievability than the comps imply.
- What's the recent tenant-quality profile in this submarket — average credit score on applications, eviction rate, late-payment / NSF rate, and stable-employment percentage? A property-management company in the area should have these aggregated.
- How much new for-sale + rental construction is in the pipeline within 1–3 miles? Heavy new supply typically softens prices + rents 12–24 months out; constrained supply supports both.
Investment metrics
- 1% rule
- 1.34% ✓
- Cap rate
- 9.57%
- Cash-on-cash
- 11.71%
- DSCR
- 1.52
- GRM
- 6.2
CMA / ARV
- ARV (median comp)
- $705,049
- List price
- $625,000
- Delta
- -11.35%
- Verdict
- UNDERPRICED
- Comps
- 20 within 1.0 mi
Show comp detail 12 sales within ~0.75 mi
| Address | Dist | Beds/Ba | Sqft | Sold | Price | $/sf | Match |
|---|---|---|---|---|---|---|---|
| 1927 South Blvd | 0.62mi | 4/3.0 | 2,938 (-1%) | 0mo | $1,690,000 | $575 | 64 |
| 1925 Banks St | 0.41mi | 3/3.0 (-1) | 3,108 (+5%) | 1mo | $1,515,000 | $487 | 61 |
| 2206 Sul Ross St | 0.44mi | 4/3.5 | 2,684 (-9%) | 1mo | $1,200,000 | $447 | 59 |
| 2628 Peckham St | 0.53mi | 4/3.5 | 3,154 (+7%) | 2mo | $1,129,900 | $358 | 59 |
| 1736 Colquitt St Unit A | 0.19mi | 4/2.5 | 2,523 (-15%) | 0mo | $655,000 | $260 | 58 |
| 2643 Westgate St | 0.62mi | 3/3.5 (-1) | 3,060 (+3%) | 3mo | $719,000 | $235 | 54 |
| 1307 Marshall St | 0.73mi | 3/4.0 (-1) | 2,866 (-3%) | 0mo | $1,149,000 | $401 | 53 |
| 1312 Castle Ct Unit B | 0.69mi | 4/3.5 | 3,154 (+7%) | 1mo | $1,079,900 | $342 | 52 |
| 4504 Yupon St | 0.60mi | 3/3.5 (-1) | 2,790 (-6%) | 3mo | $765,000 | $274 | 51 |
| 2124 Sul Ross St | 0.36mi | 3/2.5 (-1) | 2,645 (-11%) | 2mo | $1,275,000 | $482 | 50 |
| 1817 Kipling St | 0.34mi | 3/2.5 (-1) | 2,552 (-14%) | 1mo | $1,149,000 | $450 | 47 |
| 1905 Bissonnet St | 0.68mi | 3/3.5 (-1) | 2,639 (-11%) | 1mo | $888,000 | $336 | 40 |
Match score weights: distance 35% · size 25% · config 20% · recency 20%. Top-matched comps best support the ARV.
Projected returns pro-forma
-3.0% appreciation · 0.0% rent growth · sell at horizon
- IRR
- -3.3%
- Equity multiple
- 0.88×
- Total profit
- $-20,719
- Equity at exit
- $93,190
- IRR
- 2.3%
- Equity multiple
- 1.14×
- Total profit
- $23,943
- Equity at exit
- $54,039
Cash invested: $175,000 (down + closing). Projections, not guarantees.
Landlord ↔ Tenant lean methodology
- Overall (STATE)
- 87 Strongly Landlord-Friendly
- State Texas
- 87 Strongly Landlord-Friendly · R+5
- County
- — inherits STATE
- City
- — inherits STATE
ZIP-level market 77098
- Rents YoY
- -1.1%
- Active inventory
- 139
- Price-to-rent
- 6.2×
Monthly cashflow live
- Estimated rent
- $8,370 high interval (Pro) →
- Mortgage (P&I)
- −$3,278
- Tax from tax record
- −$1,366 /mo · $16,390/yr
- Insurance
- −$260
- Flood insurance flood zone
- −$66 /mo · $798/yr
- HOA
- −$0
- Vacancy / Maint / Mgmt
- −$1,758
- Net cashflow
- $1,642
Break-even live
UW: 25.0% down · 7.5% · 30yr · 1.5% tax · 5.0% vac · 8.0% maint · 8.0% mgmt
Financing live
Cash to close
- Down payment
- $156,250
- Closing costs
- $18,750
- Reserves months
- —
- Total cash needed
- —
Loan-product check · same deal, 3 products live
Conventional
25% down · 7.5% · 30yr
- Down + closing
- —
- Monthly P&I
- —
- Monthly cashflow
- —
- DSCR
- —
- Eligible?
- —
Personal DTI + credit; lowest rate.
DSCR
20% down · 8.5% · 30yr
- Down + closing
- —
- Monthly P&I
- —
- Monthly cashflow
- —
- DSCR
- —
- Eligible?
- —
No personal income docs; deal must DSCR.
Hard money
10% down · 12.0% · 12mo
- Down + closing
- —
- Monthly P&I
- —
- Monthly cashflow
- —
- DSCR
- —
- Eligible?
- —
Short-term bridge; refi at stabilization.
Rent comps 28 comps
| Address | Beds | Baths | Sqft | Rent | $/sqft | DOM | Units | Dist |
|---|---|---|---|---|---|---|---|---|
| 2025 Colquitt St Unit 1257741P Houston, TX | 3.0 | 3.5 | 2594 | $7,405 | $2.85 | 44d | 1 | 0.12mi |
| 2243 W Alabama St Houston, TX | 3.0 | 3.0 | 1998 | $2,440 | $1.22 | 44d | 1 | 0.50mi |
| 1924 Fairview Ave Houston, TX | 3.0 | 3.5 | 2830 | $9,750 | $3.45 | 44d | 1 | 0.70mi |
| 2323 Woodhead St Unit 1019542P Houston, TX | 3.0 | 3.5 | 2820 | $15,722 | $5.58 | 24d | 1 | 0.70mi |
| 2311 Westheimer Rd Houston, TX | 1.0–3.0 | 1.0–3.0 | 1489 | $13,862 | $9.31 | 2d | 14 | 0.72mi |
| 3333 Lake St Unit 510 Houston, TX | 3.0 | 2.0 | 2650 | $10,458 | $3.95 | 11d | 1 | 0.73mi |
| 3333 Lake St Unit 3165 Houston, TX | 3.0 | 2.0 | 2650 | $10,426 | $3.93 | 3d | 1 | 0.73mi |
| 2651 Kipling St Unit 3165 Houston, TX | 3.0 | 2.0 | 2739 | $11,460 | $4.18 | 3d | 1 | 0.82mi |
| 2508 South Blvd Houston, TX | 3.0 | 4.0 | 2514 | $3,600 | $1.43 | 24d | 1 | 0.84mi |
| 2651 Kipling St Unit 510 Houston, TX | 3.0 | 2.0 | 2739 | $11,492 | $4.20 | 11d | 1 | 0.85mi |
| 2719 Kipling St Unit B Houston, TX | 3.0 | 3.5 | 2184 | $4,400 | $2.01 | 44d | 1 | 0.89mi |
| 2024 Welch St Houston, TX | 3.0 | 4.0 | 2294 | $2,800 | $1.22 | 44d | 1 | 0.93mi |
| 3411 Yoakum Blvd Unit 3165 Houston, TX | 3.0 | 2.0 | 3110 | $12,272 | $3.95 | 3d | 1 | 1.00mi |
| 3411 Yoakum Blvd Unit 510 Houston, TX | 3.0 | 2.0 | 3110 | $12,304 | $3.96 | 11d | 1 | 1.00mi |
| 4899 Montrose Blvd Houston, TX | 1.0–3.0 | 1.0–2.5 | 2704 | $10,080 | $3.73 | 44d | 10 | 1.05mi |
| 2205 Commonwealth St Houston, TX | 4.0 | 4.0 | 2513 | $3,300 | $1.31 | 44d | 1 | 1.11mi |
| 1326 Fairview Ave Houston, TX | 3.0 | 3.0 | 2176 | $3,250 | $1.49 | 44d | 1 | 1.16mi |
| 5122 Morningside Dr Unit 3187 Houston, TX | 3.0 | 2.0 | 3059 | $12,477 | $4.08 | 3d | 1 | 1.18mi |
| 2421 Tangley St Houston, TX | 3.0 | 3.0 | 2633 | $8,323 | $3.16 | 24d | 1 | 1.19mi |
| 5122 Morningside Dr Unit 510 Houston, TX | 3.0 | 2.0 | 3059 | $12,509 | $4.09 | 11d | 1 | 1.19mi |
| 1958 W Gray St Unit 1991 Houston, TX | 3.0 | 2.0 | 3206 | $15,050 | $4.69 | 11d | 1 | 1.28mi |
| 1958 W Gray St Unit 3165 Houston, TX | 3.0 | 2.0 | 3206 | $15,018 | $4.68 | 3d | 1 | 1.28mi |
| 5280 Caroline St Houston, TX | 1.0–3.0 | 1.0–3.5 | 1880 | $6,216 | $3.31 | 2d | 20 | 1.42mi |
| 420 Hawthorne St Houston, TX | 4.0 | 2.0 | 2230 | $3,373 | $1.51 | 44d | 1 | 1.44mi |
| 1216 Rosedale St Houston, TX | 3.0 | 3.5 | 2584 | $3,250 | $1.26 | 14d | 1 | 1.45mi |
| 1216 Rosedale St Houston, TX | 3.0 | 3.5 | 2584 | $3,250 | $1.26 | 13d | 1 | 1.45mi |
| 1027 Gross St Houston, TX | 4.0 | 3.5 | 3035 | $5,800 | $1.91 | 44d | 1 | 1.48mi |
| 414 Hyde Park Blvd Houston, TX | 3.0 | 3.5 | 2300 | $5,400 | $2.35 | 5d | 1 | 1.49mi |
Listing history 47 events
-
2026-06-18days on market $625,000 Active 69 DOM
-
2026-06-17days on market $625,000 Active 68 DOM
-
2026-06-16days on market $625,000 Active 67 DOM
-
2026-06-15days on market $625,000 Active 66 DOM
-
2026-06-13days on market $625,000 Active 64 DOM
-
2026-06-10pricedays on market $625,000 Active 60 DOM
-
2026-06-08days on market $629,990 Active 59 DOM
-
2026-06-07days on market $629,990 Active 58 DOM
-
2026-06-04pricedays on market $629,990 Active 55 DOM
-
2026-06-01days on market $635,000 Active 52 DOM
-
2026-05-31days on market $635,000 Active 51 DOM
-
2026-04-10$635,000 Active 1014-char remark
Show marketing remark (1014 chars)
Welcome to this luxury 4-story residence in the coveted Montrose/Neartown neighborhood just minutes from Houston’s finest dining, shopping, cultural hotspots, and top-rated schools. This modern gem offers 4 bedrooms, 4.5 baths, and 2,960 sqft of contemporary living space, blending sleek design with top-tier finishes throughout. Gourmet chef’s kitchen, Expansive primary suite, Private en-suite bedrooms, Rooftop terrace including 2-car attached garage, sleek stucco and brick exterior, slab foundation, energy-efficient appliances, marble countertops, balcony, and a central vacuum system. This home masterfully balances urban sophistication with comfortable family living. Its multi-level layout offers defined spaces for both gathering and tranquil retreat. The rooftop terrace sets the stage for memorable moments—whether unwinding under the stars or hosting guests in style. Plus, it's located in one of Houston’s most vibrant, walkable neighborhoods. Come to see your next Home!
-
2026-04-05historical
-
2026-03-05historical $3,700
-
2026-02-16price $650,000
-
2026-01-31status Active
-
2025-12-25historical
-
2025-10-28$3,700
-
2025-10-27$670,000 Active
-
2025-10-23historical $4,000
-
2025-10-22historical
-
2025-08-22$4,000
-
2025-08-08$680,000 Active
-
2025-08-05historical
-
2025-06-11$689,900 Active
-
2025-06-02historical
-
2025-05-16$749,995 Active
-
2023-04-14historical
-
2023-03-02$659,000 Active
-
2023-02-17historical
-
2023-02-12price $655,000
-
2023-02-12status Active
-
2023-01-31historical
-
2022-11-07price $633,000
-
2022-11-06status Active
-
2022-08-16historical
-
2022-07-20price $655,000
-
2022-07-01$675,000 Active
-
2022-06-18historical
-
2022-06-09price $699,999
-
2022-05-21$710,000 Active
-
2022-03-17soldstatus
-
2022-03-17soldstatus
-
2022-02-02soldstatus $400,000
-
2021-10-28soldstatus $4,000,000
-
2016-03-22historical
-
2014-08-01$785,000 Active
ⓘ Source: listings_history table (triggers on properties + properties_extension) + one-shot
backfill from property_details.listing_events for pre-trigger history.
Tax reassessment forecast TX · Resets to sale price
- Current annual tax
- $16,390 · $1,366/mo
- Projected year-2 tax
- $16,390 · $1,366/mo
- Expected delta
- $0/yr ($0/mo · 0.0%)
ⓘ Screening estimate from a state-policy table — verify with the county assessor before closing.
Climate risk First Street
- Flood 7/10 Severe FEMA zone X (unshaded) · 95% chance over 30 yrs
- Wildfire 1/10 Low
- Heat 9/10 Extreme 7 d/yr ≥109°F today · 24 d/yr by 30 yrs out
- Wind 9/10 Extreme 99% chance of damaging wind over 30 yrs
- Air quality 2/10 Low 2 unhealthy d/yr today · 2 by 30 yrs out
Nearby sold comps map
Loading sold comps map…
Walkable amenities ~0.75 mi
Loading nearby amenities…
Taxation est. · year 1
- Rental income
- $100,435
- − Mortgage interest
- −$35,010
- − Property taxes
- −$16,390
- − Insurance
- −$3,922
- − Repairs & maintenance
- −$8,035
- − Management
- −$8,035
- − Depreciation
- −$18,182
- Taxable income
- $10,861
- Est. tax owed @ 24.0%
- −$2,607
- After-tax cash flow
- $17,093/yr
For passive investors: Depreciation is non-cash, so a rental often shows a tax loss while cash-flowing — sheltering income. Rental losses are passive: they offset passive income freely, and up to $25,000/yr can offset ordinary (W-2) income if you actively participate and your MAGI is under $100k (phasing out to $0 by $150k); unused losses carry forward. On sale, claimed depreciation is recaptured at up to 25%, and gains may owe capital-gains tax (a 1031 exchange can defer both). Figures are a year-1 estimate at your 24.0% rate — not tax advice; consult a CPA.
Schools (NCES district)
- District
- Houston ISD
- NCES district ID
- 4823640
- Math proficiency
- 27% ▼ -18.00%
- Reading proficiency
- 35% ▼ -6.00%
- Median HH income
- $46,054
- Composite
- 26.63/100
- National rank
- #7173
- State rank
- #593 of 826 in TX
Livability — Houston
- Score
- 74/100
- State rank
- #184
- US rank
- #4771
Category grades
Schools grade is shown separately in the Schools card above.
Census & demographics
- Census place
- Houston, TX
- County
- Harris County · 4,702,590 people
- City population
- 3,226,434
- Metro
- Houston-The Woodlands-Sugar Land, TX
- Population (ZIP)
- 17,210
- Household income
- $116,650
- Rent vs Own
- Severe rent burden
- 1069.0
Population outlook (Harris County) Hauer SSP2
- Today (2025)
- 5,571,493 people
- By 2030
- 6,089,821 · +9.3%
- By 2040
- 7,142,806 · +28.2%
- By 2050
- 8,185,864 · +46.9%
- By 2075
- 10,574,329 · +89.8%
- By 2100
- 12,109,958 · +117.4%
Race, ethnicity, and origin ACS 2023
- Neighborhood character
- Diverse neighborhood (Simpson 0.57)
- Race & ethnicity
- White 63% Hispanic / Latino 15% Asian 12% Two or more races 12% Black 6% Native American 2%
- Hispanic origin (detail)
- Mexican 9%
- Common ancestry
- Lithuanian 7% Romanian 5% Iranian 3%
- Foreign-born
- 21% · Canada, China, South Korea
- Languages at home
- 74% English-only · Spanish 9% Chinese 4% Other Asian/Pacific 3%
Political lean MEDSL · Harris
- 2024 margin
- Lean D (+5.5) · D 52.0% · R 46.4% · Other 1.6%
- 2008→2024 swing
- +3.9pp toward D · 2008: 1.6pp · 2024: 5.5pp
- All cycles
- 2024: D+5.5 2020: D+13.3 2016: D+12.4 2012: D+0.1 2008: D+1.6
Not yet ingested
- Civics
- —
Market trends
- HPI YoY
- ▼ -132.17%
- Current HPI
- 219.3437
- Rent YoY
- ▼ -1.13%
- Metro
- Houston-The Woodlands-Sugar Land, TX
- State GDP YoY
- ▲ 3.95%
- F500 in state
- 110
Industry mix (Fortune 500 HQ in TX)
| Industry | F500 HQs | Revenue |
|---|---|---|
| Energy | 16 | $1,198B |
|
||
| Technology | 5 | $198B |
|
||
| Engineering / Construction | 4 | $72B |
|
||
| Energy Services | 3 | $60B |
|
||
| Utilities | 3 | $41B |
|
||
| Healthcare | 2 | $330B |
|
||
Price history
-19.1% since first listed36 events — show timeline
- 2026-04-10 Listed $635,000 HARMLS
- 2026-04-05 Listing Removed — HARMLS
- 2026-03-05 Rental Removed $3,700 HARMLS
- 2026-02-16 Price Changed $650,000 HARMLS
- 2026-01-31 Relisted — HARMLS
- 2025-12-25 Listing Removed — HARMLS
- 2025-10-28 Listed for Rent $3,700 HARMLS
- 2025-10-27 Listed $670,000 HARMLS
- 2025-10-23 Rental Removed $4,000 HARMLS
- 2025-10-22 Listing Removed — HARMLS
- 2025-08-22 Listed for Rent $4,000 HARMLS
- 2025-08-08 Listed $680,000 HARMLS
- 2025-08-05 Listing Removed — HARMLS
- 2025-06-11 Listed $689,900 HARMLS
- 2025-06-02 Listing Removed — HARMLS
- 2025-05-16 Listed $749,995 HARMLS
- 2023-04-14 Listing Removed — HARMLS
- 2023-03-02 Listed $659,000 HARMLS
- 2023-02-17 Listing Removed — HARMLS
- 2023-02-12 Price Changed $655,000 HARMLS
- 2023-02-12 Relisted — HARMLS
- 2023-01-31 Listing Removed — HARMLS
- 2022-11-07 Price Changed $633,000 HARMLS
- 2022-11-06 Relisted — HARMLS
- 2022-08-16 Listing Removed — HARMLS
- 2022-07-20 Price Changed $655,000 HARMLS
- 2022-07-01 Listed $675,000 HARMLS
- 2022-06-18 Listing Removed — HARMLS
- 2022-06-09 Price Changed $699,999 HARMLS
- 2022-05-21 Listed $710,000 HARMLS
- 2022-03-17 Sold (Public Records) — Public Records
- 2022-03-17 Sold (Public Records) — Public Records
- 2022-02-02 Sold (Public Records) $400,000 Public Records
- 2021-10-28 Sold (Public Records) $4,000,000 Public Records
- 2016-03-22 Listing Removed — HARMLS
- 2014-08-01 Listed $785,000 HARMLS
Property tax history
+3.5%/yrLatest (2025): $16,390 · +21.9% YoY. Source: county tax records.
Cash-flow waterfall
monthlySold comps — $/sqft
last 12 mo · ≤1 miLoading sold comps…