 8-Plex
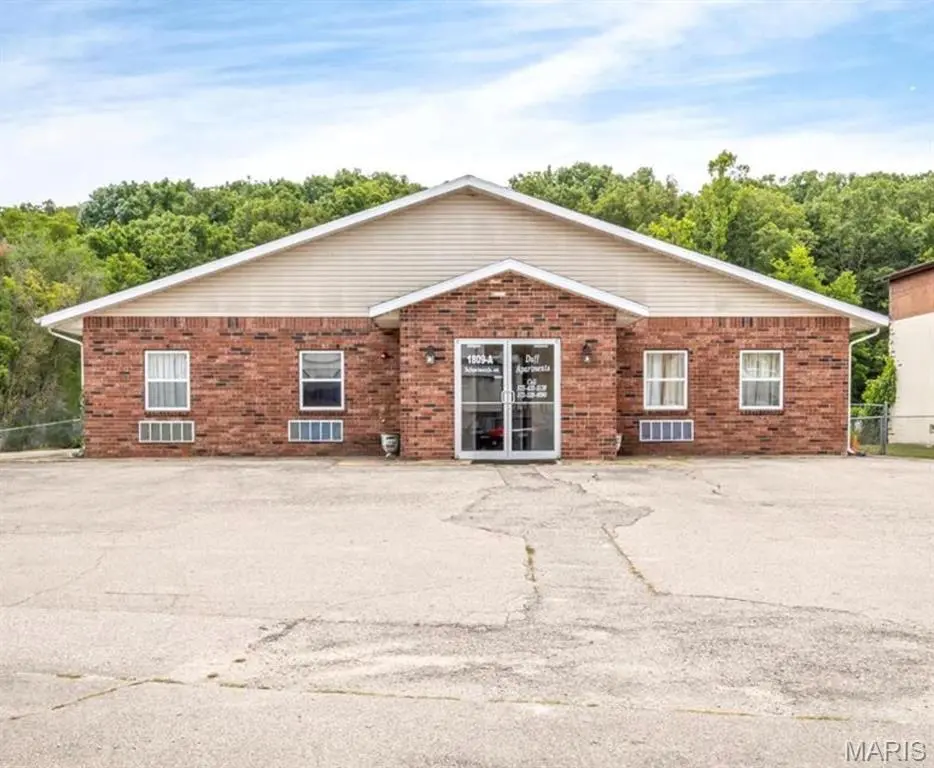
1809A Historic 66 · Waynesville, MO
Flood risk 4/10 · Minor
- FEMA flood zone
- AE
- Chance of flooding over 30 yrs
- 0.22%
- Est. flood insurance / yr
- $1,737 – $8,500
Fire risk 4/10 · Minor
- Est. fire insurance / yr
- $1,054 – $1,958
Heat risk 5/10 · Moderate
- Hot days now (above 107°F)
- 7 days/yr
- Hot days in 30 yrs
- 19 days/yr
Wind risk 2/10 · Minimal
- Chance of severe wind over 30 yrs
- 1.0%
Air-quality risk 1/10 · Minimal
- Unhealthy air days now
- 0 days/yr
- Unhealthy air days in 30 yrs
- 0 days/yr
Risk factors via First Street. Map © Google.
Why this score? — see what drove the B grade
The composite is a weighted blend of 9 inputs, each scored 0–100. Each bar is that input's sub-score; the figure is the points it added to the 100-point composite (weight × sub-score).
- Cash flow +30.0/30.0
- DSCR +10.0/10.0
- 1% rule +7.9/10.0
- ARV discount +7.5/15.0
- Rent growth +5.0/5.0
- Schools +4.2/10.0
- Condition / age +4.0/5.0
- Livability +3.2/5.0
- Appreciation +0.0/10.0
$879,900
🖨 Deal sheet 📄 Offer letter ✓ Due diligence
Multi-family units
County records classify this as Multi-Family (5+ Unit). Listing-text estimate: 8 units. confirmed
5+ unit building — per-unit beds/baths from public records are typically unavailable; the breakdown below (if shown) is an estimate from the listing text.
Listing remarks
GREAT INVESTMENT OPPORTUNITY-Just minutes away from Fort Leonard Wood, this 8 unit apartment building comes completely Fully Furnished, and move-in ready. This property consists of 5 one bedroom units, and 3 Studio apartments with secure front entry. Each apartment comes with updated kitchens, Large full bathrooms, Wood Floors, and updated appliances. Apartment building sits on 1.01 acres. Tenants need 24 hours notice before showing. Brand new roof and on-site Washer and Dryer.
Key facts
- 1.01 acre lot
- Built 1998
- Listed 89 days
Property features AI
Finance
- Financial info: Property listed as residential income; Eight total units in one building; all eight units are leased
- HOA & community: Community features include park and other shared amenities
Exterior
- Parking: On-site paved parking lot with additional private parking; asphalt surfaces; outdoor/off-street parking
- Security: Fire alarm; Fire sprinkler system
- Utilities: Public water
- Home design: Multi-family property (5 family or more); One story; Updated/remodeled
- Construction: Brick and vinyl siding with other construction materials; Architectural shingle roof
- Exterior features: Private yard; Courtyard and uncovered courtyard; Outdoor grill / barbecue; Dog run; Partial and privacy fencing (chain link, partial cross, security); Park nearby
Interior
- Kitchen: Electric cooktop; Electric oven; Microwave; Dishwasher; Disposal; Refrigerator
- Bedrooms: Eight 1-bedroom units
- Bathrooms: Eight bathrooms (one per unit)
- Heating & cooling: Forced air heating; Wall unit(s) for cooling
- Interior features: Updated/remodeled residential income property; Private entrances for units; No-step entry; Fire alarm; Fire sprinkler system
- Laundry & utility: Electric water heater
Neighborhood map
What this means for you Summary
Snapshot
- This is a 8 × 8-bed/64.0-bath units multifamily listed at $880k. Condition is rated good.
Deal economics
- At list price, monthly cash flow is $3k ($39k/yr) — positive. Per door: $403/mo.
- The deal already cash-flows at list — no discount required.
- Meets the 1% rule at list price ($11k rent vs $880k).
- Recommended offer: $827k (6.0% below list) — sets the bar for market timing.
- Cap rate 11.3% vs local median 4.0% in Waynesville — top-decile yield for the area; either an underpriced asset or a hidden risk that comps aren't pricing in. Stress-test before assuming the spread holds.
Location & tenants
- Location reads 64/100 on livability (#322 in MO) — a middle-class / working-renter tenant base. Strengths: cost of living A+, housing A+; Watch: crime C-, amenities F, commute F.
- Waynesville R-VI (town): math 46% / reading 53% proficiency, ranked #41 of 324 in MO (top 13%) — families likely to look elsewhere, expect single-tenant / working-renter base with shorter leases.
- Zoned schools: Waynesville East Elem. (math 51% / reading 53%, grade C-, #231 of 1,115 statewide, top 24%, 929 students, 44% FRL); Waynesville Sr. High (math 37% / reading 53%, grade D-, #176 of 521 statewide, top 34%, 1,704 students, 39% FRL).
- Market conditions: Rents rising fast (+10.3%/yr); 156 active listings in the ZIP; solid renter incomes; 62 units permitted in Pulaski County in 2024 (0 in 5+ unit buildings).
- At $11,312/mo this rent would consume 177% of the median local household income ($77k/yr) (locally 185% of renters already pay >50% of income on rent) — very limited rent-growth headroom before tenants either downsize or default.
Forward outlook
- Local home prices are declining (-3.0%/yr); year-one equity from $6k of loan paydown is wiped out by about $26k of value loss. Plan a longer hold.
- At projected returns (-3.0% appreciation + 8.0% rent growth), your $246k cash investment doubles in ~6 years — after that, you're playing with house money.
Negotiation context
- It's been on market 90 days — a 6% lower offer ($827k) is reasonable based on typical stale-listing flexibility.
Risks & watch-outs
- Watch-outs: flood insurance adds $427/mo.
- Climate carrying-cost: in FEMA flood zone AE (mandatory federal flood insurance); extreme-heat days projected 7→19/yr by 2055 (HVAC capex compounding) — expect insurance premiums to compound above CPI over the hold.
Questions for the listing agent
- It's been on market 90 days. Have you received any prior offers? Is the seller open to a 6% concession, seller financing, or rate buy-down credit?
- Can we see the unit-by-unit rent roll, current vacancy, and any below-market leases? What's the average tenancy length?
- What capital expenditures (roof, boiler, parking lot, exteriors) have been made in the last 5 years, and what's planned in the next 2?
- What's the actual annual flood-insurance premium (NFIP or private), and is the property in a SFHA with mandatory coverage?
- Why hasn't it sold? Are there any deal-killer items the seller is aware of (foundation, flood, title, zoning, code violations)?
- Is there a deadline driving the sale (1031 exchange, divorce, estate, relocation)? That informs how much negotiation room exists.
- Schools are B-rated — typically a magnet for longer-tenancy family renters. What's the average tenant stay here, and is there a school-zone premium baked into asking?
- What's the average days-on-market for RENTAL listings here right now (not sales)? A rising rental-DOM trend means longer vacancies and softer asking-rent achievability than the comps imply.
- What's the recent tenant-quality profile in this submarket — average credit score on applications, eviction rate, late-payment / NSF rate, and stable-employment percentage? A property-management company in the area should have these aggregated.
- How much new apartment / multifamily construction is in the pipeline within 1–3 miles? Heavy new supply (>2% of stock underway) typically softens rents 12–24 months out; light construction supports rent growth.
Investment metrics
- 1% rule
- 1.29% ✓
- Cap rate
- 11.27%
- Cash-on-cash
- 17.78%
- DSCR
- 1.79
- GRM
- 6.5
CMA / ARV
No comps found within radius.
Projected returns pro-forma
-3.0% appreciation · 8.0% rent growth · sell at horizon
- IRR
- 11.8%
- Equity multiple
- 1.50×
- Total profit
- $122,447
- Equity at exit
- $131,196
- IRR
- 24.4%
- Equity multiple
- 3.61×
- Total profit
- $642,849
- Equity at exit
- $76,078
Cash invested: $246,372 (down + closing). Projections, not guarantees.
Landlord ↔ Tenant lean methodology
- Overall (STATE)
- 81 Strongly Landlord-Friendly
- State Missouri
- 81 Strongly Landlord-Friendly · R+10
- County
- — inherits STATE
- City
- — inherits STATE
ZIP-level market 65583
- Home prices YoY
- -27.3%
- Rents YoY
- 10.3%
- Active inventory
- 156
- Price-to-rent
- 51.9×
Monthly cashflow live
- Estimated rent
- $11,312 medium interval (Pro) →
- Mortgage (P&I)
- −$4,614
- Tax from tax record
- −$306 /mo · $3,667/yr
- Insurance
- −$367
- Flood insurance flood zone
- −$427 /mo · $5,118/yr
- HOA
- −$0
- Vacancy / Maint / Mgmt
- −$2,376
- Net cashflow
- $3,223
Break-even live
8-unit breakdown (identical units grouped — click to expand)
| Units | Beds | Baths | Est. rent |
|---|---|---|---|
| 8× units | 8 | 64 | $11,312 |
| #1 | 8 | 64 | $1,414 |
| #2 | 8 | 64 | $1,414 |
| #3 | 8 | 64 | $1,414 |
| #4 | 8 | 64 | $1,414 |
| #5 | 8 | 64 | $1,414 |
| #6 | 8 | 64 | $1,414 |
| #7 | 8 | 64 | $1,414 |
| #8 | 8 | 64 | $1,414 |
| Total (8 units) | $11,312 | ||
UW: 25.0% down · 7.5% · 30yr · 1.5% tax · 5.0% vac · 8.0% maint · 8.0% mgmt
Financing live
Cash to close
- Down payment
- $219,975
- Closing costs
- $26,397
- Reserves months
- —
- Total cash needed
- —
Loan-product check · same deal, 3 products live
Conventional
25% down · 7.5% · 30yr
- Down + closing
- —
- Monthly P&I
- —
- Monthly cashflow
- —
- DSCR
- —
- Eligible?
- —
Personal DTI + credit; lowest rate.
DSCR
20% down · 8.5% · 30yr
- Down + closing
- —
- Monthly P&I
- —
- Monthly cashflow
- —
- DSCR
- —
- Eligible?
- —
No personal income docs; deal must DSCR.
Hard money
10% down · 12.0% · 12mo
- Down + closing
- —
- Monthly P&I
- —
- Monthly cashflow
- —
- DSCR
- —
- Eligible?
- —
Short-term bridge; refi at stabilization.
Listing history 18 events
-
2026-06-19days on market $879,900 Active 90 DOM
-
2026-06-18days on market $879,900 Active 89 DOM
-
2026-06-17days on market $879,900 Active 88 DOM
-
2026-06-16days on market $879,900 Active 87 DOM
-
2026-06-15days on market $879,900 Active 86 DOM
-
2026-06-14days on market $879,900 Active 84 DOM
-
2026-06-12days on market $879,900 Active 83 DOM
-
2026-06-09days on market $879,900 Active 80 DOM
-
2026-06-08days on market $879,900 Active 79 DOM
-
2026-06-07days on market $879,900 Active 78 DOM
-
2026-06-07days on market $879,900 Active 77 DOM
-
2026-06-02days on market $879,900 Active 73 DOM
-
2026-06-01price $879,900 Active 72 DOM
-
2026-06-01days on market $899,900 Active 72 DOM
-
2026-05-31days on market $899,900 Active 71 DOM
-
2026-05-30days on market $899,900 Active 70 DOM
-
2026-03-22$899,900 Active
-
2026-03-19historical $899,900
ⓘ Source: listings_history table (triggers on properties + properties_extension) + one-shot
backfill from property_details.listing_events for pre-trigger history.
Tax reassessment forecast MO · Resets to sale price
- Current annual tax
- $3,667 · $306/mo
- Projected year-2 tax
- $8,535 · $711/mo
- Expected delta
- +$4,868/yr (+$406/mo · 132.8%)
ⓘ Screening estimate from a state-policy table — verify with the county assessor before closing.
Climate risk First Street
- Flood 4/10 Moderate FEMA zone AE · 22% chance over 30 yrs
- Wildfire 4/10 Moderate
- Heat 5/10 Major 7 d/yr ≥107°F today · 19 d/yr by 30 yrs out
- Wind 2/10 Low 100% chance of damaging wind over 30 yrs
- Air quality 1/10 Low 0 unhealthy d/yr today · 0 by 30 yrs out
Nearby sold comps map
Loading sold comps map…
Walkable amenities ~0.75 mi
Loading nearby amenities…
Taxation est. · year 1
- Rental income
- $135,744
- − Mortgage interest
- −$49,288
- − Property taxes
- −$3,667
- − Insurance
- −$9,518
- − Repairs & maintenance
- −$10,860
- − Management
- −$10,860
- − Depreciation
- −$25,597
- Taxable income
- $25,955
- Est. tax owed @ 24.0%
- −$6,229
- After-tax cash flow
- $32,452/yr
For passive investors: Depreciation is non-cash, so a rental often shows a tax loss while cash-flowing — sheltering income. Rental losses are passive: they offset passive income freely, and up to $25,000/yr can offset ordinary (W-2) income if you actively participate and your MAGI is under $100k (phasing out to $0 by $150k); unused losses carry forward. On sale, claimed depreciation is recaptured at up to 25%, and gains may owe capital-gains tax (a 1031 exchange can defer both). Figures are a year-1 estimate at your 24.0% rate — not tax advice; consult a CPA.
Condition & rehab AI · 12 photos
This fully furnished and move-in ready 8-unit apartment building is in excellent condition with no visible repairs needed. It offers a great investment opportunity with potential for minor cosmetic updates to further enhance its value.
Value-add opportunities
- Both Painting exterior and interior walls — Fresh paint enhances curb appeal and interior aesthetics
- Both Updating flooring in common areas — New flooring can improve the overall look and feel of the property
- Both Upgrading appliances in kitchens and bathrooms — Modern appliances can attract more tenants and buyers
- Both Landscaping improvements — Enhanced landscaping can increase curb appeal and property value
Renovation cost estimate screening
Value-add ROI direction
- Both Painting exterior and interior walls — Fresh paint enhances curb appeal and interior aesthetics ↑
- Both Updating flooring in common areas — New flooring can improve the overall look and feel of the property ↑
- Both Upgrading appliances in kitchens and bathrooms — Modern appliances can attract more tenants and buyers ↑
- Both Landscaping improvements — Enhanced landscaping can increase curb appeal and property value ↑
ⓘ Cost ranges are severity-bucket heuristics (US national rule-of-thumb). Get contractor quotes + a written scope before underwriting a rehab budget.
Schools (NCES district)
- District
- Waynesville R-VI
- NCES district ID
- 2931440
- Math proficiency
- 46% ▼ -1.00%
- Reading proficiency
- 53% ▼ -1.00%
- Median HH income
- $50,147
- Composite
- 42.36/100
- National rank
- #3246
- State rank
- #41 of 324 in MO
Livability — Waynesville
- Score
- 64/100
- State rank
- #322
- US rank
- #14679
Category grades
Schools grade is shown separately in the Schools card above.
Census & demographics
- Census place
- Waynesville, MO
- County
- Pulaski County · 25,264 people
- City population
- 14,711
- Metro
- Fort Leonard Wood, MO
- Population (ZIP)
- 14,711
- Household income
- $76,626
- Rent vs Own
- Severe rent burden
- 185.0
Population outlook (Pulaski County) Hauer SSP2
- Today (2025)
- 54,214 people
- By 2030
- 54,723 · +0.9%
- By 2040
- 54,885 · +1.2%
- By 2050
- 55,467 · +2.3%
- By 2075
- 58,576 · +8.0%
- By 2100
- 61,179 · +12.8%
Race, ethnicity, and origin ACS 2023
- Neighborhood character
- Predominantly White (76%)
- Race & ethnicity
- White 76% Black 12% Two or more races 9% Hispanic / Latino 5% Asian 1%
- Common ancestry
- Iranian 4% Serbian 2% Lithuanian 2%
- Foreign-born
- 4% · Canada, South Korea, Jamaica
- Languages at home
- 96% English-only · Spanish 2% German/W. Germanic 1% Korean 1%
Political lean MEDSL · Pulaski
- 2024 margin
- Solid R (+50.3) · D 24.2% · R 74.5% · Other 1.3%
- 2008→2024 swing
- -21.6pp toward R · 2008: -28.7pp · 2024: -50.3pp
- All cycles
- 2024: R+50.3 2020: R+45.7 2016: R+51.7 2012: R+36.1 2008: R+28.7
Not yet ingested
- Civics
- —
Market trends
- HPI YoY
- ▼ -58.32%
- Current HPI
- 155.2931
- Rent YoY
- ▲ 10.27%
- Metro
- Fort Leonard Wood, MO
- State GDP YoY
- ▲ 1.84%
- F500 in state
- 20
Industry mix (Fortune 500 HQ in MO)
| Industry | F500 HQs | Revenue |
|---|---|---|
| Healthcare | 1 | $163B |
|
||
| Insurance | 1 | $21B |
|
||
| Industrial Technology | 1 | $17B |
|
||
| Retail | 1 | $16B |
|
||
| Industrial Distribution | 1 | $10B |
|
||
| Utilities | 1 | $9B |
|
||
Price history
+0.0% since first listed2 events — show timeline
- 2026-03-22 Listed $899,900 MARIS as Distributed by MLS Grid
- 2026-03-19 Coming Soon $899,900 MARIS as Distributed by MLS Grid
Property tax history
+6.9%/yrLatest (2025): $3,667 · +6.9% YoY. Source: county tax records.
Cash-flow waterfall
monthlySold comps — $/sqft
last 12 mo · ≤1 miLoading sold comps…