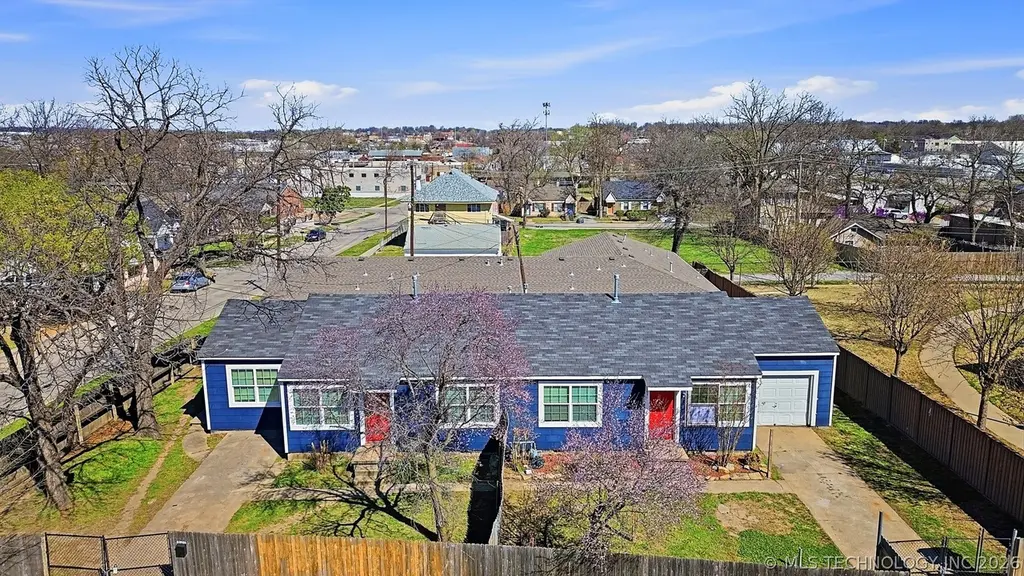
1633 E 10th St · Tulsa, OK
Flood risk 1/10 · Minimal
- FEMA flood zone
- X (unshaded)
- Chance of flooding over 30 yrs
- 0.0%
- Est. flood insurance / yr
- $507 – $1,088
Fire risk 1/10 · Minimal
- Est. fire insurance / yr
- $2,463 – $4,575
Heat risk 6/10 · Moderate
- Hot days now (above 110°F)
- 7 days/yr
- Hot days in 30 yrs
- 18 days/yr
Wind risk 2/10 · Minimal
- Chance of severe wind over 30 yrs
- 4.0%
Air-quality risk 3/10 · Minor
- Unhealthy air days now
- 2 days/yr
- Unhealthy air days in 30 yrs
- 3 days/yr
Risk factors via First Street. Map © Google.
Why this score? — see what drove the C+ grade
The composite is a weighted blend of 9 inputs, each scored 0–100. Each bar is that input's sub-score; the figure is the points it added to the 100-point composite (weight × sub-score).
- Cash flow +25.0/30.0
- ARV discount +15.0/15.0
- DSCR +8.2/10.0
- 1% rule +5.9/10.0
- Livability +3.8/5.0
- Rent growth +2.8/5.0
- Condition / age +2.5/5.0
- Schools +0.8/10.0
- Appreciation +0.0/10.0
$225,000
🖨 Deal sheet 📄 Offer letter ✓ Due diligence
Listing remarks MLS
Located in the heart of Tulsa's Pearl District, this 1633 and 1635 E 10th St duplex offers a prime opportunity for investors or owner-occupants. Sitting on a 6,316 sqft lot, the property features two units— unit 1633 is a two bedroom one bath, and unit 1635 is a one bedroom one bathroom. Each unit includes hardwood floors, a dining space, and a flexible home office/den option. The fully fenced backyard and gated entry provide added privacy and security. Conveniently situated just minutes from Hillcrest Hospital, restaurants, shopping, and entertainment, this property is perfectly positioned for strong rental demand. Don't miss your chance to own an income-producing property in one of Tulsa's most desirable areas—schedule your showing today!
Key facts
- Big lot
- Gated access
- Real hardwood floors
Tags
Property features AI
Finance
- HOA & community: Sidewalks; Gutters (community feature)
Exterior
- Parking: Attached garage (1 car)
- Security: No safety shelter
- Utilities: Electricity available; Natural gas available; Public water; Public sewer
- Home design: Single-story home; Faces south; Entry on main level
- Construction: Built with wood frame construction; Asphalt/fiberglass roof; Crawlspace and slab foundation
- Exterior features: Rain gutters; Porch; Full privacy fencing; Corner lot
Interior
- Kitchen: Oven; Range; Refrigerator
- Flooring: Carpet; Tile; Wood
- Bathrooms: 2 full bathrooms
- Heating & cooling: Central heating (gas) with multiple heating units; Central air conditioning (two units)
- Interior features: Vinyl window frames; Laminate countertops; No additional interior features listed
- Laundry & utility: Gas water heater
Neighborhood map
What this means for you Summary
Snapshot
- This is a 3-bed/2.0-bath townhouse listed at $225k.
Deal economics
- At list price, monthly cash flow is $493 ($6k/yr) — positive.
- The deal already cash-flows at list — no discount required.
- Meets the 1% rule at list price ($2k rent vs $225k).
- Recommended offer: $212k (6.0% below list) — sets the bar for market timing.
- Cap rate 8.9% vs local median 3.9% in Tulsa — top-decile yield for the area; either an underpriced asset or a hidden risk that comps aren't pricing in. Stress-test before assuming the spread holds.
Location & tenants
- Location reads 75/100 on livability (#13 in OK, #4,058 nationally) — a middle-class / working-renter tenant base. Strengths: amenities A+, commute A+, cost of living A+; Watch: schools F, crime F, employment D-.
- Tulsa (urban): math 7% / reading 12% proficiency, ranked #250 of 270 in OK (top 93%) — low school quality limits family demand, transient renter base, plan for 1-2y turnover; 76% free/reduced lunch — lower-income household profile, screen leases tightly.
- Market conditions: Rents rising (+1.2%/yr); 30 active listings in the ZIP; 22 comparable units currently listed for rent nearby; rentals at typical pace (median 15d on market — plan ~3-4 weeks tenant-placement turnaround); 2,818 units permitted in Tulsa County in 2024 (518 in 5+ unit buildings).
- This rent runs 43% of the median local income ($68k/yr) — at the standard rent-burdened threshold; future hikes will face affordability resistance.
Forward outlook
- Local home prices are declining (-3.0%/yr); year-one equity from $2k of loan paydown is wiped out by about $7k of value loss. Plan a longer hold.
- Tulsa County population projected at +30% by 2050 — long-run rental-demand tailwind backs the buy-and-hold thesis.
Negotiation context
- It's been on market 74 days — a 6% lower offer ($212k) is reasonable based on typical stale-listing flexibility.
- 6 sale attempts since 7y ago with the ask held roughly flat each time — persistent listings suggest the price (not the market) is what's stuck; bring a comps-based counter.
- Current owner paid $195k; 15% above their basis — modest negotiation headroom, anchor on the comps not their cost.
Risks & watch-outs
- Watch-outs: built in 1940 — expect roof / HVAC / electrical / plumbing capex.
- Climate carrying-cost: extreme-heat days projected 7→18/yr by 2055 (HVAC capex compounding) — expect insurance premiums to compound above CPI over the hold.
Questions for the listing agent
- It's been on market 74 days. Have you received any prior offers? Is the seller open to a 6% concession, seller financing, or rate buy-down credit?
- Built in 1940 — when were the roof, HVAC, electrical panel, plumbing, and water heater last replaced?
- Why hasn't it sold? Are there any deal-killer items the seller is aware of (foundation, flood, title, zoning, code violations)?
- Is there a deadline driving the sale (1031 exchange, divorce, estate, relocation)? That informs how much negotiation room exists.
- Schools are F-rated, which usually means shorter tenancies and higher turnover. Who's the typical renter profile here, and what's been the actual vacancy rate?
- Crime grade is F in this area — have there been break-ins, vandalism, or insurance claims at this property in the last 3 years? What carrier currently insures it and at what premium?
- What's the average days-on-market for RENTAL listings here right now (not sales)? A rising rental-DOM trend means longer vacancies and softer asking-rent achievability than the comps imply.
- What's the recent tenant-quality profile in this submarket — average credit score on applications, eviction rate, late-payment / NSF rate, and stable-employment percentage? A property-management company in the area should have these aggregated.
- How much new for-sale + rental construction is in the pipeline within 1–3 miles? Heavy new supply typically softens prices + rents 12–24 months out; constrained supply supports both.
Investment metrics
- 1% rule
- 1.09% ✓
- Cap rate
- 8.92%
- Cash-on-cash
- 9.39%
- DSCR
- 1.42
- GRM
- 7.7
CMA / ARV
- ARV (on-the-fly)
- $378,432
- Comps found
- 11
Show comp detail 11 sales within ~0.75 mi
| Address | Dist | Beds/Ba | Sqft | Sold | Price | $/sf | Match |
|---|---|---|---|---|---|---|---|
| 1140 S Quincy Ave #1 | 0.35mi | 3/3.0 | 1,756 (+0%) | 15mo | $390,000 | $222 | 67 |
| 1140 S Quincy Ave #2 | 0.35mi | 3/3.0 | 1,756 (+0%) | 15mo | $390,000 | $222 | 67 |
| 1140 S Quincy Ave #3 | 0.35mi | 3/3.0 | 1,756 (+0%) | 15mo | $390,000 | $222 | 67 |
| 1140 S Quincy Ave #4 | 0.35mi | 3/3.0 | 1,756 (+0%) | 15mo | $390,000 | $222 | 67 |
| 713 S Madison EastPlace | 0.61mi | 2/2.5 (-1) | 1,761 (+0%) | 2mo | $380,000 | $216 | 62 |
| 1128 S Quincy Ave | 0.33mi | 4/3.0 (+1) | 1,872 (+7%) | 8mo | $250,000 | $134 | 57 |
| 1428 S Quincy Ave Unit B | 0.60mi | 3/2.5 | 1,806 (+3%) | 11mo | $365,000 | $202 | 56 |
| 1428 S Quincy Ave Unit D | 0.60mi | 2/2.5 (-1) | 1,756 (+0%) | 12mo | $355,000 | $202 | 55 |
| 1430 S Quincy Ave Unit C | 0.61mi | 2/2.5 (-1) | 1,756 (+0%) | 15mo | $350,000 | $199 | 52 |
| 1428 S Quincy Ave Unit C | 0.60mi | 2/2.5 (-1) | 1,756 (+0%) | 19mo | $335,000 | $191 | 49 |
| 1401 S Rockford Ave | 0.51mi | 2/2.5 (-1) | 1,994 (+14%) | 0mo | $444,000 | $223 | 46 |
Match score weights: distance 35% · size 25% · config 20% · recency 20%. Top-matched comps best support the ARV.
Projected returns pro-forma
-3.0% appreciation · 1.21% rent growth · sell at horizon
- IRR
- -4.1%
- Equity multiple
- 0.85×
- Total profit
- $-9,411
- Equity at exit
- $33,548
- IRR
- 3.6%
- Equity multiple
- 1.24×
- Total profit
- $14,977
- Equity at exit
- $19,454
Cash invested: $63,000 (down + closing). Projections, not guarantees.
Landlord ↔ Tenant lean methodology
- Overall (STATE)
- 83 Strongly Landlord-Friendly
- State Oklahoma
- 83 Strongly Landlord-Friendly · R+20
- County
- — inherits STATE
- City
- — inherits STATE
ZIP-level market 74120
- Home prices YoY
- -29.1%
- Rents YoY
- 1.2%
- Active inventory
- 30
- Price-to-rent
- 7.7×
Monthly cashflow live
- Estimated rent
- $2,446 high interval (Pro) →
- Mortgage (P&I)
- −$1,180
- Tax from tax record
- −$166 /mo · $1,990/yr
- Insurance
- −$94
- HOA
- −$0
- Vacancy / Maint / Mgmt
- −$514
- Net cashflow
- $493
Break-even live
UW: 25.0% down · 7.5% · 30yr · 1.5% tax · 5.0% vac · 8.0% maint · 8.0% mgmt
Financing live
Cash to close
- Down payment
- $56,250
- Closing costs
- $6,750
- Reserves months
- —
- Total cash needed
- —
Loan-product check · same deal, 3 products live
Conventional
25% down · 7.5% · 30yr
- Down + closing
- —
- Monthly P&I
- —
- Monthly cashflow
- —
- DSCR
- —
- Eligible?
- —
Personal DTI + credit; lowest rate.
DSCR
20% down · 8.5% · 30yr
- Down + closing
- —
- Monthly P&I
- —
- Monthly cashflow
- —
- DSCR
- —
- Eligible?
- —
No personal income docs; deal must DSCR.
Hard money
10% down · 12.0% · 12mo
- Down + closing
- —
- Monthly P&I
- —
- Monthly cashflow
- —
- DSCR
- —
- Eligible?
- —
Short-term bridge; refi at stabilization.
Rent comps 22 comps
| Address | Beds | Baths | Sqft | Rent | $/sqft | DOM | Units | Dist |
|---|---|---|---|---|---|---|---|---|
| 624 S Peoria Ave Tulsa, OK | 3.0 | 1.0–2.5 | 1521 | $3,995 | $2.63 | 1d | 10 | 0.47mi |
| 2219 E 11th St Tulsa, OK | 1.0–3.0 | 1.0–3.0 | 1136 | $2,787 | $2.45 | 1d | 10 | 0.49mi |
| 1411 S Quaker Ave Tulsa, OK | 2.0 | 1.5–2.5 | 1200 | $2,049 | $1.71 | 14d | 2 | 0.60mi |
| 1428 S Quincy Ave Unit C Tulsa, OK | 2.0 | 2.5 | 1756 | $3,700 | $2.11 | 3d | 1 | 0.60mi |
| 1139 S Birmingham Ave Tulsa, OK | 3.0 | 2.0 | 1725 | $2,100 | $1.22 | 23d | 1 | 0.83mi |
| 1616 S Peoria Ave #4 Tulsa, OK | 2.0 | 2.5 | 1688 | $1,900 | $1.13 | 23d | 1 | 0.85mi |
| 1736 S Xanthus Ave Tulsa, OK | 2.0 | 1.0 | 1328 | $1,450 | $1.09 | 3d | 1 | 0.88mi |
| 2121 S Yorktown Ave #602 Tulsa, OK | 2.0 | 2.0 | 1812 | $3,500 | $1.93 | 16d | 1 | 1.20mi |
| 2533 E 19th St Tulsa, OK | 3.0 | 2.0 | 1748 | $2,250 | $1.29 | 21d | 1 | 1.21mi |
| 6 E 5th St Tulsa, OK | 1.0–2.0 | 1.0–2.0 | 1103 | $2,500 | $2.27 | 16d | 4 | 1.22mi |
| 6 E 5th St Unit 105 Tulsa, OK | 2.0 | 2.0 | 1361 | $2,450 | $1.80 | 21d | 1 | 1.22mi |
| 310 E 1st St Tulsa, OK | 1.0–2.0 | 1.0–2.0 | 1226 | $2,870 | $2.34 | 1d | 4 | 1.23mi |
| 310 E 1st St Tulsa, OK | 1.0–2.0 | 1.0–2.0 | 1110 | $2,870 | $2.58 | 19d | 5 | 1.23mi |
| 420 S Main St Tulsa, OK | 2.0 | 1.0–2.0 | 1291 | $2,700 | $2.09 | 1d | 13 | 1.27mi |
| 9 E 4th St Tulsa, OK | 3.0 | 1.0–2.0 | 894 | $2,499 | $2.80 | 1d | 5 | 1.28mi |
| 420 E Archer St Tulsa, OK | 1.0–2.0 | 1.0–2.5 | 1159 | $3,646 | $3.15 | 1d | 30 | 1.29mi |
| 1005 N Quincy Ave Unit A Tulsa, OK | 3.0 | 2.0 | 1303 | $1,450 | $1.11 | 2d | 1 | 1.33mi |
| 406 S Boulder Ave Tulsa, OK | 1.0–2.0 | 1.0–2.0 | 1082 | $2,906 | $2.69 | 16d | 3 | 1.35mi |
| 1025 N Quincy Ave Unit A Tulsa, OK | 3.0 | 2.0 | 1303 | $1,450 | $1.11 | 23d | 1 | 1.40mi |
| 720 N Columbia Ave Tulsa, OK | 3.0 | 1.0 | 1233 | $1,150 | $0.93 | 3d | 1 | 1.44mi |
| 1008 E King Pl Tulsa, OK | 3.0 | 1.0 | 1284 | $1,295 | $1.01 | 1d | 1 | 1.48mi |
| 1401 S Elwood Ave Tulsa, OK | 3.0 | 1.0 | 1373 | $1,850 | $1.35 | 23d | 1 | 1.49mi |
Listing history 28 events
-
2026-06-18days on market $225,000 Active 74 DOM
-
2026-06-17days on market $225,000 Active 73 DOM
-
2026-06-16days on market $225,000 Active 72 DOM
-
2026-06-15days on market $225,000 Active 71 DOM
-
2026-06-13days on market $225,000 Active 69 DOM
-
2026-06-10days on market $225,000 Active 66 DOM
-
2026-06-09days on market $225,000 Active 65 DOM
-
2026-06-08days on market $225,000 Active 64 DOM
-
2026-06-07days on market $225,000 Active 63 DOM
-
2026-06-05days on market $225,000 Active 60 DOM
-
2026-06-03days on market $225,000 Active 59 DOM
-
2026-06-02status $225,000 Active 58 DOM
-
2026-04-28status Active
-
2026-04-15status Pending
-
2026-03-18$225,000 Active
-
2025-05-07soldstatus $195,000
-
2025-05-05soldstatus $195,000 Closed 762-char remark
Show marketing remark (762 chars)
Located in the heart of Tulsa's Pearl District, this 1633 and 1635 E 10th St duplex offers a prime opportunity for investors or owner-occupants. Sitting on a 6,316 sqft lot, the property features two units— unit 1633 is a two bedroom one bath, and unit 1635 is a one bedroom one bathroom. Each unit includes hardwood floors, a dining space, and a flexible home office/den option. The fully fenced backyard and gated entry provide added privacy and security. Conveniently situated just minutes from Hillcrest Hospital, restaurants, shopping, and entertainment, this property is perfectly positioned for strong rental demand. Don't miss your chance to own an income-producing property in one of Tulsa's most desirable areas—schedule your showing today!
-
2025-03-09status Pending 762-char remark
Show marketing remark (762 chars)
Located in the heart of Tulsa's Pearl District, this 1633 and 1635 E 10th St duplex offers a prime opportunity for investors or owner-occupants. Sitting on a 6,316 sqft lot, the property features two units— unit 1633 is a two bedroom one bath, and unit 1635 is a one bedroom one bathroom. Each unit includes hardwood floors, a dining space, and a flexible home office/den option. The fully fenced backyard and gated entry provide added privacy and security. Conveniently situated just minutes from Hillcrest Hospital, restaurants, shopping, and entertainment, this property is perfectly positioned for strong rental demand. Don't miss your chance to own an income-producing property in one of Tulsa's most desirable areas—schedule your showing today!
-
2025-01-19$205,000 Active 762-char remark
Show marketing remark (762 chars)
Located in the heart of Tulsa's Pearl District, this 1633 and 1635 E 10th St duplex offers a prime opportunity for investors or owner-occupants. Sitting on a 6,316 sqft lot, the property features two units— unit 1633 is a two bedroom one bath, and unit 1635 is a one bedroom one bathroom. Each unit includes hardwood floors, a dining space, and a flexible home office/den option. The fully fenced backyard and gated entry provide added privacy and security. Conveniently situated just minutes from Hillcrest Hospital, restaurants, shopping, and entertainment, this property is perfectly positioned for strong rental demand. Don't miss your chance to own an income-producing property in one of Tulsa's most desirable areas—schedule your showing today!
-
2024-04-10historical $850
-
2024-04-06$850
-
2024-03-14historical $850
-
2023-12-04$850
-
2023-09-05historical
-
2020-01-22soldstatus $135,000
-
2020-01-15soldstatus $135,000 Closed 276-char remark
Show marketing remark (276 chars)
Potential House Hack Oportunity! Complete remodel including, New Roof, Siding, Fencing, windows, Paint throughout, tile and countertops, vanities, fixtures throughout, New HVAC and Ductwork, and Refinished floors. One side is rented for $700 and the other is currently vacant.
-
2019-12-08status Pending 276-char remark
Show marketing remark (276 chars)
Potential House Hack Oportunity! Complete remodel including, New Roof, Siding, Fencing, windows, Paint throughout, tile and countertops, vanities, fixtures throughout, New HVAC and Ductwork, and Refinished floors. One side is rented for $700 and the other is currently vacant.
-
2019-12-05$130,000 Active 276-char remark
Show marketing remark (276 chars)
Potential House Hack Oportunity! Complete remodel including, New Roof, Siding, Fencing, windows, Paint throughout, tile and countertops, vanities, fixtures throughout, New HVAC and Ductwork, and Refinished floors. One side is rented for $700 and the other is currently vacant.
ⓘ Source: listings_history table (triggers on properties + properties_extension) + one-shot
backfill from property_details.listing_events for pre-trigger history.
Tax reassessment forecast OK · Resets to sale price
- Current annual tax
- $1,990 · $166/mo
- Projected year-2 tax
- $2,025 · $169/mo
- Expected delta
- +$35/yr (+$3/mo · 1.8%)
ⓘ Screening estimate from a state-policy table — verify with the county assessor before closing.
Climate risk First Street
- Flood 1/10 Low FEMA zone X (unshaded) · 0% chance over 30 yrs
- Wildfire 1/10 Low
- Heat 6/10 Major 7 d/yr ≥110°F today · 18 d/yr by 30 yrs out
- Wind 2/10 Low 4% chance of damaging wind over 30 yrs
- Air quality 3/10 Moderate 2 unhealthy d/yr today · 3 by 30 yrs out
Nearby sold comps map
Loading sold comps map…
Walkable amenities ~0.75 mi
Loading nearby amenities…
Taxation est. · year 1
- Rental income
- $29,357
- − Mortgage interest
- −$12,603
- − Property taxes
- −$1,990
- − Insurance
- −$1,125
- − Repairs & maintenance
- −$2,349
- − Management
- −$2,349
- − Depreciation
- −$6,545
- Taxable income
- $2,396
- Est. tax owed @ 24.0%
- −$575
- After-tax cash flow
- $5,343/yr
For passive investors: Depreciation is non-cash, so a rental often shows a tax loss while cash-flowing — sheltering income. Rental losses are passive: they offset passive income freely, and up to $25,000/yr can offset ordinary (W-2) income if you actively participate and your MAGI is under $100k (phasing out to $0 by $150k); unused losses carry forward. On sale, claimed depreciation is recaptured at up to 25%, and gains may owe capital-gains tax (a 1031 exchange can defer both). Figures are a year-1 estimate at your 24.0% rate — not tax advice; consult a CPA.
Schools (NCES district)
- District
- Tulsa
- NCES district ID
- 4030240
- Math proficiency
- 7% ▼ -9.00%
- Reading proficiency
- 12% ▼ -7.00%
- Median HH income
- $37,895
- Composite
- 8.04/100
- National rank
- #9919
- State rank
- #250 of 270 in OK
Livability — Tulsa
- Score
- 75/100
- State rank
- #13
- US rank
- #4058
Category grades
Schools grade is shown separately in the Schools card above.
Census & demographics
- Census place
- Tulsa, OK
- County
- Tulsa County · 640,811 people
- City population
- 389,418
- Metro
- Tulsa, OK
- Population (ZIP)
- 5,195
- Household income
- $68,255
- Rent vs Own
- Severe rent burden
- 395.0
Population outlook (Tulsa County) Hauer SSP2
- Today (2025)
- 723,846 people
- By 2030
- 766,033 · +5.8%
- By 2040
- 851,386 · +17.6%
- By 2050
- 938,389 · +29.6%
- By 2075
- 1,166,011 · +61.1%
- By 2100
- 1,350,277 · +86.5%
Race, ethnicity, and origin ACS 2023
- Neighborhood character
- Predominantly White (72%)
- Race & ethnicity
- White 72% Hispanic / Latino 11% Two or more races 11% Native American 4% Black 4% Asian 2%
- Hispanic origin (detail)
- Mexican 9%
- Common ancestry
- Italian 4% Lithuanian 3% Romanian 2%
- Foreign-born
- 7% · Canada, South Korea, China
- Languages at home
- 89% English-only · Spanish 8% Other Indo-European 1% Korean 1%
Political lean MEDSL · Tulsa
- 2024 margin
- R (+15.2) · D 41.3% · R 56.5% · Other 2.2%
- 2008→2024 swing
- +9.2pp toward D · 2008: -24.5pp · 2024: -15.2pp
- All cycles
- 2024: R+15.2 2020: R+15.6 2016: R+22.9 2012: R+27.4 2008: R+24.5
Not yet ingested
- Civics
- —
Market trends
- HPI YoY
- ▼ -116.41%
- Current HPI
- 283.1716
- Rent YoY
- ▲ 1.21%
- Metro
- Tulsa, OK
- State GDP YoY
- ▲ 1.55%
- F500 in state
- 6
Industry mix (Fortune 500 HQ in OK)
| Industry | F500 HQs | Revenue |
|---|---|---|
| Energy | 3 | $48B |
|
||
Price history
+73.1% since first listed16 events — show timeline
- 2026-04-28 Relisted — MLS Technology, Inc.
- 2026-04-15 Pending — MLS Technology, Inc.
- 2026-03-18 Listed $225,000 MLS Technology, Inc.
- 2025-05-07 Sold (Public Records) $195,000 Public Records
- 2025-05-05 Sold (MLS) $195,000 MLS Technology, Inc.
- 2025-03-09 Pending — MLS Technology, Inc.
- 2025-01-19 Listed $205,000 MLS Technology, Inc.
- 2024-04-10 Rental Removed $850 APPFOLIO
- 2024-04-06 Listed for Rent $850 APPFOLIO
- 2024-03-14 Rental Removed $850 APPFOLIO
- 2023-12-04 Listed for Rent $850 APPFOLIO
- 2023-09-05 Rental Removed — APPFOLIO
- 2020-01-22 Sold (Public Records) $135,000 Public Records
- 2020-01-15 Sold (MLS) $135,000 MLS Technology, Inc.
- 2019-12-08 Pending — MLS Technology, Inc.
- 2019-12-05 Listed $130,000 MLS Technology, Inc.
Property tax history
+13.8%/yrLatest (2025): $1,990 · +3.5% YoY. Source: county tax records.
Cash-flow waterfall
monthlySold comps — $/sqft
last 12 mo · ≤1 miLoading sold comps…