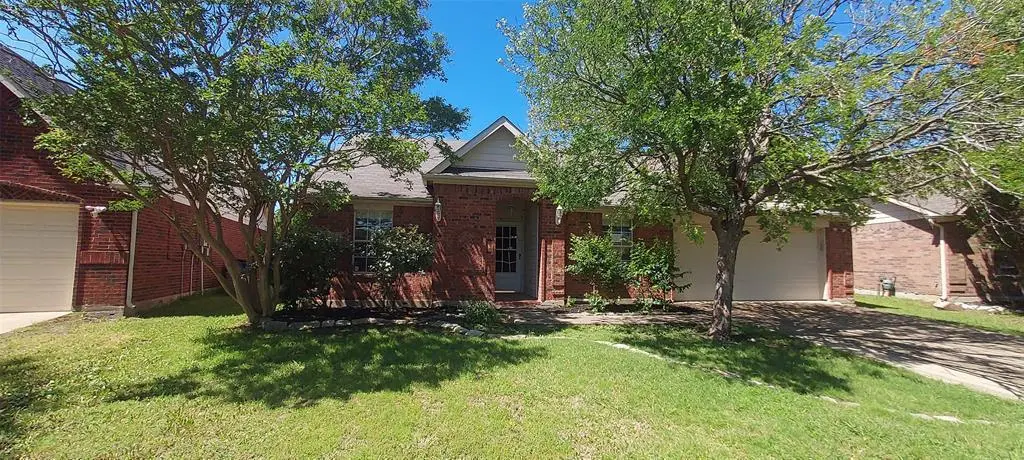
1011 Bainbridge Ln · Forney, TX
Flood risk 1/10 · Minimal
- FEMA flood zone
- X (unshaded)
- Chance of flooding over 30 yrs
- 0.0%
- Est. flood insurance / yr
- $507 – $1,088
Fire risk 5/10 · Moderate
- Est. fire insurance / yr
- $1,222 – $2,270
Heat risk 8/10 · Major
- Hot days now (above 110°F)
- 7 days/yr
- Hot days in 30 yrs
- 25 days/yr
Wind risk 6/10 · Moderate
- Chance of severe wind over 30 yrs
- 27.0%
Air-quality risk 2/10 · Minimal
- Unhealthy air days now
- 1 days/yr
- Unhealthy air days in 30 yrs
- 1 days/yr
Risk factors via First Street. Map © Google.
Why this score? — see what drove the D+ grade
The composite is a weighted blend of 9 inputs, each scored 0–100. Each bar is that input's sub-score; the figure is the points it added to the 100-point composite (weight × sub-score).
- ARV discount +15.0/15.0
- Cash flow +12.1/30.0
- 1% rule +5.2/10.0
- Schools +4.0/10.0
- Livability +3.8/5.0
- DSCR +3.6/10.0
- Rent growth +2.9/5.0
- Condition / age +2.5/5.0
- Appreciation +0.0/10.0
$209,900
🖨 Deal sheet (PDF) 📄 Offer letter ✓ Due diligence
Listing remarks MLS
Welcome to 1011 Bainbridge! 2 open livingrooms provide space for the whole family. Secondary rooms are up front with a full bath. Right off the second livingroom you'll find the primary retreat, complete with separate bath and shower. The large covered cedar patio is perfect for outdoor entertaining. Schedule a showing today. This property is part of the First Look Program until 5-18-26. Owner occupants only.
Key facts
- Primary retreat
- Open livingrooms
- Full bath
Tags
Neighborhood map
What this means for you Summary
Snapshot
- This is a 3-bed/2.0-bath single-family listed at $210k.
Deal economics
- At list price, monthly cash flow is $-45 ($-541/yr) — negative.
- To cash-flow at today's rent, offer at most $202k (3.8% below list).
- Meets the 1% rule at list price ($2k rent vs $210k).
- Recommended offer: $202k (3.8% below list) — sets the bar for cash-flow.
- Cap rate 6.0% vs local median 4.1% in Forney — top-decile yield for the area; either an underpriced asset or a hidden risk that comps aren't pricing in. Stress-test before assuming the spread holds.
Location & tenants
- Location reads 76/100 on livability (#98 in TX, #3,339 nationally) — a middle-class / working-renter tenant base. Strengths: crime A+, employment A+, cost of living A+; Watch: amenities C-, commute F.
- Forney ISD (rural): math 41% / reading 44% proficiency, ranked #234 of 826 in TX (top 28%) — families likely to look elsewhere, expect single-tenant / working-renter base with shorter leases.
- Market conditions: Rents rising (+1.4%/yr); 2200 active listings in the ZIP; 40 comparable units currently listed for rent nearby; rentals at typical pace (median 22d on market — plan ~3-4 weeks tenant-placement turnaround); solid renter incomes; 1,747 units permitted in Kaufman County in 2024 (180 in 5+ unit buildings).
Forward outlook
- Local home prices are declining (-3.0%/yr); year-one equity from $1k of loan paydown is wiped out by about $6k of value loss. Plan a longer hold.
- Kaufman County population projected at +43% by 2050 — long-run rental-demand tailwind backs the buy-and-hold thesis.
Negotiation context
- It's been on market 51 days — a 3% lower offer ($204k) is reasonable based on typical stale-listing flexibility.
- 4 sale attempts since 22y ago with the ask held roughly flat each time — persistent listings suggest the price (not the market) is what's stuck; bring a comps-based counter.
Risks & watch-outs
- Watch-outs: property tax is 2.9% of price.
- Climate carrying-cost: major wind risk, 27% chance of damaging wind over 30y; moderate wildfire risk; extreme-heat days projected 7→25/yr by 2055 (HVAC capex compounding) — expect insurance premiums to compound above CPI over the hold.
Questions for the listing agent
- What do current leases actually rent for vs. the listed asking? Can we see a recent rent roll and the last 12 months of T-12 income?
- It's been on market 51 days. Have you received any prior offers? Is the seller open to a 4% concession, seller financing, or rate buy-down credit?
- Property tax is high relative to price — has the assessment been appealed recently, and will the sale trigger a re-assessment?
- What does the HOA fee cover, when was the last increase, and are there any pending special assessments or reserve-fund shortfalls?
- Is there a deadline driving the sale (1031 exchange, divorce, estate, relocation)? That informs how much negotiation room exists.
- Schools are B-rated — typically a magnet for longer-tenancy family renters. What's the average tenant stay here, and is there a school-zone premium baked into asking?
- The area grade is low — what's the realistic commute time and amenity access for the typical tenant pool here? Any planned neighborhood developments (good or bad) we should know about?
- What's the average days-on-market for RENTAL listings here right now (not sales)? A rising rental-DOM trend means longer vacancies and softer asking-rent achievability than the comps imply.
- What's the recent tenant-quality profile in this submarket — average credit score on applications, eviction rate, late-payment / NSF rate, and stable-employment percentage? A property-management company in the area should have these aggregated.
- How much new for-sale + rental construction is in the pipeline within 1–3 miles? Heavy new supply typically softens prices + rents 12–24 months out; constrained supply supports both.
Investment metrics
- 1% rule
- 1.02% ✓
- Cap rate
- 6.04%
- Cash-on-cash
- -0.92%
- DSCR
- 0.96
- GRM
- 8.2
CMA / ARV
- ARV (median comp)
- $267,390
- List price
- $209,900
- Delta
- -21.50%
- Verdict
- UNDERPRICED
- Comps
- 20 within 1.0 mi
Show comp detail 12 sales within ~0.75 mi
| Address | Dist | Beds/Ba | Sqft | Sold | Price | $/sf | Match |
|---|---|---|---|---|---|---|---|
| 1015 Bainbridge Ln | 0.03mi | 3/2.0 | 1,984 (+7%) | 8mo | $299,000 | $151 | 81 |
| 1019 Chelsea Ln | 0.08mi | 4/2.0 (+1) | 1,840 (-1%) | 11mo | $269,900 | $147 | 81 |
| 1016 Halifax Ln | 0.09mi | 3/2.0 | 1,678 (-10%) | 0mo | $240,000 | $143 | 80 |
| 1020 Halifax Ln | 0.09mi | 3/2.0 | 1,724 (-7%) | 11mo | $250,000 | $145 | 74 |
| 1005 Sussex Dr | 0.20mi | 4/2.0 (+1) | 1,702 (-8%) | 4mo | $250,000 | $147 | 68 |
| 1006 Buckingham Dr | 0.61mi | 4/2.0 (+1) | 1,845 (-1%) | 3mo | $254,900 | $138 | 63 |
| 3111 Flowering Spgs | 0.58mi | 3/2.0 | 1,957 (+5%) | 5mo | $281,900 | $144 | 60 |
| 3115 Marble Falls Dr | 0.55mi | 3/2.0 | 1,952 (+5%) | 14mo | $300,000 | $154 | 55 |
| 3102 Flowering Springs Dr | 0.54mi | 4/2.0 (+1) | 1,980 (+7%) | 7mo | $274,999 | $139 | 53 |
| 4306 Cat Tail Way | 0.69mi | 4/2.0 (+1) | 1,685 (-9%) | 7mo | $265,000 | $157 | 42 |
| 3121 Granite Rock Trl | 0.59mi | 4/2.0 (+1) | 2,124 (+14%) | 3mo | $299,900 | $141 | 41 |
| 4322 Cat Tail Way | 0.74mi | 3/2.0 | 1,642 (-12%) | 12mo | $253,000 | $154 | 36 |
Match score weights: distance 35% · size 25% · config 20% · recency 20%. Top-matched comps best support the ARV.
Projected returns pro-forma
-3.0% appreciation · 1.42% rent growth · sell at horizon
- IRR
- -19.8%
- Equity multiple
- 0.32×
- Total profit
- $-40,029
- Equity at exit
- $31,297
- IRR
- -17.1%
- Equity multiple
- 0.13×
- Total profit
- $-51,039
- Equity at exit
- $18,148
Cash invested: $58,772 (down + closing). Projections, not guarantees.
Landlord ↔ Tenant lean methodology
- Overall (STATE)
- 87 Strongly Landlord-Friendly
- State Texas
- 87 Strongly Landlord-Friendly · R+5
- County
- — inherits STATE
- City
- — inherits STATE
ZIP-level market 75126
- Rents YoY
- 1.4%
- Active inventory
- 2200
- Price-to-rent
- 8.2×
Monthly cashflow live
- Estimated rent
- $2,143 high interval (Pro) →
- Mortgage (P&I)
- −$1,101
- Tax from tax record
- −$509 /mo · $6,108/yr
- Insurance
- −$87
- HOA
- −$41
- Vacancy / Maint / Mgmt
- −$450
- Net cashflow
- $-45
Break-even live
Sensitivity live
| Price | -10% $74 | -5% $14 | +0% $-45 | +5% $-104 | +10% $-164 |
|---|---|---|---|---|---|
| Rent | -10% $-214 | -5% $-130 | +0% $-45 | +5% $40 | +10% $124 |
| Rate | -1.0pp $61 | -0.5pp $8 | base $-45 | +0.5pp $-99 | +1.0pp $-155 |
UW: 25.0% down · 7.5% · 30yr · 1.5% tax · 5.0% vac · 8.0% maint · 8.0% mgmt
Financing live
Cash to close
- Down payment
- $52,475
- Closing costs
- $6,297
- Reserves months
- —
- Total cash needed
- —
Loan-product check · same deal, 3 products live
Conventional
25% down · 7.5% · 30yr
- Down + closing
- —
- Monthly P&I
- —
- Monthly cashflow
- —
- DSCR
- —
- Eligible?
- —
Personal DTI + credit; lowest rate.
DSCR
20% down · 8.5% · 30yr
- Down + closing
- —
- Monthly P&I
- —
- Monthly cashflow
- —
- DSCR
- —
- Eligible?
- —
No personal income docs; deal must DSCR.
Hard money
10% down · 12.0% · 12mo
- Down + closing
- —
- Monthly P&I
- —
- Monthly cashflow
- —
- DSCR
- —
- Eligible?
- —
Short-term bridge; refi at stabilization.
Rent comps 40 comps
| Address | Beds | Baths | Sqft | Rent | $/sqft | DOM | Units | Dist |
|---|---|---|---|---|---|---|---|---|
| 1019 Chelsea Ln Forney, TX | 4.0 | 2.0 | 1840 | $2,205 | $1.20 | 0d | 1 | 0.06mi |
| 1112 Alexandria Dr Forney, TX | 3.0 | 2.0 | 1477 | $1,880 | $1.27 | 0d | 1 | 0.08mi |
| 1100 Alexandria Dr Forney, TX | 3.0 | 2.0 | 1574 | $1,895 | $1.20 | 44d | 1 | 0.14mi |
| 1100 Alexandria Dr Forney, TX | 3.0 | 2.0 | 1553 | $1,725 | $1.11 | 8d | 1 | 0.14mi |
| 1108 Halifax Ln Forney, TX | 3.0 | 2.0 | 1502 | $1,835 | $1.22 | 18d | 1 | 0.21mi |
| 1108 Halifax Ln Forney, TX | 3.0 | 2.0 | 1502 | $1,835 | $1.22 | 8d | 1 | 0.21mi |
| 1201 Cumberland Ct Forney, TX | 3.0 | 2.0 | 2077 | $2,100 | $1.01 | 8d | 1 | 0.25mi |
| 1123 Singletree Dr Forney, TX | 3.0 | 2.0 | 1492 | $1,750 | $1.17 | 4d | 1 | 0.31mi |
| 1123 Singletree Dr Forney, TX | 3.0 | 2.0 | 1492 | $1,750 | $1.17 | 25d | 1 | 0.31mi |
| 1111 Cumberland Dr Forney, TX | 3.0 | 2.0 | 1424 | $1,750 | $1.23 | 44d | 1 | 0.34mi |
| 3005 Guadalupe Dr Forney, TX | 4.0 | 2.0 | 2169 | $2,195 | $1.01 | 44d | 1 | 0.37mi |
| 1002 Manassas Dr Forney, TX | 3.0 | 2.0 | 1648 | $1,999 | $1.21 | 44d | 1 | 0.40mi |
| 1002 Manassas Dr Forney, TX | 3.0 | 2.0 | 1649 | $2,250 | $1.36 | 6d | 1 | 0.40mi |
| 3111 Flint Rock Dr Forney, TX | 4.0 | 2.0 | 2185 | $2,295 | $1.05 | 8d | 1 | 0.41mi |
| 3100 Marble Falls Dr Forney, TX | 4.0 | 2.0 | 2124 | $2,195 | $1.03 | 44d | 1 | 0.47mi |
| 3018 Sweetwater Trl Forney, TX | 3.0 | 2.0 | 1532 | $1,950 | $1.27 | 7d | 1 | 0.52mi |
| 4315 Elderberry St Forney, TX | 4.0 | 2.5 | 2160 | $2,950 | $1.37 | 44d | 1 | 0.52mi |
| 1003 Windmill Farms Blvd Forney, TX | 1.0–3.0 | 1.0–2.0 | 1081 | $2,170 | $2.01 | 0d | 36 | 0.52mi |
| 3111 Marble Falls Dr Forney, TX | 3.0 | 2.0 | 1943 | $2,145 | $1.10 | 44d | 1 | 0.53mi |
| 3010 Sweetwater Trl Forney, TX | 3.0 | 2.0 | 2200 | $2,200 | $1.00 | 44d | 1 | 0.54mi |
| 5015 Royal Springs Dr Forney, TX | 3.0 | 2.5 | 2066 | $2,125 | $1.03 | 44d | 1 | 0.61mi |
| 1300 N Gateway Blvd Forney, TX | 1.0–3.0 | 1.0–2.0 | 1039 | $2,492 | $2.40 | 0d | 22 | 0.61mi |
| 3125 Granite Rock Trl Forney, TX | 4.0 | 2.0 | 2090 | $2,350 | $1.12 | 19d | 1 | 0.61mi |
| 2004 Chisolm Trl Forney, TX | 3.0 | 2.0 | 1708 | $2,150 | $1.26 | 19d | 1 | 0.66mi |
| 4620 Elderberry St Forney, TX | 3.0 | 2.0 | 1856 | $1,850 | $1.00 | 21d | 1 | 0.68mi |
| 4222 Calla Dr Forney, TX | 4.0 | 2.0 | 1981 | $1,950 | $0.98 | 18d | 1 | 0.82mi |
| 4432 Thalia Way Forney, TX | 3.0 | 2.0 | 1816 | $2,100 | $1.16 | 44d | 1 | 0.83mi |
| 8050 Privet St Forney, TX | 4.0 | 2.0 | 2045 | $2,100 | $1.03 | 25d | 1 | 0.85mi |
| 4254 Calla Dr Forney, TX | 4.0 | 2.0 | 1983 | $2,400 | $1.21 | 44d | 1 | 0.88mi |
| 4146 Perch Dr Forney, TX | 4.0 | 2.5 | 2456 | $2,500 | $1.02 | 21d | 1 | 0.91mi |
| 3007 Boran Dr Forney, TX | 3.0 | 2.0 | 1650 | $2,200 | $1.33 | 25d | 1 | 0.95mi |
| 9200 Hawthorne Dr Forney, TX | 4.0 | 2.0 | 2037 | $2,440 | $1.20 | 12d | 1 | 0.95mi |
| 9105 Switchgrass Ln Forney, TX | 3.0 | 2.0 | 1962 | $2,800 | $1.43 | 11d | 1 | 0.96mi |
| 2100 Aster Trl Forney, TX | 4.0 | 2.0 | 2284 | $2,190 | $0.96 | 5d | 1 | 0.97mi |
| 3016 Boran Dr Forney, TX | 3.0 | 2.0 | 1681 | $2,100 | $1.25 | 44d | 1 | 1.01mi |
| 2015 Gardenia Dr Forney, TX | 3.0 | 2.0 | 1598 | $1,850 | $1.16 | 21d | 1 | 1.03mi |
| 2006 Brook Meadow Dr Forney, TX | 4.0 | 2.5 | 1912 | $2,050 | $1.07 | 44d | 1 | 1.04mi |
| 2026 Gardenia Dr Forney, TX | 4.0 | 2.5 | 2160 | $2,315 | $1.07 | 44d | 1 | 1.04mi |
| 3023 Villegas Way Forney, TX | 4.0 | 2.0 | 1683 | $1,875 | $1.11 | 25d | 1 | 1.04mi |
| 3017 Villegas Way Forney, TX | 4.0 | 2.5 | 2153 | $2,150 | $1.00 | 44d | 1 | 1.06mi |
HOA detail
- Monthly dues
- $41 · $492/yr
Listing history 22 events
-
2026-06-10status $209,900 Pending 51 DOM
-
2026-06-09days on market $209,900 Active Option Contract 51 DOM
-
2026-06-08days on market $209,900 Active Option Contract 50 DOM
-
2026-06-07days on market $209,900 Active Option Contract 49 DOM
-
2026-06-04days on market $209,900 Active Option Contract 46 DOM
-
2026-06-03days on market $209,900 Active Option Contract 45 DOM
-
2026-06-02days on market $209,900 Active Option Contract 44 DOM
-
2026-06-01days on market $209,900 Active Option Contract 43 DOM
-
2026-05-31days on market $209,900 Active Option Contract 42 DOM
-
2026-04-18$209,900 Active 412-char remark
Show marketing remark (412 chars)
Welcome to 1011 Bainbridge! 2 open livingrooms provide space for the whole family. Secondary rooms are up front with a full bath. Right off the second livingroom you'll find the primary retreat, complete with separate bath and shower. The large covered cedar patio is perfect for outdoor entertaining. Schedule a showing today. This property is part of the First Look Program until 5-18-26. Owner occupants only.
-
2026-03-26historical
-
2026-02-05$65,000 Active
-
2019-02-26soldstatus
-
2019-02-15soldstatus Sold
-
2019-01-16status Pending
-
2018-12-12$203,000 Active
-
2018-11-27soldstatus
-
2005-06-29soldstatus
-
2005-06-28soldstatus
-
2005-06-07historical
-
2004-10-29$135,000
-
2002-04-29soldstatus
ⓘ Source: listings_history table (triggers on properties + properties_extension) + one-shot
backfill from property_details.listing_events for pre-trigger history.
Tax reassessment forecast TX · Resets to sale price
- Current annual tax
- $6,108 · $509/mo
- Projected year-2 tax
- $6,108 · $509/mo
- Expected delta
- $0/yr ($0/mo · 0.0%)
ⓘ Screening estimate from a state-policy table — verify with the county assessor before closing.
Climate risk First Street
- Flood 1/10 Low FEMA zone X (unshaded) · 0% chance over 30 yrs
- Wildfire 5/10 Major
- Heat 8/10 Severe 7 d/yr ≥110°F today · 25 d/yr by 30 yrs out
- Wind 6/10 Major 27% chance of damaging wind over 30 yrs
- Air quality 2/10 Low 1 unhealthy d/yr today · 1 by 30 yrs out
Nearby sold comps map
Loading sold comps map…
Walkable amenities ~0.75 mi
Loading nearby amenities…
Taxation est. · year 1
- Rental income
- $25,719
- − Mortgage interest
- −$11,758
- − Property taxes
- −$6,108
- − Insurance
- −$1,050
- − Repairs & maintenance
- −$2,057
- − Management
- −$2,057
- − HOA
- −$492
- − Depreciation
- −$6,106
- Taxable loss
- −$3,910
- Est. tax savings @ 24.0%
- +$938
- After-tax cash flow
- $397/yr
For passive investors: Depreciation is non-cash, so a rental often shows a tax loss while cash-flowing — sheltering income. Rental losses are passive: they offset passive income freely, and up to $25,000/yr can offset ordinary (W-2) income if you actively participate and your MAGI is under $100k (phasing out to $0 by $150k); unused losses carry forward. On sale, claimed depreciation is recaptured at up to 25%, and gains may owe capital-gains tax (a 1031 exchange can defer both). Figures are a year-1 estimate at your 24.0% rate — not tax advice; consult a CPA.
Schools (NCES district)
- District
- Forney ISD
- NCES district ID
- 4819560
- Math proficiency
- 41% ▼ -20.00%
- Reading proficiency
- 44% ▼ -12.00%
- Median HH income
- $86,679
- Composite
- 40.07/100
- National rank
- #3812
- State rank
- #234 of 826 in TX
Livability — Forney
- Score
- 76/100
- State rank
- #98
- US rank
- #3339
Category grades
Schools grade is shown separately in the Schools card above.
Census & demographics
- County
- Kaufman County · 122,338 people
- City population
- 84,799
- Metro
- Dallas-Fort Worth-Arlington, TX
- Population (ZIP)
- 84,799
- Household income
- $103,673
- Rent vs Own
- Severe rent burden
- 1306.0
Population outlook (Kaufman County) Hauer SSP2
- Today (2025)
- 138,716 people
- By 2030
- 150,815 · +8.7%
- By 2040
- 174,877 · +26.1%
- By 2050
- 198,020 · +42.8%
- By 2075
- 251,908 · +81.6%
- By 2100
- 285,325 · +105.7%
Race, ethnicity, and origin ACS 2023
- Neighborhood character
- Diverse neighborhood (Simpson 0.68)
- Race & ethnicity
- White 45% Black 25% Hispanic / Latino 23% Two or more races 14% Asian 3%
- Hispanic origin (detail)
- Mexican 18% Puerto Rican 1%
- Common ancestry
- Italian 2% Slovak 1% Portuguese 1%
- Foreign-born
- 12% · Canada, Vietnam
- Languages at home
- 79% English-only · Spanish 14% Arabic 1% Vietnamese 1%
Political lean MEDSL · Kaufman
- 2024 margin
- Strong R (+27.9) · D 35.6% · R 63.5%
- 2008→2024 swing
- +7.9pp toward D · 2008: -35.8pp · 2024: -27.9pp
- All cycles
- 2024: R+27.9 2020: R+33.9 2016: R+47.0 2012: R+44.4 2008: R+35.8
Not yet ingested
- Civics
- —
Market trends
- HPI YoY
- ▼ -102.93%
- Current HPI
- 148.5749
- Rent YoY
- ▲ 1.42%
- Metro
- Dallas-Fort Worth-Arlington, TX
- State GDP YoY
- ▲ 3.95%
- F500 in state
- 110
Industry mix (Fortune 500 HQ in TX)
| Industry | F500 HQs | Revenue |
|---|---|---|
| Energy | 16 | $1,198B |
|
||
| Technology | 5 | $198B |
|
||
| Engineering / Construction | 4 | $72B |
|
||
| Energy Services | 3 | $60B |
|
||
| Utilities | 3 | $41B |
|
||
| Healthcare | 2 | $330B |
|
||
Price history
+55.5% since first listed13 events — show timeline
- 2026-04-18 Listed $209,900 NTREIS
- 2026-03-26 Listing Removed — NTREIS
- 2026-02-05 Listed $65,000 NTREIS
- 2019-02-26 Sold (Public Records) — Public Records
- 2019-02-15 Sold (MLS) — NTREIS
- 2019-01-16 Pending — NTREIS
- 2018-12-12 Listed $203,000 NTREIS
- 2018-11-27 Sold (Public Records) — Public Records
- 2005-06-29 Sold (MLS) — NTREIS
- 2005-06-28 Sold (Public Records) — Public Records
- 2005-06-07 Listing Removed — NTREIS
- 2004-10-29 Listed $135,000 NTREIS
- 2002-04-29 Sold (Public Records) — Public Records
Property tax history
+3.8%/yrLatest (2025): $6,108 · -3.3% YoY. Source: county tax records.
Cash-flow waterfall
monthlySold comps — $/sqft
last 12 mo · ≤1 miLoading sold comps…