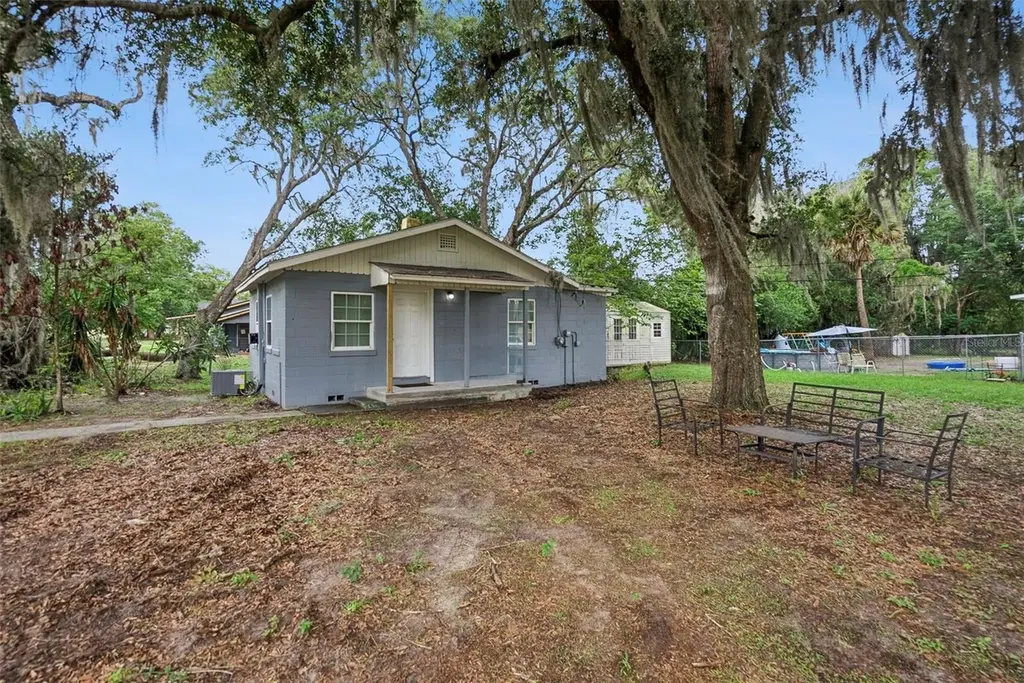
335 E Walts Ave · DeLand, FL
Flood risk 1/10 · Minimal
- FEMA flood zone
- X (unshaded)
- Chance of flooding over 30 yrs
- 0.0%
- Est. flood insurance / yr
- $507 – $1,088
Fire risk 1/10 · Minimal
- Est. fire insurance / yr
- $947 – $1,759
Heat risk 9/10 · Severe
- Hot days now (above 107°F)
- 7 days/yr
- Hot days in 30 yrs
- 20 days/yr
Wind risk 9/10 · Severe
- Chance of severe wind over 30 yrs
- 99.0%
Air-quality risk 2/10 · Minimal
- Unhealthy air days now
- 1 days/yr
- Unhealthy air days in 30 yrs
- 1 days/yr
Risk factors via First Street. Map © Google.
Why this score? — see what drove the C- grade
The composite is a weighted blend of 9 inputs, each scored 0–100. Each bar is that input's sub-score; the figure is the points it added to the 100-point composite (weight × sub-score).
- Cash flow +20.3/30.0
- ARV discount +7.5/15.0
- DSCR +6.4/10.0
- 1% rule +4.7/10.0
- Schools +3.9/10.0
- Livability +3.4/5.0
- Rent growth +3.2/5.0
- Condition / age +2.5/5.0
- Appreciation +0.0/10.0
$150,000
🖨 Deal sheet 📄 Offer letter ✓ Due diligence
Listing remarks MLS
INVESTOR . . 2 BEDROOM 1 BATH, , HOME HAS POTENTIAL BUT NEEDS WORK. ..
Key facts
- Walk-in closet
- Newer roof
- Updated kitchen
Tags
Property features AI
Finance
- Other: Total living area reported as 660 square feet; Lot size about 0.24 acre; Shed(s) on property
- Financial info: No lease restrictions; Unfurnished
- HOA & community: No association fees
Exterior
- Parking: No designated parking
- Security: No home warranty
- Utilities: Public water; Public sewer; Electricity connected; Water connected
- Home design: Single family residence; One story; Faces east
- Construction: Block and concrete construction; Shingle roof; Built on crawlspace
- Exterior features: Front porch; Porch; Awnings; Exterior lighting; Private mailbox; Sidewalk; Corner lot; Located within city limits; Near public transit; Paved road
Interior
- Kitchen: Range; Microwave; Refrigerator
- Bedrooms: 2 bedrooms
- Flooring: Laminate; Crawlspace foundation noted
- Bathrooms: 1 full bath; 1 half bath
- Heating & cooling: Central heating; Electric heating; No central cooling
- Interior features: Ceiling fans; Open floor plan; Walk-in closet(s)
- Laundry & utility: Washer; Dryer; Tankless water heater; Laundry inside
Neighborhood map
What this means for you Summary
Snapshot
- This is a 2-bed/1.0-bath single-family listed at $150k.
Deal economics
- At list price, monthly cash flow is $192 ($2k/yr) — positive.
- The deal already cash-flows at list — no discount required.
- To meet the 1% rule (rent ≥ 1% of price), the offer needs to be $145k (3.3% below list).
- Recommended offer: $145k (3.3% below list) — sets the bar for 1% rule.
Location & tenants
- Location reads 68/100 on livability (#498 in FL) — a middle-class / working-renter tenant base. Strengths: housing A+, cost of living A, crime B; Watch: amenities F, commute F, health & safety D-.
- Volusia (suburban): math 44% / reading 49% proficiency, ranked #47 of 73 in FL (top 64%) — families likely to look elsewhere, expect single-tenant / working-renter base with shorter leases.
- Zoned schools: Blue Lake Elementary School (math 30% / reading 30%, grade F, #1,882 of 2,144 statewide, top 88%, 520 students, 75% FRL); Deland High School (math 26% / reading 45%, grade F, #367 of 667 statewide, top 57%, 2,926 students, 50% FRL).
- Zoned-school proficiency averages 33% at this address vs 46% district-wide (-14 pts) — the specific schools serving this property underperform the Volusia average; the district grade overstates school quality for this exact location.
- Market conditions: Rents rising (+2.8%/yr); 662 active listings in the ZIP; 11 comparable units currently listed for rent nearby; rentals at typical pace (median 14d on market — plan ~3-4 weeks tenant-placement turnaround); 3,402 units permitted in Volusia County in 2024 (681 in 5+ unit buildings).
Forward outlook
- Local home prices are declining (-3.0%/yr); year-one equity from $1k of loan paydown is wiped out by about $4k of value loss. Plan a longer hold.
- Volusia County population projected at +19% by 2050 — long-run rental-demand tailwind backs the buy-and-hold thesis.
Negotiation context
- Only 12 days on market — expect competitive offers; lowballing is unlikely to land.
- 3 sale attempts since 11y ago with the ask held roughly flat each time — persistent listings suggest the price (not the market) is what's stuck; bring a comps-based counter.
- Current owner paid $22k; list at $150k implies a 598% gain — meaningful room to come down on a strong offer.
Risks & watch-outs
- Watch-outs: built in 1957 — expect roof / HVAC / electrical / plumbing capex.
- Climate carrying-cost: severe wind risk, 99% chance of damaging wind over 30y; extreme-heat days projected 7→20/yr by 2055 (HVAC capex compounding) — expect insurance premiums to compound above CPI over the hold.
Questions for the listing agent
- Built in 1957 — when were the roof, HVAC, electrical panel, plumbing, and water heater last replaced?
- Is there a deadline driving the sale (1031 exchange, divorce, estate, relocation)? That informs how much negotiation room exists.
- Schools are D-rated, which usually means shorter tenancies and higher turnover. Who's the typical renter profile here, and what's been the actual vacancy rate?
- What's the average days-on-market for RENTAL listings here right now (not sales)? A rising rental-DOM trend means longer vacancies and softer asking-rent achievability than the comps imply.
- What's the recent tenant-quality profile in this submarket — average credit score on applications, eviction rate, late-payment / NSF rate, and stable-employment percentage? A property-management company in the area should have these aggregated.
- How much new for-sale + rental construction is in the pipeline within 1–3 miles? Heavy new supply typically softens prices + rents 12–24 months out; constrained supply supports both.
Investment metrics
- 1% rule
- 0.97% ✗
- Cap rate
- 7.83%
- Cash-on-cash
- 5.48%
- DSCR
- 1.24
- GRM
- 8.6
CMA / ARV
No comps found within radius.
Projected returns pro-forma
-3.0% appreciation · 2.82% rent growth · sell at horizon
- IRR
- -8.0%
- Equity multiple
- 0.71×
- Total profit
- $-12,374
- Equity at exit
- $22,365
- IRR
- 1.3%
- Equity multiple
- 1.09×
- Total profit
- $3,775
- Equity at exit
- $12,969
Cash invested: $42,000 (down + closing). Projections, not guarantees.
Landlord ↔ Tenant lean methodology
- Overall (STATE)
- 87 Strongly Landlord-Friendly
- State Florida
- 87 Strongly Landlord-Friendly · R+3
- County
- — inherits STATE
- City
- — inherits STATE
ZIP-level market 32724
- Rents YoY
- 2.8%
- Active inventory
- 662
- Price-to-rent
- 8.6×
Monthly cashflow live
- Estimated rent
- $1,450 high interval (Pro) →
- Mortgage (P&I)
- −$787
- Tax from tax record
- −$105 /mo · $1,256/yr
- Insurance
- −$62
- HOA
- −$0
- Vacancy / Maint / Mgmt
- −$305
- Net cashflow
- $192
Break-even live
UW: 25.0% down · 7.5% · 30yr · 1.5% tax · 5.0% vac · 8.0% maint · 8.0% mgmt
Financing live
Cash to close
- Down payment
- $37,500
- Closing costs
- $4,500
- Reserves months
- —
- Total cash needed
- —
Loan-product check · same deal, 3 products live
Conventional
25% down · 7.5% · 30yr
- Down + closing
- —
- Monthly P&I
- —
- Monthly cashflow
- —
- DSCR
- —
- Eligible?
- —
Personal DTI + credit; lowest rate.
DSCR
20% down · 8.5% · 30yr
- Down + closing
- —
- Monthly P&I
- —
- Monthly cashflow
- —
- DSCR
- —
- Eligible?
- —
No personal income docs; deal must DSCR.
Hard money
10% down · 12.0% · 12mo
- Down + closing
- —
- Monthly P&I
- —
- Monthly cashflow
- —
- DSCR
- —
- Eligible?
- —
Short-term bridge; refi at stabilization.
Rent comps 11 comps
| Address | Beds | Baths | Sqft | Rent | $/sqft | DOM | Units | Dist |
|---|---|---|---|---|---|---|---|---|
| 400 E Howry Ave Deland, FL | 1.0–2.0 | 1.0–2.0 | 956 | $1,995 | $2.09 | 11d | 25 | 0.25mi |
| 123 S Arlington Ave Unit C DeLand, FL | 1.0 | 1.0 | 450 | $1,150 | $2.56 | 11d | 1 | 0.38mi |
| 202 Luella Ct Apt 3 DeLand, FL | 1.0 | 1.0 | 610 | $1,250 | $2.05 | 14d | 1 | 0.64mi |
| 125 S Salisbury Ave Deland, FL | 2.0 | 1.0 | 625 | $1,200 | $1.92 | 14d | 2 | 0.92mi |
| 501 W Ohio Ave Deland, FL | 1.0 | 1.0 | 575 | $1,095 | $1.90 | 14d | 1 | 1.00mi |
| 501 W Ohio Ave Unit 19 DeLand, FL | 1.0 | 1.0 | 575 | $1,095 | $1.90 | 14d | 1 | 1.00mi |
| 501 W Ohio Ave Unit L501WO19 DeLand, FL | 1.0 | 1.0 | 575 | $1,095 | $1.90 | 23d | 1 | 1.00mi |
| 101 E New Hampshire Ave Deland, FL | 1.0 | 1.0 | 576 | $1,140 | $1.98 | 11d | 11 | 1.09mi |
| 1312 Water Willow Dr DeLand, FL | 1.0–2.0 | 1.0–2.0 | 785 | $1,324 | $1.69 | 23d | 1 | 1.28mi |
| 916 W New York Ave Deland, FL | 1.0–2.0 | 1.0 | 700 | $1,245 | $1.78 | 14d | 2 | 1.29mi |
| 300 Miller Rd DeLand, FL | 1.0–2.0 | 1.0–2.0 | 785 | $1,324 | $1.69 | 23d | 1 | 1.34mi |
Listing history 9 events
-
2026-06-15statusdays on market $150,000 Pending 12 DOM
-
2026-06-14days on market $150,000 Active 11 DOM
-
2026-06-10days on market $150,000 Active 8 DOM
-
2026-06-09days on market $150,000 Active 7 DOM
-
2026-06-08days on market $150,000 Active 6 DOM
-
2026-06-07days on market $150,000 Active 5 DOM
-
2026-06-05days on market $150,000 Active 2 DOM
-
2026-06-03remarks 699-char remark
-
2026-06-03$150,000 Active 1 DOM
ⓘ Source: listings_history table (triggers on properties + properties_extension) + one-shot
backfill from property_details.listing_events for pre-trigger history.
Tax reassessment forecast FL · Resets to sale price
- Current annual tax
- $1,256 · $105/mo
- Projected year-2 tax
- $1,256 · $105/mo
- Expected delta
- $0/yr ($0/mo · 0.0%)
ⓘ Screening estimate from a state-policy table — verify with the county assessor before closing.
Climate risk First Street
- Flood 1/10 Low FEMA zone X (unshaded) · 0% chance over 30 yrs
- Wildfire 1/10 Low
- Heat 9/10 Extreme 7 d/yr ≥107°F today · 20 d/yr by 30 yrs out
- Wind 9/10 Extreme 99% chance of damaging wind over 30 yrs
- Air quality 2/10 Low 1 unhealthy d/yr today · 1 by 30 yrs out
Nearby sold comps map
Loading sold comps map…
Walkable amenities ~0.75 mi
Loading nearby amenities…
Taxation est. · year 1
- Rental income
- $17,403
- − Mortgage interest
- −$8,402
- − Property taxes
- −$1,256
- − Insurance
- −$750
- − Repairs & maintenance
- −$1,392
- − Management
- −$1,392
- − Depreciation
- −$4,364
- Taxable loss
- −$153
- Est. tax savings @ 24.0%
- +$37
- After-tax cash flow
- $2,340/yr
For passive investors: Depreciation is non-cash, so a rental often shows a tax loss while cash-flowing — sheltering income. Rental losses are passive: they offset passive income freely, and up to $25,000/yr can offset ordinary (W-2) income if you actively participate and your MAGI is under $100k (phasing out to $0 by $150k); unused losses carry forward. On sale, claimed depreciation is recaptured at up to 25%, and gains may owe capital-gains tax (a 1031 exchange can defer both). Figures are a year-1 estimate at your 24.0% rate — not tax advice; consult a CPA.
Schools (NCES district)
- District
- Volusia
- NCES district ID
- 1201920
- Math proficiency
- 44% ▼ -9.00%
- Reading proficiency
- 49% ▼ -3.00%
- Median HH income
- $42,946
- Composite
- 39.2/100
- National rank
- #4019
- State rank
- #47 of 73 in FL
Livability — DeLand
- Score
- 68/100
- State rank
- #498
- US rank
- #9197
Category grades
Schools grade is shown separately in the Schools card above.
Census & demographics
- Census place
- DeLand, FL
- County
- Volusia County · 556,871 people
- City population
- 81,399
- Metro
- Deltona-Daytona Beach-Ormond Beach, FL
- Population (ZIP)
- 45,140
- Household income
- $73,592
- Rent vs Own
- Severe rent burden
- 942.0
Population outlook (Volusia County) Hauer SSP2
- Today (2025)
- 572,749 people
- By 2030
- 598,695 · +4.5%
- By 2040
- 644,880 · +12.6%
- By 2050
- 681,451 · +19.0%
- By 2075
- 759,957 · +32.7%
- By 2100
- 778,902 · +36.0%
Race, ethnicity, and origin ACS 2023
- Neighborhood character
- Predominantly White (71%)
- Race & ethnicity
- White 71% Hispanic / Latino 19% Two or more races 9% Black 6% Asian 1%
- Hispanic origin (detail)
- Mexican 9% Puerto Rican 5%
- Common ancestry
- Romanian 2% Slovak 2% Lithuanian 2%
- Foreign-born
- 10% · Canada, Jamaica
- Languages at home
- 83% English-only · Spanish 14% Other Indo-European 1% French/Haitian/Cajun 1%
Political lean MEDSL · Volusia
- 2024 margin
- Strong R (+21.8) · D 38.7% · R 60.5%
- 2008→2024 swing
- -27.4pp toward R · 2008: 5.7pp · 2024: -21.8pp
- All cycles
- 2024: R+21.8 2020: R+14.1 2016: R+13.1 2012: R+1.2 2008: D+5.7
Not yet ingested
- Civics
- —
Market trends
- HPI YoY
- ▼ -215.80%
- Current HPI
- 297.1837
- Rent YoY
- ▲ 2.82%
- Metro
- Deltona-Daytona Beach-Ormond Beach, FL
- State GDP YoY
- ▲ 3.28%
- F500 in state
- 36
Industry mix (Fortune 500 HQ in FL)
| Industry | F500 HQs | Revenue |
|---|---|---|
| Industrial Technology | 2 | $29B |
|
||
| Insurance | 2 | $17B |
|
||
| Retail | 1 | $60B |
|
||
| Technology Distribution | 1 | $58B |
|
||
| Homebuilding | 1 | $35B |
|
||
| Technology Manufacturing | 1 | $35B |
|
||
Price history
+200.0% since first listed10 events — show timeline
- 2026-06-02 Listed $150,000 Stellar MLS as Distributed by MLS Grid
- 2016-06-21 Listing Removed — Stellar MLS as Distributed by MLS Grid
- 2016-05-05 Price Changed $59,900 Stellar MLS as Distributed by MLS Grid
- 2016-04-12 Price Changed $64,900 Stellar MLS as Distributed by MLS Grid
- 2016-02-29 Price Changed $67,900 Stellar MLS as Distributed by MLS Grid
- 2016-02-06 Listed $79,900 Stellar MLS as Distributed by MLS Grid
- 2015-05-20 Sold (MLS) $21,500 Stellar MLS as Distributed by MLS Grid
- 2015-05-03 Pending — Stellar MLS as Distributed by MLS Grid
- 2015-04-25 Listed $34,900 Stellar MLS as Distributed by MLS Grid
- 2004-11-15 Sold (Public Records) $50,000 Public Records
Property tax history
+6.9%/yrLatest (2025): $1,256 · +2.7% YoY. Source: county tax records.
Cash-flow waterfall
monthlySold comps — $/sqft
last 12 mo · ≤1 miLoading sold comps…