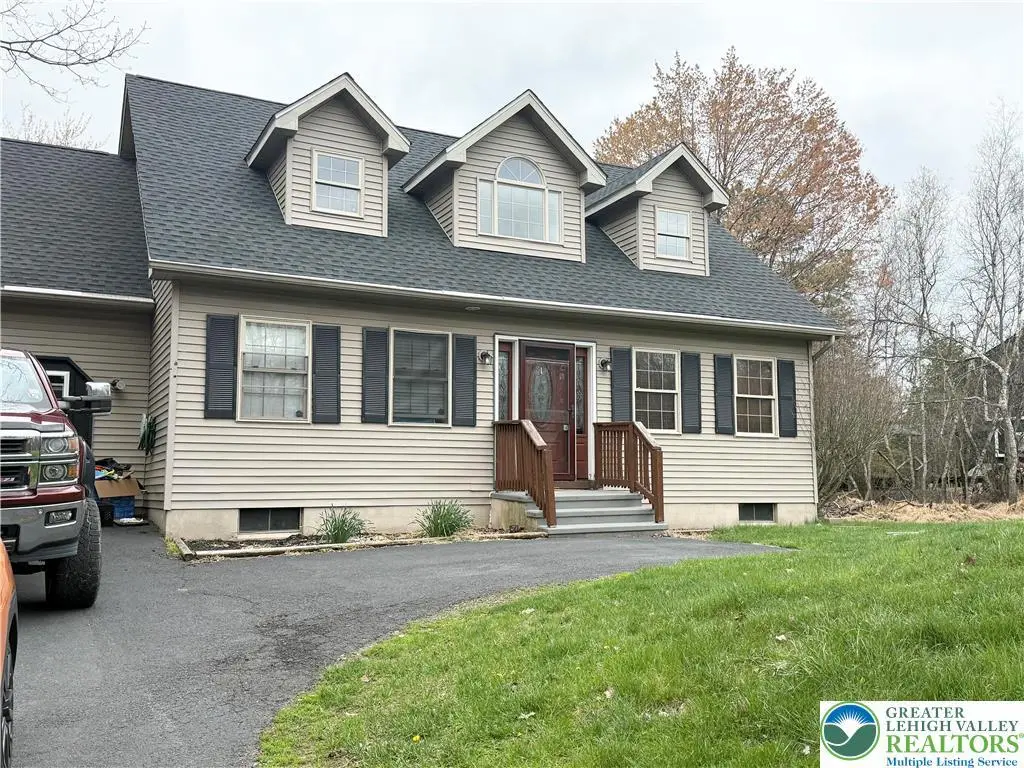
306 Cedar Dr · Emerald Lakes, PA
Flood risk 1/10 · Minimal
- FEMA flood zone
- X (unshaded)
- Chance of flooding over 30 yrs
- 0.0%
- Est. flood insurance / yr
- $507 – $1,088
Fire risk 3/10 · Minor
- Est. fire insurance / yr
- $511 – $949
Heat risk 2/10 · Minimal
- Hot days now (above 90°F)
- 7 days/yr
- Hot days in 30 yrs
- 15 days/yr
Wind risk 4/10 · Minor
- Chance of severe wind over 30 yrs
- 9.0%
Air-quality risk 2/10 · Minimal
- Unhealthy air days now
- 1 days/yr
- Unhealthy air days in 30 yrs
- 2 days/yr
Risk factors via First Street. Map © Google.
Why this score? — see what drove the C grade
The composite is a weighted blend of 9 inputs, each scored 0–100. Each bar is that input's sub-score; the figure is the points it added to the 100-point composite (weight × sub-score).
- Cash flow +16.3/30.0
- ARV discount +12.5/15.0
- DSCR +5.1/10.0
- 1% rule +4.5/10.0
- Appreciation +4.5/10.0
- Schools +4.0/10.0
- Livability +3.4/5.0
- Rent growth +2.5/5.0
- Condition / age +2.5/5.0
$299,900
🖨 Deal sheet 📄 Offer letter ✓ Due diligence
Listing remarks
Discover this charming Cape-style home nestled in the desirable Emerald Lakes community. This residence features a spacious and inviting layout, boasting 4 generously sized bedrooms and 2.5 well-appointed bathrooms, perfect for family living or entertaining guests. The living room is enhanced by a cozy gas fireplace, creating a warm ambiance for gatherings during cooler evenings. In addition to the main living areas, the home includes a large office or family/rec room, offering versatile space that can be tailored to your specific needs. The kitchen is a chef’s delight, equipped with ample storage and counter space, complemented by an inviting eat-in dining area where family meals can
Key facts
- 0.47 acre lot
- Parking
- Built 1995
Property features AI
Finance
- HOA & community: Annual association fee of $1,200
Exterior
- Parking: Driveway; Off-street parking
- Utilities: Well water; Septic tank
- Home design: Has a view; Above-grade finished living area present
- Construction: Vinyl siding; Asphalt/fiberglass roof; Crawl space basement with dirt floor; Year built unknown
- Exterior features: Deck; Flat lot with views
Interior
- Kitchen: Electric cooktop; Electric oven; Electric range; Microwave; Refrigerator; Dishwasher
- Bedrooms: Second-floor bedroom (13.4 x 19.0); Second-floor bedroom, walk-through (11.0 x 19.8); Second-floor bedroom (13.1 x 19.8)
- Bathrooms: Two full bathrooms; One half bathroom (newly remodeled)
- Heating & cooling: Electric baseboard heating; Ceiling fans; Wall air-conditioning units
- Interior features: Attic; Dining area; Main-level family room; Storage
- Laundry & utility: Main-level washer hookup; Main-level dryer hookup; Washer and dryer included; Electric water heater
Neighborhood map
What this means for you Summary
Snapshot
- This is a 4-bed/2.0-bath single-family listed at $300k.
Deal economics
- At list price, monthly cash flow is $167 ($2k/yr) — positive.
- The deal already cash-flows at list — no discount required.
- To meet the 1% rule (rent ≥ 1% of price), the offer needs to be $286k (4.8% below list).
- Recommended offer: $286k (4.8% below list) — sets the bar for 1% rule.
- Cap rate 7.0% vs local median 4.0% in Emerald Lakes — top-decile yield for the area; either an underpriced asset or a hidden risk that comps aren't pricing in. Stress-test before assuming the spread holds.
Location & tenants
- Location reads 67/100 on livability (#974 in PA) — a middle-class / working-renter tenant base. Strengths: crime A+, cost of living A+, housing A+; Watch: health & safety D, schools D-, amenities F.
- Pocono Mountain SD (rural): math 37% / reading 55% proficiency, ranked #245 of 539 in PA (top 46%) — families likely to look elsewhere, expect single-tenant / working-renter base with shorter leases.
- Market conditions: 107 active listings in the ZIP; 3 comparable units currently listed for rent nearby; rentals lingering (median 44d on market — plan ~5-8 weeks vacancy on turnover, expect pricing pressure); 100% of comp listings sitting > 30 days — soft ceiling on asking rent; 278 units permitted in Monroe County in 2024 (52 in 5+ unit buildings).
Forward outlook
- Local home prices are declining (-0.9%/yr); year-one equity from $2k of loan paydown is wiped out by about $3k of value loss. Plan a longer hold.
- Monroe County population projected at -11% by 2050 — secular population decline; favor cash flow + early exit over multi-decade hold.
Negotiation context
- It's been on market 51 days — a 3% lower offer ($291k) is reasonable based on typical stale-listing flexibility.
- 5 sale attempts since 4y ago; this cycle's ask has dropped $40k (12%) from the opening price — seller is motivated, your offer sets the floor, not the list.
- Current owner paid $155k; list at $300k implies a 93% gain — meaningful room to come down on a strong offer.
Questions for the listing agent
- It's been on market 51 days. Have you received any prior offers? Is the seller open to a 5% concession, seller financing, or rate buy-down credit?
- What does the HOA fee cover, when was the last increase, and are there any pending special assessments or reserve-fund shortfalls?
- Is there a deadline driving the sale (1031 exchange, divorce, estate, relocation)? That informs how much negotiation room exists.
- Schools are D-rated, which usually means shorter tenancies and higher turnover. Who's the typical renter profile here, and what's been the actual vacancy rate?
- What's the average days-on-market for RENTAL listings here right now (not sales)? A rising rental-DOM trend means longer vacancies and softer asking-rent achievability than the comps imply.
- What's the recent tenant-quality profile in this submarket — average credit score on applications, eviction rate, late-payment / NSF rate, and stable-employment percentage? A property-management company in the area should have these aggregated.
- How much new for-sale + rental construction is in the pipeline within 1–3 miles? Heavy new supply typically softens prices + rents 12–24 months out; constrained supply supports both.
Investment metrics
- 1% rule
- 0.95% ✗
- Cap rate
- 6.96%
- Cash-on-cash
- 2.39%
- DSCR
- 1.11
- GRM
- 8.8
CMA / ARV
- ARV (median comp)
- $337,404
- List price
- $299,900
- Delta
- -11.12%
- Verdict
- UNDERPRICED
- Comps
- 20 within 1.0 mi
Show comp detail 12 sales within ~0.75 mi
| Address | Dist | Beds/Ba | Sqft | Sold | Price | $/sf | Match |
|---|---|---|---|---|---|---|---|
| 1591 Clover Rd | 0.07mi | 4/2.0 | 1,938 (+8%) | 4mo | $332,500 | $172 | 81 |
| 255 Cedar Dr | 0.23mi | 3/2.0 (-1) | 1,828 (+2%) | 7mo | $765,000 | $418 | 76 |
| 144 Overland Dr | 0.31mi | 4/2.5 | 1,884 (+5%) | 7mo | $334,800 | $178 | 70 |
| 400 Clearview Dr | 0.29mi | 3/1.5 (-1) | 1,721 (-4%) | 4mo | $264,900 | $154 | 68 |
| 130 Granite Rd Rd | 0.46mi | 3/2.0 (-1) | 1,764 (-2%) | 3mo | $330,000 | $187 | 68 |
| 1138 Horizon Dr | 0.43mi | 4/2.0 | 1,591 (-12%) | 1mo | $435,000 | $273 | 60 |
| 106 Cinnamon Trl | 0.33mi | 3/2.0 (-1) | 1,576 (-12%) | 1mo | $270,000 | $171 | 58 |
| 195 Williams Ln | 0.70mi | 3/2.0 (-1) | 1,847 (+3%) | 4mo | $262,500 | $142 | 54 |
| 1025 Cricket Ln | 0.72mi | 3/2.0 (-1) | 1,916 (+6%) | 5mo | $305,000 | $159 | 46 |
| 111 Beaver Dam Rd | 0.70mi | 3/2.5 (-1) | 1,696 (-6%) | 9mo | $760,000 | $448 | 44 |
| 136 Tumbleweed Dr | 0.70mi | 3/2.0 (-1) | 1,696 (-6%) | 13mo | $525,000 | $310 | 42 |
| 112 S Clover Ct | 0.59mi | 3/2.0 (-1) | 1,589 (-12%) | 12mo | $293,000 | $184 | 38 |
Match score weights: distance 35% · size 25% · config 20% · recency 20%. Top-matched comps best support the ARV.
Projected returns pro-forma
-0.95% appreciation · 3.0% rent growth · sell at horizon
- IRR
- -3.0%
- Equity multiple
- 0.87×
- Total profit
- $-11,180
- Equity at exit
- $73,144
- IRR
- 3.7%
- Equity multiple
- 1.35×
- Total profit
- $29,340
- Equity at exit
- $77,448
Cash invested: $83,972 (down + closing). Projections, not guarantees.
Landlord ↔ Tenant lean methodology
- Overall (STATE)
- 62 Landlord-Friendly
- State Pennsylvania
- 62 Landlord-Friendly · EVEN
- County
- — inherits STATE
- City
- — inherits STATE
ZIP-level market 18334
- Home prices YoY
- -0.5%
- Active inventory
- 107
- Price-to-rent
- 8.8×
Monthly cashflow live
- Estimated rent
- $2,855 medium interval (Pro) →
- Mortgage (P&I)
- −$1,573
- Tax from tax record
- −$291 /mo · $3,489/yr
- Insurance
- −$125
- HOA
- −$100
- Vacancy / Maint / Mgmt
- −$600
- Net cashflow
- $167
Break-even live
UW: 25.0% down · 7.5% · 30yr · 1.5% tax · 5.0% vac · 8.0% maint · 8.0% mgmt
Financing live
Cash to close
- Down payment
- $74,975
- Closing costs
- $8,997
- Reserves months
- —
- Total cash needed
- —
Loan-product check · same deal, 3 products live
Conventional
25% down · 7.5% · 30yr
- Down + closing
- —
- Monthly P&I
- —
- Monthly cashflow
- —
- DSCR
- —
- Eligible?
- —
Personal DTI + credit; lowest rate.
DSCR
20% down · 8.5% · 30yr
- Down + closing
- —
- Monthly P&I
- —
- Monthly cashflow
- —
- DSCR
- —
- Eligible?
- —
No personal income docs; deal must DSCR.
Hard money
10% down · 12.0% · 12mo
- Down + closing
- —
- Monthly P&I
- —
- Monthly cashflow
- —
- DSCR
- —
- Eligible?
- —
Short-term bridge; refi at stabilization.
Rent comps 3 comps
| Address | Beds | Baths | Sqft | Rent | $/sqft | DOM | Units | Dist |
|---|---|---|---|---|---|---|---|---|
| 152 Granite Rd Long Pond, PA | 4.0 | 2.5 | 2624 | $3,300 | $1.26 | 44d | 1 | 0.43mi |
| 2267 Doe Dr Long Pond, PA | 4.0 | 3.0 | 2000 | $2,700 | $1.35 | 44d | 1 | 0.58mi |
| 2113 Wild Laurel Dr Long Pond, PA | 3.0 | 3.0 | 2200 | $2,500 | $1.14 | 44d | 1 | 0.61mi |
HOA detail
- Monthly dues
- $100 · $1,200/yr
- Likely covers
- gas
Listing history 31 events
-
2026-06-19days on market $299,900 Active 51 DOM
-
2026-06-18days on market $299,900 Active 50 DOM
-
2026-06-17days on market $299,900 Active 49 DOM
-
2026-06-16days on market $299,900 Active 48 DOM
-
2026-06-15pricedays on market $299,900 Active 47 DOM
-
2026-06-14days on market $315,000 Active 45 DOM
-
2026-06-13days on market $315,000 Active 44 DOM
-
2026-06-10days on market $315,000 Active 42 DOM
-
2026-06-09days on market $315,000 Active 41 DOM
-
2026-06-08days on market $315,000 Active 40 DOM
-
2026-06-07days on market $315,000 Active 39 DOM
-
2026-06-02days on market $315,000 Active 34 DOM
-
2026-06-01days on market $315,000 Active 33 DOM
-
2026-05-31days on market $315,000 Active 32 DOM
-
2026-05-30days on market $315,000 Active 31 DOM
-
2026-05-06price $329,900 1500-char remark
-
2026-04-30$339,900 Active 1500-char remark
-
2026-04-03historical
-
2026-04-02historical
-
2026-03-12price $345,000
-
2026-03-12price $345,000
-
2026-03-12price $345,000
-
2025-10-30price $389,900
-
2025-10-30price $389,900
-
2025-10-30price $389,900
-
2025-10-03$399,900 Active
-
2025-10-03$399,900 Active
-
2025-10-02$399,900 Active
-
2022-04-22$325,000
-
2009-02-17soldstatus $155,000
-
1996-09-16soldstatus $130,000
ⓘ Source: listings_history table (triggers on properties + properties_extension) + one-shot
backfill from property_details.listing_events for pre-trigger history.
Tax reassessment forecast PA · Partial reset (capped growth)
- Current annual tax
- $3,489 · $291/mo
- Projected year-2 tax
- $4,114 · $343/mo
- Expected delta
- +$625/yr (+$52/mo · 17.9%)
ⓘ Screening estimate from a state-policy table — verify with the county assessor before closing.
Climate risk First Street
- Flood 1/10 Low FEMA zone X (unshaded) · 0% chance over 30 yrs
- Wildfire 3/10 Moderate
- Heat 2/10 Low 7 d/yr ≥90°F today · 15 d/yr by 30 yrs out
- Wind 4/10 Moderate 9% chance of damaging wind over 30 yrs
- Air quality 2/10 Low 1 unhealthy d/yr today · 2 by 30 yrs out
Nearby sold comps map
Loading sold comps map…
Walkable amenities ~0.75 mi
Loading nearby amenities…
Taxation est. · year 1
- Rental income
- $34,261
- − Mortgage interest
- −$16,799
- − Property taxes
- −$3,489
- − Insurance
- −$1,500
- − Repairs & maintenance
- −$2,741
- − Management
- −$2,741
- − HOA
- −$1,200
- − Depreciation
- −$8,724
- Taxable loss
- −$2,933
- Est. tax savings @ 24.0%
- +$704
- After-tax cash flow
- $2,709/yr
For passive investors: Depreciation is non-cash, so a rental often shows a tax loss while cash-flowing — sheltering income. Rental losses are passive: they offset passive income freely, and up to $25,000/yr can offset ordinary (W-2) income if you actively participate and your MAGI is under $100k (phasing out to $0 by $150k); unused losses carry forward. On sale, claimed depreciation is recaptured at up to 25%, and gains may owe capital-gains tax (a 1031 exchange can defer both). Figures are a year-1 estimate at your 24.0% rate — not tax advice; consult a CPA.
Schools (NCES district)
- District
- Pocono Mountain SD
- NCES district ID
- 4219500
- Math proficiency
- 37% ▼ -5.00%
- Reading proficiency
- 55% ▲ 1.00%
- Median HH income
- $55,317
- Composite
- 39.91/100
- National rank
- #3856
- State rank
- #245 of 539 in PA
Livability — Emerald Lakes
- Score
- 67/100
- State rank
- #974
- US rank
- #10662
Category grades
Schools grade is shown separately in the Schools card above.
Census & demographics
- Census place
- Emerald Lakes, PA
- Population (ZIP)
- 4,907
Population outlook (Monroe County) Hauer SSP2
- Today (2025)
- 164,099 people
- By 2030
- 161,412 · -1.6%
- By 2040
- 154,616 · -5.8%
- By 2050
- 146,710 · -10.6%
- By 2075
- 140,830 · -14.2%
- By 2100
- 138,472 · -15.6%
Race, ethnicity, and origin ACS 2023
- Neighborhood character
- Majority White (64%)
- Race & ethnicity
- White 64% Hispanic / Latino 20% Two or more races 12% Black 9%
- Hispanic origin (detail)
- Puerto Rican 17%
- Common ancestry
- Romanian 6% Lithuanian 4% Iranian 4%
- Foreign-born
- 8% · Canada
- Languages at home
- 87% English-only · Spanish 10% Russian/Polish/Slavic 3%
Political lean MEDSL · Monroe
- 2024 margin
- Toss-up / Even · D 49.1% · R 49.9%
- 2008→2024 swing
- -17.1pp toward R · 2008: 16.3pp · 2024: -0.8pp
- All cycles
- 2024: R+0.8 2020: D+6.4 2016: D+0.3 2012: D+14.0 2008: D+16.3
Not yet ingested
- Civics
- —
Market trends
- HPI YoY
- ▼ -0.95%
- Current HPI
- 178.5307
- Rent YoY
- —
- Metro
- —
- State GDP YoY
- ▲ 1.68%
- F500 in state
- 34
Industry mix (Fortune 500 HQ in PA)
| Industry | F500 HQs | Revenue |
|---|---|---|
| Healthcare | 2 | $309B |
|
||
| Insurance | 2 | $27B |
|
||
| Telecommunications / Media | 1 | $124B |
|
||
| Industrial Distribution | 1 | $22B |
|
||
| Financial Services | 1 | $20B |
|
||
| Chemicals / Materials | 1 | $18B |
|
||
Price history
+130.7% since first listed18 events — show timeline
- 2026-06-15 Price Changed $299,900 GLVRMLS
- 2026-05-26 Price Changed $315,000 GLVRMLS
- 2026-05-06 Price Changed $329,900 GLVRMLS
- 2026-04-30 Listed $339,900 GLVRMLS
- 2026-04-03 Listing Removed — GLVRMLS
- 2026-04-02 Listing Removed — BRIGHT MLS
- 2026-03-12 Price Changed $345,000 BRIGHT MLS
- 2026-03-12 Price Changed $345,000 GLVRMLS
- 2026-03-12 Price Changed $345,000 PMAR
- 2025-10-30 Price Changed $389,900 BRIGHT MLS
- 2025-10-30 Price Changed $389,900 PMAR
- 2025-10-30 Price Changed $389,900 GLVRMLS
- 2025-10-03 Listed $399,900 BRIGHT MLS
- 2025-10-03 Listed $399,900 GLVRMLS
- 2025-10-02 Listed $399,900 PMAR
- 2022-04-22 Listed $325,000 PMAR
- 2009-02-17 Sold (Public Records) $155,000 Public Records
- 1996-09-16 Sold (Public Records) $130,000 Public Records
Property tax history
-2.4%/yrLatest (2026): $3,489 · +3.3% YoY. Source: county tax records.
Cash-flow waterfall
monthlySold comps — $/sqft
last 12 mo · ≤1 miLoading sold comps…