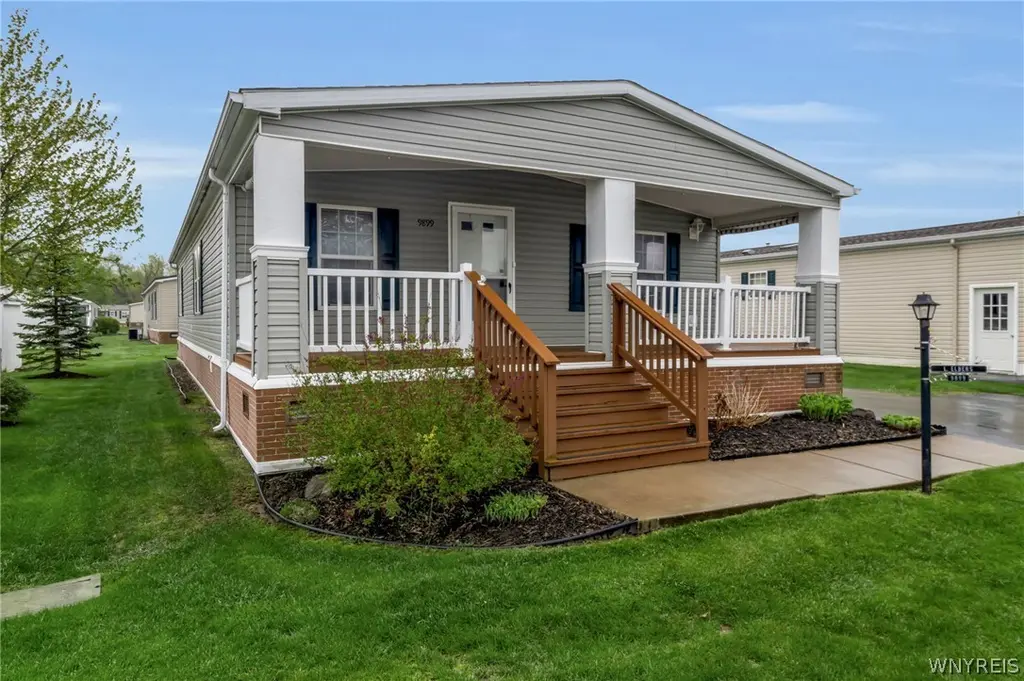
9899 Tobermory Ave · Clarence, NY
Flood risk No data
- FEMA flood zone
- —
- Chance of flooding over 30 yrs
- —
- Est. flood insurance / yr
- —
Fire risk No data
- Est. fire insurance / yr
- —
Heat risk No data
- Hot days now (above threshold)
- —
- Hot days in 30 yrs
- —
Wind risk No data
- Chance of severe wind over 30 yrs
- —
Air-quality risk No data
- Unhealthy air days now
- —
- Unhealthy air days in 30 yrs
- —
Risk factors via First Street. Map © Google.
Why this score? — see what drove the C+ grade
The composite is a weighted blend of 9 inputs, each scored 0–100. Each bar is that input's sub-score; the figure is the points it added to the 100-point composite (weight × sub-score).
- Cash flow +22.3/30.0
- ARV discount +13.7/15.0
- DSCR +7.2/10.0
- Schools +6.5/10.0
- 1% rule +5.2/10.0
- Livability +3.2/5.0
- Rent growth +2.5/5.0
- Condition / age +2.5/5.0
- Appreciation +0.0/10.0
$165,000
🖨 Deal sheet (PDF) 📄 Offer letter ✓ Due diligence
Listing remarks
Owner took great pride in her home, and it truly shows! This well-maintained home offers a bright, open floor plan and a beautifully updated kitchen filled with natural light, creating a warm and inviting feel throughout. A true highlight of the home is the amazing extra-large covered porch, perfect for your morning coffee, relaxing, or entertaining friends. The spacious primary bedroom offers two closets and a private primary bathroom complete with walk-in shower. Important updates have already been completed, including the furnace (2020), hot water tank (2023), central A/C (2023), and newer carpeting for added comfort. Outside, you’ll find an extra-long driveway and a larger shed of
Key facts
- Extra-long driveway
- Updated kitchen
- Library
Tags
Property features AI
Finance
- Financial info: Land lease amount: monthly fee required
- HOA & community: Clubhouse; Community kitchen; Located in a senior community; Land lease fee applies
Exterior
- Parking: No garage
- Utilities: Public water (connected); Electric with circuit breakers
- Home design: Single-story (1 story); Double-wide mobile home; Resale condition
- Construction: Vinyl siding; Asphalt roof; Existing (built previously)
- Exterior features: Covered porch; Blacktop driveway; Shed(s) / exterior storage
Interior
- Kitchen: Dishwasher; Gas oven; Gas range; Microwave; Refrigerator; Kitchen island; Eat-in kitchen; Breakfast bar
- Bedrooms: 2 main-level bedrooms
- Flooring: Carpet; Laminate; Varies
- Bathrooms: 2 full bathrooms (both on the main level)
- Heating & cooling: Gas heating with forced air; Central air conditioning
- Interior features: Breakfast bar; Ceiling fan(s); Eat-in kitchen; Separate/formal living room; Kitchen island; Open living/dining area; Primary bedroom with private bath; Primary on main level
- Laundry & utility: Washer; Dryer; Laundry on main level; Gas water heater
Neighborhood map
What this means for you Summary
Snapshot
- This is a 2-bed/2.0-bath manufactured listed at $165k.
Deal economics
- At list price, monthly cash flow is $273 ($3k/yr) — positive.
- The deal already cash-flows at list — no discount required.
- Meets the 1% rule at list price ($2k rent vs $165k).
- Recommended offer: $160k (3.0% below list) — sets the bar for market timing.
- Cap rate 8.3% vs local median 1.3% in Clarence — top-decile yield for the area; either an underpriced asset or a hidden risk that comps aren't pricing in. Stress-test before assuming the spread holds.
Location & tenants
- Location reads 65/100 on livability (#707 in NY) — a middle-class / working-renter tenant base. Strengths: schools A+, crime A+, housing A+; Watch: cost of living D+, amenities F, commute F.
- Clarence Central School District (suburban): math 70% / reading 76% proficiency, ranked #94 of 590 in NY (top 16%) — strong family-tenant draw, lease renewals of 3-5y typical; only 7% free/reduced lunch — higher-income household profile.
- Market conditions: 77 active listings in the ZIP; 1,244 units permitted in Erie County in 2024 (563 in 5+ unit buildings).
Forward outlook
- Local home prices are declining (-3.0%/yr); year-one equity from $1k of loan paydown is wiped out by about $5k of value loss. Plan a longer hold.
Negotiation context
- It's been on market 34 days — a 3% lower offer ($160k) is reasonable based on typical stale-listing flexibility.
Questions for the listing agent
- It's been on market 34 days. Have you received any prior offers? Is the seller open to a 3% concession, seller financing, or rate buy-down credit?
- Is there a deadline driving the sale (1031 exchange, divorce, estate, relocation)? That informs how much negotiation room exists.
- Schools are A-rated — typically a magnet for longer-tenancy family renters. What's the average tenant stay here, and is there a school-zone premium baked into asking?
- What's the average days-on-market for RENTAL listings here right now (not sales)? A rising rental-DOM trend means longer vacancies and softer asking-rent achievability than the comps imply.
- What's the recent tenant-quality profile in this submarket — average credit score on applications, eviction rate, late-payment / NSF rate, and stable-employment percentage? A property-management company in the area should have these aggregated.
- How much new for-sale + rental construction is in the pipeline within 1–3 miles? Heavy new supply typically softens prices + rents 12–24 months out; constrained supply supports both.
Investment metrics
- 1% rule
- 1.02% ✓
- Cap rate
- 8.28%
- Cash-on-cash
- 7.09%
- DSCR
- 1.32
- GRM
- 8.2
CMA / ARV
- ARV (on-the-fly)
- $191,160
- Comps found
- 5
Show comp detail 5 sales within ~0.75 mi
| Address | Dist | Beds/Ba | Sqft | Sold | Price | $/sf | Match |
|---|---|---|---|---|---|---|---|
| 9808 Tottenham Ave | 0.15mi | 2/2.0 | 1,728 (+7%) | 4mo | $152,500 | $88 | 78 |
| 9908 Limehouse Dr | 0.07mi | 3/2.0 (+1) | 1,674 (+3%) | 21mo | $198,000 | $118 | 69 |
| 9811 Kingsthorpe Ter | 0.17mi | 3/2.0 (+1) | 1,674 (+3%) | 17mo | $198,000 | $118 | 68 |
| 9837 Sandringham Dr | 0.12mi | 3/2.0 (+1) | 1,782 (+10%) | 19mo | $160,000 | $90 | 56 |
| 4597 Leytonstone Ave | 0.46mi | 2/2.0 | 1,421 (-12%) | 3mo | $255,000 | $179 | 56 |
Match score weights: distance 35% · size 25% · config 20% · recency 20%. Top-matched comps best support the ARV.
Projected returns pro-forma
-3.0% appreciation · 3.0% rent growth · sell at horizon
- IRR
- -5.5%
- Equity multiple
- 0.80×
- Total profit
- $-9,388
- Equity at exit
- $24,602
- IRR
- 4.2%
- Equity multiple
- 1.31×
- Total profit
- $14,096
- Equity at exit
- $14,266
Cash invested: $46,200 (down + closing). Projections, not guarantees.
Landlord ↔ Tenant lean methodology
- Overall (STATE)
- 15 Strongly Tenant-Friendly
- State New York
- 15 Strongly Tenant-Friendly · D+10
- County
- — inherits STATE
- City
- — inherits STATE
ZIP-level market 14031
- Home prices YoY
- -16.4%
- Active inventory
- 77
- Price-to-rent
- 8.2×
Monthly cashflow live
- Estimated rent
- $1,686 medium interval (Pro) →
- Mortgage (P&I)
- −$865
- Tax from tax record
- −$125 /mo · $1,498/yr
- Insurance
- −$69
- HOA
- −$0
- Vacancy / Maint / Mgmt
- −$354
- Net cashflow
- $273
Break-even live
Sensitivity live
| Price | -10% $366 | -5% $319 | +0% $273 | +5% $226 | +10% $179 |
|---|---|---|---|---|---|
| Rent | -10% $140 | -5% $206 | +0% $273 | +5% $339 | +10% $406 |
| Rate | -1.0pp $356 | -0.5pp $315 | base $273 | +0.5pp $230 | +1.0pp $187 |
UW: 25.0% down · 7.5% · 30yr · 1.5% tax · 5.0% vac · 8.0% maint · 8.0% mgmt
Financing live
Cash to close
- Down payment
- $41,250
- Closing costs
- $4,950
- Reserves months
- —
- Total cash needed
- —
Loan-product check · same deal, 3 products live
Conventional
25% down · 7.5% · 30yr
- Down + closing
- —
- Monthly P&I
- —
- Monthly cashflow
- —
- DSCR
- —
- Eligible?
- —
Personal DTI + credit; lowest rate.
DSCR
20% down · 8.5% · 30yr
- Down + closing
- —
- Monthly P&I
- —
- Monthly cashflow
- —
- DSCR
- —
- Eligible?
- —
No personal income docs; deal must DSCR.
Hard money
10% down · 12.0% · 12mo
- Down + closing
- —
- Monthly P&I
- —
- Monthly cashflow
- —
- DSCR
- —
- Eligible?
- —
Short-term bridge; refi at stabilization.
Listing history 16 events
-
2026-06-21days on market $165,000 Active 34 DOM
-
2026-06-18days on market $165,000 Active 31 DOM
-
2026-06-17days on market $165,000 Active 30 DOM
-
2026-06-16days on market $165,000 Active 29 DOM
-
2026-06-15days on market $165,000 Active 28 DOM
-
2026-06-13days on market $165,000 Active 26 DOM
-
2026-06-13days on market $165,000 Active 25 DOM
-
2026-06-10days on market $165,000 Active 23 DOM
-
2026-06-09days on market $165,000 Active 22 DOM
-
2026-06-08days on market $165,000 Active 21 DOM
-
2026-06-07days on market $165,000 Active 20 DOM
-
2026-06-03days on market $165,000 Active 16 DOM
-
2026-06-02days on market $165,000 Active 15 DOM
-
2026-06-01days on market $165,000 Active 14 DOM
-
2026-05-31days on market $165,000 Active 13 DOM
-
2026-05-18$165,000 Active
ⓘ Source: listings_history table (triggers on properties + properties_extension) + one-shot
backfill from property_details.listing_events for pre-trigger history.
Tax reassessment forecast NY · Partial reset (capped growth)
- Current annual tax
- $1,498 · $125/mo
- Projected year-2 tax
- $2,143 · $179/mo
- Expected delta
- +$645/yr (+$54/mo · 43.1%)
ⓘ Screening estimate from a state-policy table — verify with the county assessor before closing.
Nearby sold comps map
Loading sold comps map…
Walkable amenities ~0.75 mi
Loading nearby amenities…
Taxation est. · year 1
- Rental income
- $20,227
- − Mortgage interest
- −$9,243
- − Property taxes
- −$1,498
- − Insurance
- −$825
- − Repairs & maintenance
- −$1,618
- − Management
- −$1,618
- − Depreciation
- −$4,800
- Taxable income
- $625
- Est. tax owed @ 24.0%
- −$150
- After-tax cash flow
- $3,123/yr
For passive investors: Depreciation is non-cash, so a rental often shows a tax loss while cash-flowing — sheltering income. Rental losses are passive: they offset passive income freely, and up to $25,000/yr can offset ordinary (W-2) income if you actively participate and your MAGI is under $100k (phasing out to $0 by $150k); unused losses carry forward. On sale, claimed depreciation is recaptured at up to 25%, and gains may owe capital-gains tax (a 1031 exchange can defer both). Figures are a year-1 estimate at your 24.0% rate — not tax advice; consult a CPA.
Schools (NCES district)
- District
- Clarence Central School District
- NCES district ID
- 3607590
- Math proficiency
- 70% ▼ -9.00%
- Reading proficiency
- 76% ▲ 2.00%
- Median HH income
- $81,568
- Composite
- 64.85/100
- National rank
- #514
- State rank
- #94 of 590 in NY
Livability — Clarence
- Score
- 65/100
- State rank
- #707
- US rank
- #13415
Category grades
Schools grade is shown separately in the Schools card above.
Census & demographics
- Population (ZIP)
- 9,741
Population outlook (Erie County) Hauer SSP2
- Today (2025)
- 933,037 people
- By 2030
- 935,181 · +0.2%
- By 2040
- 928,531 · -0.5%
- By 2050
- 905,725 · -2.9%
- By 2075
- 834,037 · -10.6%
- By 2100
- 708,033 · -24.1%
Race, ethnicity, and origin ACS 2023
- Neighborhood character
- Predominantly White (88%)
- Race & ethnicity
- White 88% Two or more races 6% Hispanic / Latino 3%
- Common ancestry
- Romanian 13% Portuguese 2% Scotch-Irish 2%
- Foreign-born
- 7% · Canada
- Languages at home
- 96% English-only · Spanish 2% Russian/Polish/Slavic 1% Other Indo-European 1%
Political lean MEDSL · Erie
- 2024 margin
- Lean D (+9.7) · D 54.8% · R 45.2%
- 2008→2024 swing
- -7.9pp toward R · 2008: 17.5pp · 2024: 9.7pp
- All cycles
- 2024: D+9.7 2020: D+14.7 2016: D+4.8 2012: D+15.6 2008: D+17.5
Not yet ingested
- Civics
- —
Market trends
- HPI YoY
- ▼ -67.27%
- Current HPI
- 344.136
- Rent YoY
- —
- Metro
- —
- State GDP YoY
- ▲ 2.60%
- F500 in state
- 92
Industry mix (Fortune 500 HQ in NY)
| Industry | F500 HQs | Revenue |
|---|---|---|
| Financial Services | 10 | $950B |
|
||
| Consumer Goods | 9 | $162B |
|
||
| Insurance | 4 | $225B |
|
||
| Telecommunications | 2 | $144B |
|
||
| Pharmaceuticals | 2 | $112B |
|
||
| Media / Entertainment | 2 | $69B |
|
||
Price history
1 event — show timeline
- 2026-05-18 Listed $165,000 WNYREIS
Property tax history
+15.9%/yrLatest (2025): $1,498 · +0.3% YoY. Source: county tax records.
Cash-flow waterfall
monthlySold comps — $/sqft
last 12 mo · ≤1 miLoading sold comps…