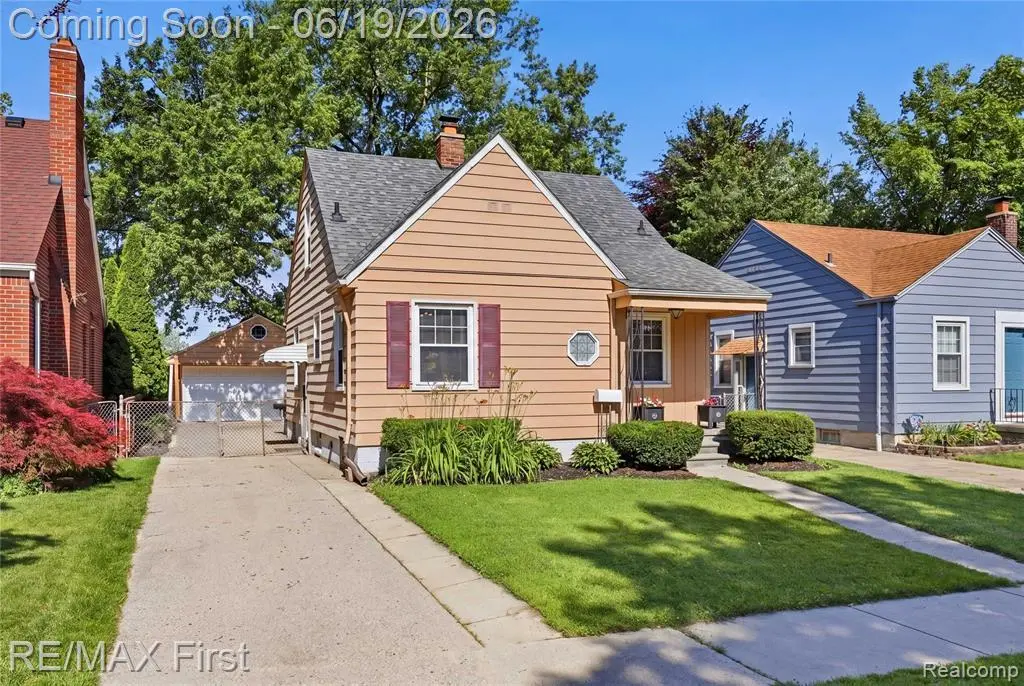
3250 Alice St · Dearborn, MI
Flood risk 1/10 · Minimal
- FEMA flood zone
- X (unshaded)
- Chance of flooding over 30 yrs
- 0.0%
- Est. flood insurance / yr
- $473 – $860
Fire risk 1/10 · Minimal
- Est. fire insurance / yr
- $784 – $1,456
Heat risk 3/10 · Minor
- Hot days now (above 98°F)
- 7 days/yr
- Hot days in 30 yrs
- 15 days/yr
Wind risk 2/10 · Minimal
- Chance of severe wind over 30 yrs
- —
Air-quality risk 3/10 · Minor
- Unhealthy air days now
- 2 days/yr
- Unhealthy air days in 30 yrs
- 4 days/yr
Risk factors via First Street. Map © Google.
Why this score? — see what drove the D grade
The composite is a weighted blend of 9 inputs, each scored 0–100. Each bar is that input's sub-score; the figure is the points it added to the 100-point composite (weight × sub-score).
- Cash flow +14.5/30.0
- ARV discount +7.2/15.0
- DSCR +4.4/10.0
- 1% rule +4.0/10.0
- Livability +4.0/5.0
- Rent growth +3.4/5.0
- Schools +2.8/10.0
- Condition / age +2.5/5.0
- Appreciation +0.0/10.0
$199,900
🖨 Deal sheet (PDF) 📄 Offer letter ✓ Due diligence
Listing remarks MLS
Quaint bungalow in great west Dearborn neighborhood. Newer carpet, cove ceilings, clean and well maintained. Basement PF w/ bath. Deep lot with 2 car detached garage and no neighbors behind. Occupancy could be sooner. C of O is ready for new owner.
Key facts
- New furnace
- Finished upper level
- Updated kitchen
Tags
Property features AI
Exterior
- Parking: Detached 2-car garage with electricity
- Utilities: Public water; Public sewer at street; Natural gas; Electric service (garage electric)
- Home design: Residential property; 1.5-story structure; Built in 1948; Basement foundation
- Construction: Aluminum siding; Basement (partially finished)
- Exterior features: Aluminum exterior; Fenced yard; Patio; Porch
Interior
- Kitchen: Ceramic floor; Kitchen approx. 9 x 14; Range/Oven; Microwave; Refrigerator; Dishwasher; Disposal
- Bedrooms: Bedroom 1 (entry level) with wood flooring, approx. 12 x 13; Bedroom 2 (entry level) with wood flooring, approx. 9 x 11; Bedroom 3 (second level) with laminate flooring, approx. 18 (width)
- Flooring: Wood flooring in primary rooms and main bath; Laminate flooring in one bedroom; Ceramic in kitchen; Linoleum in basement bathroom
- Bathrooms: 2 full bathrooms; Main-level bathroom with wood flooring, approx. 13 x 14; Basement bathroom with linoleum flooring, approx. 5 x 6
- Heating & cooling: Forced air heating; Natural gas heating fuel; Central air conditioning; Ceiling fan(s); Gas water heater
- Interior features: 6 total rooms; Partially finished basement
- Laundry & utility: Washer; Dryer
Neighborhood map
What this means for you Summary
Snapshot
- This is a 3-bed/1.0-bath single-family listed at $200k.
Deal economics
- At list price, monthly cash flow is $44 ($528/yr) — positive.
- The deal already cash-flows at list — no discount required.
- To meet the 1% rule (rent ≥ 1% of price), the offer needs to be $181k (9.5% below list).
- Recommended offer: $181k (9.5% below list) — sets the bar for 1% rule.
- Cap rate 6.6% vs local median 4.3% in Dearborn — top-decile yield for the area; either an underpriced asset or a hidden risk that comps aren't pricing in. Stress-test before assuming the spread holds.
Location & tenants
- Location reads 80/100 on livability (#84 in MI, #1,904 nationally) — a professional / high-income tenant draw. Strengths: commute A+, cost of living A+, housing A+; Watch: amenities D.
- Dearborn City School District (urban): math 26% / reading 39% proficiency, ranked #325 of 540 in MI (top 60%) — families likely to look elsewhere, expect single-tenant / working-renter base with shorter leases; 66% free/reduced lunch — lower-income household profile, screen leases tightly.
- Zoned schools: Whitmorebolles Elementary School (math 22% / reading 32%, grade F, #923 of 1,397 statewide, top 69%, 299 students, 69% FRL); Smith Middle School (math 24% / reading 40%, grade F, #317 of 493 statewide, top 65%, 465 students, 62% FRL); Edsel Ford High School (math 20% / reading 43%, grade F, #425 of 713 statewide, top 60%, 1,639 students, 68% FRL) — zoned schools at 67% FRL track the district average.
- Market conditions: Rents rising (+3.6%/yr); 152 active listings in the ZIP; 23 comparable units currently listed for rent nearby; rentals leasing fast (median 13d on market — plan ~1-2 weeks tenant-placement turnaround); solid renter incomes; 2,639 units permitted in Wayne County in 2024 (1,216 in 5+ unit buildings).
Forward outlook
- Local home prices are declining (-3.0%/yr); year-one equity from $1k of loan paydown is wiped out by about $6k of value loss. Plan a longer hold.
- Wayne County population projected at -17% by 2050 — secular population decline; favor cash flow + early exit over multi-decade hold.
Negotiation context
- Only 3 days on market — expect competitive offers; lowballing is unlikely to land.
- 8 sale attempts since 21y ago; this cycle's ask is 82% above the opening price — seller raised mid-cycle; expect resistance to lowballs.
- Current owner paid $105k; list at $200k implies a 91% gain — meaningful room to come down on a strong offer.
Risks & watch-outs
- Watch-outs: built in 1948 — expect roof / HVAC / electrical / plumbing capex.
Questions for the listing agent
- Built in 1948 — when were the roof, HVAC, electrical panel, plumbing, and water heater last replaced?
- Is there a deadline driving the sale (1031 exchange, divorce, estate, relocation)? That informs how much negotiation room exists.
- Schools are D-rated, which usually means shorter tenancies and higher turnover. Who's the typical renter profile here, and what's been the actual vacancy rate?
- The area grade is low — what's the realistic commute time and amenity access for the typical tenant pool here? Any planned neighborhood developments (good or bad) we should know about?
- What's the average days-on-market for RENTAL listings here right now (not sales)? A rising rental-DOM trend means longer vacancies and softer asking-rent achievability than the comps imply.
- What's the recent tenant-quality profile in this submarket — average credit score on applications, eviction rate, late-payment / NSF rate, and stable-employment percentage? A property-management company in the area should have these aggregated.
- How much new for-sale + rental construction is in the pipeline within 1–3 miles? Heavy new supply typically softens prices + rents 12–24 months out; constrained supply supports both.
Investment metrics
- 1% rule
- 0.90% ✗
- Cap rate
- 6.56%
- Cash-on-cash
- 0.94%
- DSCR
- 1.04
- GRM
- 9.2
CMA / ARV
- ARV (on-the-fly)
- $198,744
- Comps found
- 12
Show comp detail 12 sales within ~0.75 mi
| Address | Dist | Beds/Ba | Sqft | Sold | Price | $/sf | Match |
|---|---|---|---|---|---|---|---|
| 2931 Katherine St | 0.24mi | 3/2.0 | 1,197 (+2%) | 2mo | $262,500 | $219 | 80 |
| 3131 Mckinley St | 0.35mi | 3/1.0 | 1,110 (-6%) | 2mo | $200,000 | $180 | 72 |
| 21230 Audette St | 0.25mi | 4/2.0 (+1) | 1,248 (+6%) | 1mo | $202,500 | $162 | 68 |
| 20728 Carlysle St | 0.39mi | 3/1.0 | 1,087 (-8%) | 2mo | $185,000 | $170 | 67 |
| 4196 Clippert St | 0.62mi | 3/1.0 | 1,243 (+6%) | 2mo | $189,500 | $152 | 60 |
| 3020 Williams St | 0.15mi | 2/1.5 (-1) | 1,352 (+15%) | 2mo | $220,000 | $163 | 59 |
| 2829 Bennett St | 0.71mi | 3/1.0 | 1,244 (+6%) | 1mo | $209,900 | $169 | 57 |
| 4205 Katherine St | 0.65mi | 3/1.5 | 1,080 (-8%) | 1mo | $205,000 | $190 | 54 |
| 22923 Columbia St | 0.73mi | 3/3.0 | 1,100 (-6%) | 1mo | $229,000 | $208 | 46 |
| 4204 Hipp St | 0.70mi | 4/1.0 (+1) | 1,296 (+10%) | 1mo | $95,000 | $73 | 45 |
| 4204 Hipp St | 0.70mi | 4/1.0 (+1) | 1,296 (+10%) | 1mo | $95,000 | $73 | 45 |
| 4408 Gertrude St | 0.67mi | 3/1.0 | 1,000 (-15%) | 1mo | $155,000 | $155 | 42 |
Match score weights: distance 35% · size 25% · config 20% · recency 20%. Top-matched comps best support the ARV.
Projected returns pro-forma
-3.0% appreciation · 3.57% rent growth · sell at horizon
- IRR
- -14.1%
- Equity multiple
- 0.49×
- Total profit
- $-28,515
- Equity at exit
- $29,806
- IRR
- -4.4%
- Equity multiple
- 0.70×
- Total profit
- $-16,770
- Equity at exit
- $17,284
Cash invested: $55,972 (down + closing). Projections, not guarantees.
Landlord ↔ Tenant lean methodology
- Overall (STATE)
- 62 Landlord-Friendly
- State Michigan
- 62 Landlord-Friendly · EVEN
- County
- — inherits STATE
- City
- — inherits STATE
ZIP-level market 48124
- Rents YoY
- 3.6%
- Active inventory
- 152
- Price-to-rent
- 9.2×
Monthly cashflow live
- Estimated rent
- $1,809 high interval (Pro) →
- Mortgage (P&I)
- −$1,048
- Tax from tax record
- −$253 /mo · $3,038/yr
- Insurance
- −$83
- HOA
- −$0
- Vacancy / Maint / Mgmt
- −$380
- Net cashflow
- $44
Break-even live
Sensitivity live
| Price | -10% $157 | -5% $101 | +0% $44 | +5% $-13 | +10% $-69 |
|---|---|---|---|---|---|
| Rent | -10% $-99 | -5% $-27 | +0% $44 | +5% $115 | +10% $187 |
| Rate | -1.0pp $145 | -0.5pp $95 | base $44 | +0.5pp $-8 | +1.0pp $-60 |
UW: 25.0% down · 7.5% · 30yr · 1.5% tax · 5.0% vac · 8.0% maint · 8.0% mgmt
Financing live
Cash to close
- Down payment
- $49,975
- Closing costs
- $5,997
- Reserves months
- —
- Total cash needed
- —
Loan-product check · same deal, 3 products live
Conventional
25% down · 7.5% · 30yr
- Down + closing
- —
- Monthly P&I
- —
- Monthly cashflow
- —
- DSCR
- —
- Eligible?
- —
Personal DTI + credit; lowest rate.
DSCR
20% down · 8.5% · 30yr
- Down + closing
- —
- Monthly P&I
- —
- Monthly cashflow
- —
- DSCR
- —
- Eligible?
- —
No personal income docs; deal must DSCR.
Hard money
10% down · 12.0% · 12mo
- Down + closing
- —
- Monthly P&I
- —
- Monthly cashflow
- —
- DSCR
- —
- Eligible?
- —
Short-term bridge; refi at stabilization.
Rent comps 23 comps
| Address | Beds | Baths | Sqft | Rent | $/sqft | DOM | Units | Dist |
|---|---|---|---|---|---|---|---|---|
| 21337 Audette St Dearborn, MI | 3.0 | 1.0 | 964 | $1,850 | $1.92 | 45d | 1 | 0.25mi |
| 3620 Monroe St Dearborn, MI | 3.0 | 2.0 | 1100 | $1,800 | $1.64 | 12d | 1 | 0.32mi |
| 20728 Carlysle St Dearborn, MI | 3.0 | 1.0 | 1087 | $1,850 | $1.70 | 0d | 1 | 0.40mi |
| 2825 Queen St Dearborn, MI | 2.0 | 1.0 | 1000 | $1,299 | $1.30 | 45d | 1 | 0.80mi |
| 2823 Queen St Dearborn, MI | 3.0 | 2.0 | 1400 | $1,599 | $1.14 | 19d | 1 | 0.80mi |
| 4638 Gertrude St Dearborn Heights, MI | 3.0 | 1.0 | 1020 | $1,700 | $1.67 | 6d | 1 | 0.83mi |
| 4757 Dudley St Dearborn Heights, MI | 3.0 | 1.0 | 995 | $1,350 | $1.36 | 12d | 1 | 0.85mi |
| 4810 Campbell St Dearborn Heights, MI | 3.0 | 1.0 | 1000 | $1,700 | $1.70 | 0d | 1 | 0.86mi |
| 2631 Woodside St Dearborn, MI | 3.0 | 1.0 | 894 | $1,650 | $1.85 | 0d | 1 | 0.91mi |
| 4914 Gertrude St Dearborn Heights, MI | 2.0 | 1.0 | 908 | $1,230 | $1.35 | 19d | 1 | 0.93mi |
| 3901 Academy St Dearborn Heights, MI | 4.0 | 2.0 | 1400 | $2,100 | $1.50 | 0d | 1 | 0.97mi |
| 4934 McKinley St Dearborn Heights, MI | 3.0 | 1.0 | 1051 | $1,700 | $1.62 | 0d | 1 | 1.00mi |
| 22340 Park St Dearborn, MI | 2.0 | 1.0 | 1056 | $1,350 | $1.28 | 6d | 1 | 1.02mi |
| 4681 Weddell St Dearborn Heights, MI | 3.0 | 1.0 | 860 | $1,600 | $1.86 | 0d | 1 | 1.04mi |
| 4704 Jackson St Dearborn Heights, MI | 3.0 | 1.0 | 1000 | $1,500 | $1.50 | 23d | 1 | 1.08mi |
| 4631 Ziegler St Dearborn Heights, MI | 3.0 | 1.0 | 1050 | $1,650 | $1.57 | 45d | 1 | 1.09mi |
| 1008 S Military St Dearborn, MI | 2.0 | 1.5 | 1500 | $2,295 | $1.53 | 45d | 1 | 1.13mi |
| 22700 Garrison St Dearborn, MI | 1.0–2.0 | 1.0 | 780 | $1,550 | $1.99 | 45d | 2 | 1.27mi |
| 4481 Westpoint St Dearborn Heights, MI | 3.0 | 2.0 | 768 | $1,549 | $2.02 | 16d | 1 | 1.35mi |
| 24154 Dartmouth St Dearborn, MI | 2.0 | 1.0 | 950 | $1,275 | $1.34 | 16d | 1 | 1.41mi |
| 21954 Morley Ave #108 Dearborn, MI | 2.0 | 1.0 | 1000 | $1,750 | $1.75 | 26d | 1 | 1.44mi |
| 24442 Union St Dearborn, MI | 3.0 | 1.5 | 1000 | $1,900 | $1.90 | 0d | 1 | 1.49mi |
| 4565 Fleming St Dearborn Heights, MI | 3.0 | 1.0 | 1200 | $1,600 | $1.33 | 12d | 1 | 1.50mi |
Listing history 3 events
-
2026-06-21statusdays on market $199,900 Active 3 DOM
-
2026-06-17remarks 699-char remark
-
2026-06-17$199,900 Coming Soon 1 DOM
ⓘ Source: listings_history table (triggers on properties + properties_extension) + one-shot
backfill from property_details.listing_events for pre-trigger history.
Tax reassessment forecast MI · Partial reset (capped growth)
- Current annual tax
- $3,038 · $253/mo
- Projected year-2 tax
- $3,058 · $255/mo
- Expected delta
- +$20/yr (+$2/mo · 0.7%)
ⓘ Screening estimate from a state-policy table — verify with the county assessor before closing.
Climate risk First Street
- Flood 1/10 Low FEMA zone X (unshaded) · 0% chance over 30 yrs
- Wildfire 1/10 Low
- Heat 3/10 Moderate 7 d/yr ≥98°F today · 15 d/yr by 30 yrs out
- Wind 2/10 Low
- Air quality 3/10 Moderate 2 unhealthy d/yr today · 4 by 30 yrs out
Nearby sold comps map
Loading sold comps map…
Walkable amenities ~0.75 mi
Loading nearby amenities…
Taxation est. · year 1
- Rental income
- $21,703
- − Mortgage interest
- −$11,198
- − Property taxes
- −$3,038
- − Insurance
- −$1,000
- − Repairs & maintenance
- −$1,736
- − Management
- −$1,736
- − Depreciation
- −$5,815
- Taxable loss
- −$2,820
- Est. tax savings @ 24.0%
- +$677
- After-tax cash flow
- $1,205/yr
For passive investors: Depreciation is non-cash, so a rental often shows a tax loss while cash-flowing — sheltering income. Rental losses are passive: they offset passive income freely, and up to $25,000/yr can offset ordinary (W-2) income if you actively participate and your MAGI is under $100k (phasing out to $0 by $150k); unused losses carry forward. On sale, claimed depreciation is recaptured at up to 25%, and gains may owe capital-gains tax (a 1031 exchange can defer both). Figures are a year-1 estimate at your 24.0% rate — not tax advice; consult a CPA.
Schools (NCES district)
- District
- Dearborn City School District
- NCES district ID
- 2611600
- Math proficiency
- 26% ▼ -14.00%
- Reading proficiency
- 39% ▼ -8.00%
- Median HH income
- $46,884
- Composite
- 27.93/100
- National rank
- #6864
- State rank
- #325 of 540 in MI
Livability — Dearborn
- Score
- 80/100
- State rank
- #84
- US rank
- #1904
Category grades
Schools grade is shown separately in the Schools card above.
Census & demographics
- Census place
- Dearborn, MI
- County
- Wayne County · 1,562,939 people
- City population
- 86,476
- Metro
- Detroit-Warren-Dearborn, MI
- Population (ZIP)
- 34,479
- Household income
- $81,796
- Rent vs Own
- Severe rent burden
- 444.0
Population outlook (Wayne County) Hauer SSP2
- Today (2025)
- 1,675,273 people
- By 2030
- 1,620,300 · -3.3%
- By 2040
- 1,502,341 · -10.3%
- By 2050
- 1,384,039 · -17.4%
- By 2075
- 1,124,592 · -32.9%
- By 2100
- 881,193 · -47.4%
Race, ethnicity, and origin ACS 2023
- Neighborhood character
- Predominantly White (84%)
- Race & ethnicity
- White 84% Two or more races 7% Hispanic / Latino 5% Black 4%
- Hispanic origin (detail)
- Mexican 3%
- Common ancestry
- Romanian 12% Lithuanian 4% Slovak 3%
- Foreign-born
- 10% · Canada
- Languages at home
- 82% English-only · Arabic 12% Spanish 2% Other Indo-European 2%
Political lean MEDSL · Wayne
- 2024 margin
- Strong D (+29.0) · D 62.7% · R 33.7% · Other 3.6%
- 2008→2024 swing
- -20.5pp toward R · 2008: 49.5pp · 2024: 29.0pp
- All cycles
- 2024: D+29.0 2020: D+38.1 2016: D+37.3 2012: D+46.9 2008: D+49.5
Not yet ingested
- Civics
- —
Market trends
- HPI YoY
- ▼ -278.39%
- Current HPI
- 204.5229
- Rent YoY
- ▲ 3.57%
- Metro
- Detroit-Warren-Dearborn, MI
- State GDP YoY
- ▲ 1.37%
- F500 in state
- 28
Industry mix (Fortune 500 HQ in MI)
| Industry | F500 HQs | Revenue |
|---|---|---|
| Automotive Parts | 3 | $48B |
|
||
| Automotive | 2 | $372B |
|
||
| Chemicals | 1 | $45B |
|
||
| Automotive Retail | 1 | $29B |
|
||
| Healthcare / Medical Devices | 1 | $23B |
|
||
| Automotive Technology | 1 | $20B |
|
||
Price history
+40.3% since first listed23 events — show timeline
- 2026-06-17 Coming Soon $199,900 MiRealSource-MiMLS
- 2017-09-21 Sold (Public Records) $104,900 Public Records
- 2017-08-31 Sold (MLS) $104,900 REALCOMP
- 2017-08-31 Sold (MLS) $104,900 MiRealSource-MiMLS
- 2017-07-24 Pending — MiRealSource-MiMLS
- 2017-07-17 Relisted — MiRealSource-MiMLS
- 2017-07-07 Pending — MiRealSource-MiMLS
- 2017-07-05 Listed $109,900 REALCOMP
- 2017-07-05 Listed $109,900 MiRealSource-MiMLS
- 2012-01-27 Sold (Public Records) $68,400 Public Records
- 2011-12-26 Sold (MLS) $67,000 REALCOMP
- 2011-12-26 Sold (MLS) $67,000 MiRealSource-MiMLS
- 2011-11-12 Listing Removed — MiRealSource-MiMLS
- 2011-07-05 Listed $69,900 REALCOMP
- 2011-07-05 Listed $69,900 MiRealSource-MiMLS
- 2011-05-12 Sold (MLS) $28,710 REALCOMP
- 2011-05-12 Sold (MLS) $28,710 MiRealSource-MiMLS
- 2011-04-19 Listing Removed — MiRealSource-MiMLS
- 2011-04-14 Listed $28,710 REALCOMP
- 2011-04-14 Listed $28,710 MiRealSource-MiMLS
- 2005-09-07 Sold (Public Records) $142,500 Public Records
- 2005-07-07 Sold (MLS) $142,500 REALCOMP
- 2005-05-01 Listed $142,500 REALCOMP
Property tax history
+2.0%/yrLatest (2025): $3,038 · +2.3% YoY. Source: county tax records.
Cash-flow waterfall
monthlySold comps — $/sqft
last 12 mo · ≤1 miLoading sold comps…