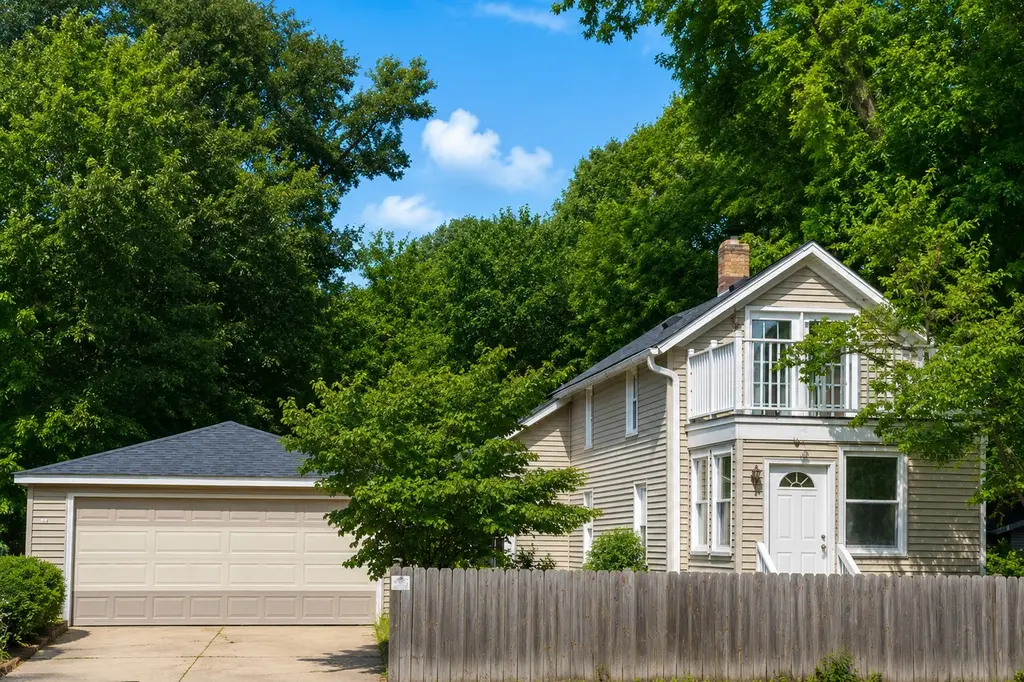
1111 Walnut St · Ottawa, IL
Flood risk 1/10 · Minimal
- FEMA flood zone
- X (unshaded)
- Chance of flooding over 30 yrs
- 0.0%
- Est. flood insurance / yr
- $473 – $860
Fire risk 3/10 · Minor
- Est. fire insurance / yr
- $804 – $1,492
Heat risk 3/10 · Minor
- Hot days now (above 103°F)
- 7 days/yr
- Hot days in 30 yrs
- 17 days/yr
Wind risk 2/10 · Minimal
- Chance of severe wind over 30 yrs
- 1.0%
Air-quality risk 2/10 · Minimal
- Unhealthy air days now
- 1 days/yr
- Unhealthy air days in 30 yrs
- 2 days/yr
Risk factors via First Street. Map © Google.
Why this score? — see what drove the B- grade
The composite is a weighted blend of 9 inputs, each scored 0–100. Each bar is that input's sub-score; the figure is the points it added to the 100-point composite (weight × sub-score).
- Cash flow +25.8/30.0
- ARV discount +14.7/15.0
- DSCR +8.6/10.0
- 1% rule +7.5/10.0
- Livability +3.9/5.0
- Schools +2.7/10.0
- Rent growth +2.5/5.0
- Condition / age +2.5/5.0
- Appreciation +0.0/10.0
$136,900
🖨 Deal sheet (PDF) 📄 Offer letter ✓ Due diligence
Listing remarks MLS
3BR 1 bath home w/ everything updated! New thermal windows, electrical, plumbing, furnace & C/A. , vinyl siding & lower level flooring. Home features upper level balcony, enclosed heated porch, 2 car garage & fenced yard. Home warranty included! Appliances negotiable. All dimensions are approximate.
Key facts
- 7,405 sq ft lot
- 2 garage spots
- Built 1920
Property features AI
Finance
- Other: Lot dimensions approximately 120 x 61 (less than 0.25 acre); Living area source: assessor; Parcel number available
- HOA & community: No master association fee required
Exterior
- Parking: 2 garage spaces (detached); 6 total parking spaces; Concrete driveway and off-street parking; Owned garage
- Utilities: Public water; Public sewer
- Home design: Detached single-family home; 1.5-story design; Fee simple ownership; Built over 100 years ago; Asphalt roof; Vinyl siding
- Construction: Vinyl siding construction; Asphalt roof; Built before 1978
- Exterior features: Balcony; Enclosed porch; Fenced yard
Interior
- Kitchen: Range; Microwave; Dishwasher; Refrigerator
- Bedrooms: 3 bedrooms total; Master bedroom on second level; Other bedrooms on main level
- Flooring: Carpet in enclosed porch and master bedroom; Wood laminate in living room, dining room, kitchen, bedroom 2 and bedroom 3
- Bathrooms: 1 full bathroom
- Heating & cooling: Natural gas forced air heating; Central air conditioning
- Interior features: First-floor bedroom; First-floor full bathroom; Separate dining room; Unfinished full basement; Ceiling fan(s)
- Laundry & utility: Washer and dryer included; Laundry on main level
Neighborhood map
What this means for you Summary
Snapshot
- This is a 3-bed/1.0-bath single-family listed at $137k.
Deal economics
- At list price, monthly cash flow is $333 ($4k/yr) — positive.
- The deal already cash-flows at list — no discount required.
- Meets the 1% rule at list price ($2k rent vs $137k).
- Cap rate 9.2% vs local median 3.1% in Ottawa — top-decile yield for the area; either an underpriced asset or a hidden risk that comps aren't pricing in. Stress-test before assuming the spread holds.
Location & tenants
- Location reads 77/100 on livability (#172 in IL, #3,175 nationally) — a middle-class / working-renter tenant base. Strengths: cost of living A+, health & safety A+, housing A; Watch: employment C-, schools D, amenities D.
- Ottawa Twp Hsd 140 (town): math 25% / reading 30% proficiency, ranked #545 of 919 in IL (top 59%) — low school quality limits family demand, transient renter base, plan for 1-2y turnover.
- Market conditions: 205 active listings in the ZIP; solid renter incomes; 82 units permitted in LaSalle County in 2024 (0 in 5+ unit buildings).
Forward outlook
- Local home prices are declining (-3.0%/yr); year-one equity from $946 of loan paydown is wiped out by about $4k of value loss. Plan a longer hold.
- LaSalle County population projected at -16% by 2050 — secular population decline; favor cash flow + early exit over multi-decade hold.
Negotiation context
- Only 6 days on market — expect competitive offers; lowballing is unlikely to land.
- 4 sale attempts since 18y ago with the ask held roughly flat each time — persistent listings suggest the price (not the market) is what's stuck; bring a comps-based counter.
- Current owner paid $80k; list at $137k implies a 71% gain — meaningful room to come down on a strong offer.
Risks & watch-outs
- Watch-outs: built in 1920 — expect roof / HVAC / electrical / plumbing capex.
Questions for the listing agent
- Built in 1920 — when were the roof, HVAC, electrical panel, plumbing, and water heater last replaced?
- Is there a deadline driving the sale (1031 exchange, divorce, estate, relocation)? That informs how much negotiation room exists.
- Schools are D-rated, which usually means shorter tenancies and higher turnover. Who's the typical renter profile here, and what's been the actual vacancy rate?
- What's the average days-on-market for RENTAL listings here right now (not sales)? A rising rental-DOM trend means longer vacancies and softer asking-rent achievability than the comps imply.
- What's the recent tenant-quality profile in this submarket — average credit score on applications, eviction rate, late-payment / NSF rate, and stable-employment percentage? A property-management company in the area should have these aggregated.
- How much new for-sale + rental construction is in the pipeline within 1–3 miles? Heavy new supply typically softens prices + rents 12–24 months out; constrained supply supports both.
Investment metrics
- 1% rule
- 1.25% ✓
- Cap rate
- 9.21%
- Cash-on-cash
- 10.42%
- DSCR
- 1.46
- GRM
- 6.7
CMA / ARV
- ARV (on-the-fly)
- $162,810
- Comps found
- 12
Show comp detail 12 sales within ~0.75 mi
| Address | Dist | Beds/Ba | Sqft | Sold | Price | $/sf | Match |
|---|---|---|---|---|---|---|---|
| 913 Canal St | 0.16mi | 3/1.0 | 1,296 (+8%) | 0mo | $185,000 | $143 | 80 |
| 1008 Pine St | 0.21mi | 3/1.5 | 1,272 (+6%) | 0mo | $197,000 | $155 | 79 |
| 1517 Lasalle St | 0.38mi | 3/1.0 | 1,230 (+2%) | 3mo | $150,000 | $122 | 76 |
| 1116 Chestnut St | 0.05mi | 2/1.0 (-1) | 1,096 (-9%) | 2mo | $120,000 | $109 | 76 |
| 823 W Madison St | 0.43mi | 2/1.0 (-1) | 1,203 (-0%) | 9mo | $98,300 | $82 | 67 |
| 639 W Madison St | 0.35mi | 2/1.0 (-1) | 1,315 (+9%) | 1mo | $59,000 | $45 | 63 |
| 1107 Sanger St | 0.48mi | 2/1.0 (-1) | 1,120 (-7%) | 1mo | $179,000 | $160 | 60 |
| 809 Poplar St | 0.44mi | 3/1.0 | 1,080 (-10%) | 6mo | $146,000 | $135 | 58 |
| 1913 Columbus St | 0.66mi | 3/1.0 | 1,164 (-4%) | 8mo | $130,000 | $112 | 57 |
| 522 E Superior St | 0.65mi | 3/2.0 | 1,288 (+7%) | 2mo | $94,000 | $73 | 52 |
| 1322 W Madison St | 0.64mi | 3/2.0 | 1,298 (+8%) | 8mo | $275,000 | $212 | 47 |
| 1000 Douglas St | 0.72mi | 3/2.5 | 1,288 (+7%) | 4mo | $216,000 | $168 | 46 |
Match score weights: distance 35% · size 25% · config 20% · recency 20%. Top-matched comps best support the ARV.
Projected returns pro-forma
-3.0% appreciation · 3.0% rent growth · sell at horizon
- IRR
- -0.6%
- Equity multiple
- 0.98×
- Total profit
- $-912
- Equity at exit
- $20,412
- IRR
- 9.1%
- Equity multiple
- 1.70×
- Total profit
- $26,788
- Equity at exit
- $11,837
Cash invested: $38,332 (down + closing). Projections, not guarantees.
Landlord ↔ Tenant lean methodology
- Overall (STATE)
- 43 Moderately Tenant-Leaning
- State Illinois
- 43 Moderately Tenant-Leaning · D+7
- County
- — inherits STATE
- City
- — inherits STATE
ZIP-level market 61350
- Home prices YoY
- -31.5%
- Active inventory
- 205
- Price-to-rent
- 6.7×
Monthly cashflow live
- Estimated rent
- $1,708 medium interval (Pro) →
- Mortgage (P&I)
- −$718
- Tax from tax record
- −$242 /mo · $2,898/yr
- Insurance
- −$57
- HOA
- −$0
- Vacancy / Maint / Mgmt
- −$359
- Net cashflow
- $333
Break-even live
Sensitivity live
| Price | -10% $410 | -5% $372 | +0% $333 | +5% $294 | +10% $255 |
|---|---|---|---|---|---|
| Rent | -10% $198 | -5% $265 | +0% $333 | +5% $400 | +10% $468 |
| Rate | -1.0pp $402 | -0.5pp $368 | base $333 | +0.5pp $297 | +1.0pp $261 |
UW: 25.0% down · 7.5% · 30yr · 1.5% tax · 5.0% vac · 8.0% maint · 8.0% mgmt
Financing live
Cash to close
- Down payment
- $34,225
- Closing costs
- $4,107
- Reserves months
- —
- Total cash needed
- —
Loan-product check · same deal, 3 products live
Conventional
25% down · 7.5% · 30yr
- Down + closing
- —
- Monthly P&I
- —
- Monthly cashflow
- —
- DSCR
- —
- Eligible?
- —
Personal DTI + credit; lowest rate.
DSCR
20% down · 8.5% · 30yr
- Down + closing
- —
- Monthly P&I
- —
- Monthly cashflow
- —
- DSCR
- —
- Eligible?
- —
No personal income docs; deal must DSCR.
Hard money
10% down · 12.0% · 12mo
- Down + closing
- —
- Monthly P&I
- —
- Monthly cashflow
- —
- DSCR
- —
- Eligible?
- —
Short-term bridge; refi at stabilization.
Listing history 7 events
-
2026-06-19days on market $136,900 Active 6 DOM
-
2026-06-18days on market $136,900 Active 5 DOM
-
2026-06-17days on market $136,900 Active 4 DOM
-
2026-06-16days on market $136,900 Active 3 DOM
-
2026-06-15days on market $136,900 Active 2 DOM
-
2026-06-14remarks 699-char remark
-
2026-06-14$136,900 Active 1 DOM
ⓘ Source: listings_history table (triggers on properties + properties_extension) + one-shot
backfill from property_details.listing_events for pre-trigger history.
Tax reassessment forecast IL · Partial reset (capped growth)
- Current annual tax
- $2,898 · $242/mo
- Projected year-2 tax
- $3,003 · $250/mo
- Expected delta
- +$105/yr (+$9/mo · 3.6%)
ⓘ Screening estimate from a state-policy table — verify with the county assessor before closing.
Climate risk First Street
- Flood 1/10 Low FEMA zone X (unshaded) · 0% chance over 30 yrs
- Wildfire 3/10 Moderate
- Heat 3/10 Moderate 7 d/yr ≥103°F today · 17 d/yr by 30 yrs out
- Wind 2/10 Low 100% chance of damaging wind over 30 yrs
- Air quality 2/10 Low 1 unhealthy d/yr today · 2 by 30 yrs out
Nearby sold comps map
Loading sold comps map…
Walkable amenities ~0.75 mi
Loading nearby amenities…
Taxation est. · year 1
- Rental income
- $20,497
- − Mortgage interest
- −$7,669
- − Property taxes
- −$2,898
- − Insurance
- −$684
- − Repairs & maintenance
- −$1,640
- − Management
- −$1,640
- − Depreciation
- −$3,983
- Taxable income
- $1,984
- Est. tax owed @ 24.0%
- −$476
- After-tax cash flow
- $3,519/yr
For passive investors: Depreciation is non-cash, so a rental often shows a tax loss while cash-flowing — sheltering income. Rental losses are passive: they offset passive income freely, and up to $25,000/yr can offset ordinary (W-2) income if you actively participate and your MAGI is under $100k (phasing out to $0 by $150k); unused losses carry forward. On sale, claimed depreciation is recaptured at up to 25%, and gains may owe capital-gains tax (a 1031 exchange can defer both). Figures are a year-1 estimate at your 24.0% rate — not tax advice; consult a CPA.
Schools (NCES district)
- District
- Ottawa Twp Hsd 140
- NCES district ID
- 1730330
- Math proficiency
- 25% ▼ -3.00%
- Reading proficiency
- 30% ▼ -4.00%
- Median HH income
- $47,828
- Composite
- 26.85/100
- National rank
- #12528
- State rank
- #545 of 919 in IL
Livability — Ottawa
- Score
- 77/100
- State rank
- #172
- US rank
- #3175
Category grades
Schools grade is shown separately in the Schools card above.
Census & demographics
- Census place
- Ottawa, IL
- County
- La Salle County · 41,676 people
- City population
- 23,713
- Metro
- Ottawa, IL
- Population (ZIP)
- 23,713
- Household income
- $77,921
- Rent vs Own
- Severe rent burden
- 628.0
Population outlook (LaSalle County) Hauer SSP2
- Today (2025)
- 107,080 people
- By 2030
- 104,196 · -2.7%
- By 2040
- 97,413 · -9.0%
- By 2050
- 90,294 · -15.7%
- By 2075
- 76,252 · -28.8%
- By 2100
- 61,339 · -42.7%
Race, ethnicity, and origin ACS 2023
- Neighborhood character
- Predominantly White (85%)
- Race & ethnicity
- White 85% Hispanic / Latino 9% Two or more races 4% Black 2%
- Hispanic origin (detail)
- Mexican 7%
- Common ancestry
- Romanian 6% Portuguese 5% Lithuanian 2%
- Foreign-born
- 2% · Canada
- Languages at home
- 95% English-only · Spanish 3%
Political lean MEDSL · LaSalle
- 2024 margin
- R (+18.5) · D 40.1% · R 58.6% · Other 1.3%
- 2008→2024 swing
- -29.6pp toward R · 2008: 11.1pp · 2024: -18.5pp
- All cycles
- 2024: R+18.5 2020: R+14.3 2016: R+14.4 2012: R+0.4 2008: D+11.1
Not yet ingested
- Civics
- —
Market trends
- HPI YoY
- ▼ -84.46%
- Current HPI
- 183.6833
- Rent YoY
- —
- Metro
- Ottawa, IL
- State GDP YoY
- ▲ 1.59%
- F500 in state
- 60
Industry mix (Fortune 500 HQ in IL)
| Industry | F500 HQs | Revenue |
|---|---|---|
| Insurance | 4 | $201B |
|
||
| Consumer Goods | 4 | $87B |
|
||
| Industrial Machinery | 3 | $64B |
|
||
| Healthcare | 2 | $55B |
|
||
| Retail / Pharmacy | 1 | $148B |
|
||
| Agriculture / Food | 1 | $86B |
|
||
Price history
+153.5% since first listed15 events — show timeline
- 2026-06-12 Listed $136,900 MRED as Distributed by MLS Grid
- 2024-10-02 Listing Removed — MRED as Distributed by MLS Grid
- 2024-08-28 Price Changed — MRED as Distributed by MLS Grid
- 2024-07-30 Price Changed — MRED as Distributed by MLS Grid
- 2024-07-10 Relisted — MRED as Distributed by MLS Grid
- 2024-07-03 Contingent — MRED as Distributed by MLS Grid
- 2024-06-24 Listed — MRED as Distributed by MLS Grid
- 2008-09-02 Sold (Public Records) $80,000 Public Records
- 2008-08-29 Sold (MLS) $80,000 MRED as Distributed by MLS Grid
- 2008-08-27 Listing Removed — MRED as Distributed by MLS Grid
- 2008-07-21 Contingent — MRED as Distributed by MLS Grid
- 2008-06-30 Price Changed $84,900 MRED as Distributed by MLS Grid
- 2008-04-08 Listed $89,900 MRED as Distributed by MLS Grid
- 1996-08-09 Sold (Public Records) $54,000 Public Records
- 1996-08-09 Sold (Public Records) $54,000 Public Records
Property tax history
+4.3%/yrLatest (2024): $2,898 · +9.3% YoY. Source: county tax records.
Cash-flow waterfall
monthlySold comps — $/sqft
last 12 mo · ≤1 miLoading sold comps…