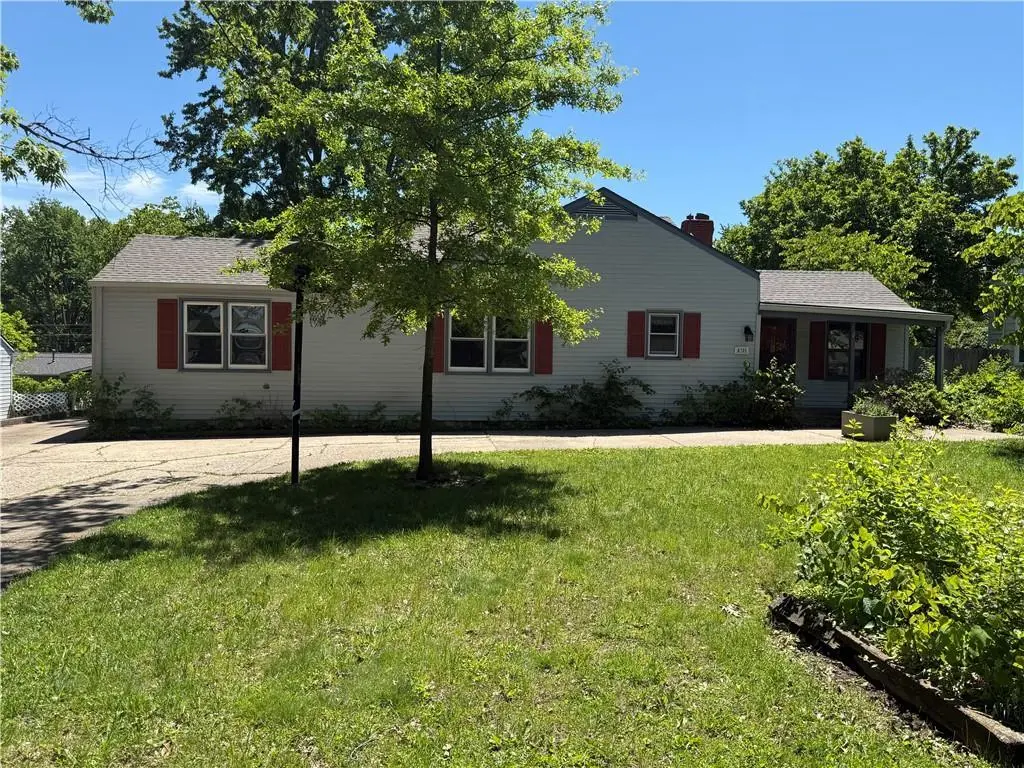
6701 W 77th Ter · Overland Park, KS
Flood risk 1/10 · Minimal
- FEMA flood zone
- X (unshaded)
- Chance of flooding over 30 yrs
- 0.0%
- Est. flood insurance / yr
- $473 – $860
Fire risk 1/10 · Minimal
- Est. fire insurance / yr
- $1,154 – $2,142
Heat risk 4/10 · Minor
- Hot days now (above 106°F)
- 7 days/yr
- Hot days in 30 yrs
- 17 days/yr
Wind risk 2/10 · Minimal
- Chance of severe wind over 30 yrs
- —
Air-quality risk 2/10 · Minimal
- Unhealthy air days now
- 2 days/yr
- Unhealthy air days in 30 yrs
- 2 days/yr
Risk factors via First Street. Map © Google.
Why this score? — see what drove the C+ grade
The composite is a weighted blend of 9 inputs, each scored 0–100. Each bar is that input's sub-score; the figure is the points it added to the 100-point composite (weight × sub-score).
- Cash flow +20.5/30.0
- ARV discount +15.0/15.0
- DSCR +6.5/10.0
- 1% rule +5.4/10.0
- Livability +4.0/5.0
- Schools +3.8/10.0
- Rent growth +3.7/5.0
- Condition / age +2.5/5.0
- Appreciation +0.0/10.0
$250,000
🖨 Deal sheet 📄 Offer letter ✓ Due diligence
Listing remarks
Charming and well-loved 1.5-story home in the heart of Overland Park, offering a fantastic location with exceptional walkability to Downtown Overland Park, the Farmers Market, local dining, shops, parks, and year-round community events. Nestled beneath a beautiful mature tree canopy and located in the highly desirable Shawnee Mission School District, this home combines timeless character with everyday convenience. Inside, the bright and inviting living room features a cozy fireplace, an atrium window that fills the space with natural light, and direct access to the backyard. The formal dining room showcases built-in shelving integrated with an exposed red brick accent wall, adding warmth an
Key facts
- Mature tree canopy
- Bright living room
- Atrium window
Tags
Property features AI
Exterior
- Parking: Attached and detached garage options; 2-car garage
- Utilities: Public water; Public sewer; Cable available, fiber available, high-speed internet available
- Home design: Single family residence; 1.5-story floor plan; North-facing
- Construction: Vinyl siding; Composition roof; Approximately 76–100 years old; Below-grade finished area (basement) present
- Exterior features: Fixer-up opportunity; Partial fencing; City lot
Interior
- Kitchen: Cooktop; Built-in oven; Dishwasher; Garbage disposal; Pantry; Formal dining area
- Bedrooms: 4 bedrooms (some on second level, some on main level)
- Flooring: Carpet; Wood flooring
- Bathrooms: 2 full bathrooms; Main-level bathroom with shower over tub; Second-level bathroom with shower only
- Heating & cooling: Natural gas heating; Electric cooling (central air)
- Interior features: Ceiling fans; Smart thermostat; Window coverings; Finished basement with egress window(s); Gas-starter fireplace (1)
- Laundry & utility: Laundry in basement
Neighborhood map
What this means for you Summary
Snapshot
- This is a 4-bed/2.0-bath single-family listed at $250k.
Deal economics
- At list price, monthly cash flow is $331 ($4k/yr) — positive.
- The deal already cash-flows at list — no discount required.
- Meets the 1% rule at list price ($3k rent vs $250k).
- Cap rate 7.9% vs local median 3.9% in Overland Park — top-decile yield for the area; either an underpriced asset or a hidden risk that comps aren't pricing in. Stress-test before assuming the spread holds.
Location & tenants
- Location reads 80/100 on livability (#16 in KS, #1,851 nationally) — a professional / high-income tenant draw. Strengths: employment A+, housing A+, crime B; Watch: health & safety C-, commute D+.
- Shawnee Mission Pub Schools (suburban): math 38% / reading 46% proficiency, ranked #22 of 169 in KS (top 13%) — families likely to look elsewhere, expect single-tenant / working-renter base with shorter leases.
- Zoned schools: Tomahawk Elem (math 32% / reading 52%, grade F, #273 of 684 statewide, top 45%, 290 students, 30% FRL) — zoned schools at 30% FRL track the district average.
- Market conditions: Rents rising fast (+4.8%/yr); 70 active listings in the ZIP; 10 comparable units currently listed for rent nearby; rentals at typical pace (median 24d on market — plan ~3-4 weeks tenant-placement turnaround); solid renter incomes; 2,969 units permitted in Johnson County in 2024 (1,066 in 5+ unit buildings).
- This rent runs 41% of the median local income ($76k/yr) — at the standard rent-burdened threshold; future hikes will face affordability resistance.
Forward outlook
- Local home prices are declining (-3.0%/yr); year-one equity from $2k of loan paydown is wiped out by about $8k of value loss. Plan a longer hold.
- Johnson County population projected at +27% by 2050 — long-run rental-demand tailwind backs the buy-and-hold thesis.
Negotiation context
- Only 1 days on market — expect competitive offers; lowballing is unlikely to land.
Risks & watch-outs
- Watch-outs: built in 1941 — expect roof / HVAC / electrical / plumbing capex.
Questions for the listing agent
- Built in 1941 — when were the roof, HVAC, electrical panel, plumbing, and water heater last replaced?
- Is there a deadline driving the sale (1031 exchange, divorce, estate, relocation)? That informs how much negotiation room exists.
- Schools are B-rated — typically a magnet for longer-tenancy family renters. What's the average tenant stay here, and is there a school-zone premium baked into asking?
- What's the average days-on-market for RENTAL listings here right now (not sales)? A rising rental-DOM trend means longer vacancies and softer asking-rent achievability than the comps imply.
- What's the recent tenant-quality profile in this submarket — average credit score on applications, eviction rate, late-payment / NSF rate, and stable-employment percentage? A property-management company in the area should have these aggregated.
- How much new for-sale + rental construction is in the pipeline within 1–3 miles? Heavy new supply typically softens prices + rents 12–24 months out; constrained supply supports both.
Investment metrics
- 1% rule
- 1.04% ✓
- Cap rate
- 7.88%
- Cash-on-cash
- 5.68%
- DSCR
- 1.25
- GRM
- 8.0
CMA / ARV
- ARV (on-the-fly)
- $436,932
- Comps found
- 12
Show comp detail 12 sales within ~0.75 mi
| Address | Dist | Beds/Ba | Sqft | Sold | Price | $/sf | Match |
|---|---|---|---|---|---|---|---|
| 6701 W 77th Ter | 0.00mi | 4/2.0 | 2,106 (+10%) | 0mo | $250,000 | $119 | 82 |
| 7809 Lamar Ave | 0.28mi | 3/3.0 (-1) | 1,992 (+4%) | 5mo | $435,000 | $218 | 66 |
| 5709 W 78th St | 0.59mi | 3/1.5 (-1) | 1,904 (-0%) | 0mo | $415,000 | $218 | 65 |
| 7832 Tomahawk Rd | 0.34mi | 3/1.5 (-1) | 1,651 (-14%) | 0mo | $379,000 | $230 | 55 |
| 7745 Reeds Rd | 0.68mi | 3/2.0 (-1) | 1,985 (+4%) | 4mo | $479,999 | $242 | 53 |
| 8100 Beverly Dr | 0.57mi | 3/2.0 (-1) | 1,782 (-7%) | 6mo | $495,000 | $278 | 52 |
| 7237 Floyd St | 0.69mi | 3/2.0 (-1) | 2,009 (+5%) | 4mo | $370,000 | $184 | 51 |
| 5904 W 79th St | 0.48mi | 3/2.0 (-1) | 1,722 (-10%) | 7mo | $405,000 | $235 | 51 |
| 7315 Dearborn St | 0.71mi | 3/2.0 (-1) | 1,994 (+4%) | 6mo | $399,000 | $200 | 49 |
| 8025 Tomahawk Rd | 0.53mi | 3/3.5 (-1) | 2,084 (+9%) | 2mo | $525,000 | $252 | 47 |
| 5919 W 74th St | 0.64mi | 3/2.0 (-1) | 1,664 (-13%) | 7mo | $339,000 | $204 | 38 |
| 5715 W 81st St | 0.72mi | 4/2.0 | 1,634 (-14%) | 6mo | $375,000 | $229 | 37 |
Match score weights: distance 35% · size 25% · config 20% · recency 20%. Top-matched comps best support the ARV.
Projected returns pro-forma
-3.0% appreciation · 4.79% rent growth · sell at horizon
- IRR
- -5.5%
- Equity multiple
- 0.79×
- Total profit
- $-14,588
- Equity at exit
- $37,276
- IRR
- 6.2%
- Equity multiple
- 1.50×
- Total profit
- $34,999
- Equity at exit
- $21,615
Cash invested: $70,000 (down + closing). Projections, not guarantees.
Landlord ↔ Tenant lean methodology
- Overall (STATE)
- 83 Strongly Landlord-Friendly
- State Kansas
- 83 Strongly Landlord-Friendly · R+10
- County
- — inherits STATE
- City
- — inherits STATE
ZIP-level market 66204
- Rents YoY
- 4.8%
- Active inventory
- 70
- Price-to-rent
- 8.0×
Monthly cashflow live
- Estimated rent
- $2,611 high interval (Pro) →
- Mortgage (P&I)
- −$1,311
- Tax from tax record
- −$316 /mo · $3,791/yr
- Insurance
- −$104
- HOA
- −$0
- Vacancy / Maint / Mgmt
- −$548
- Net cashflow
- $331
Break-even live
UW: 25.0% down · 7.5% · 30yr · 1.5% tax · 5.0% vac · 8.0% maint · 8.0% mgmt
Financing live
Cash to close
- Down payment
- $62,500
- Closing costs
- $7,500
- Reserves months
- —
- Total cash needed
- —
Loan-product check · same deal, 3 products live
Conventional
25% down · 7.5% · 30yr
- Down + closing
- —
- Monthly P&I
- —
- Monthly cashflow
- —
- DSCR
- —
- Eligible?
- —
Personal DTI + credit; lowest rate.
DSCR
20% down · 8.5% · 30yr
- Down + closing
- —
- Monthly P&I
- —
- Monthly cashflow
- —
- DSCR
- —
- Eligible?
- —
No personal income docs; deal must DSCR.
Hard money
10% down · 12.0% · 12mo
- Down + closing
- —
- Monthly P&I
- —
- Monthly cashflow
- —
- DSCR
- —
- Eligible?
- —
Short-term bridge; refi at stabilization.
Rent comps 10 comps
| Address | Beds | Baths | Sqft | Rent | $/sqft | DOM | Units | Dist |
|---|---|---|---|---|---|---|---|---|
| 7405 W 74th St Overland Park, KS | 3.0 | 3.0 | 2272 | $3,100 | $1.36 | 14d | 1 | 0.67mi |
| 7405 W 74th St Overland Park, KS | 3.0 | 3.0 | 2272 | $3,100 | $1.36 | 23d | 1 | 0.67mi |
| 7512 Newton St Overland Park, KS | 3.0 | 2.0 | 1295 | $2,095 | $1.62 | 23d | 1 | 0.71mi |
| 7335 Nall Ave Prairie Village, KS | 4.0 | 2.0 | 1486 | $2,695 | $1.81 | 12d | 1 | 0.92mi |
| 7109 Conser St Overland Park, KS | 4.0 | 2.0 | 1706 | $2,600 | $1.52 | 7d | 1 | 0.99mi |
| 7329 Ash St Prairie Village, KS | 3.0 | 2.0 | 1400 | $4,750 | $3.39 | 23d | 1 | 1.03mi |
| 7985 Antioch Rd Overland Park, KS | 5.0 | 3.0 | 2196 | $3,000 | $1.37 | 7d | 1 | 1.26mi |
| 8747 Broadmoor St Overland Park, KS | 1.0–3.0 | 1.0–2.5 | 1187 | $1,835 | $1.55 | 23d | 1 | 1.27mi |
| 8712 Marty Ln Overland Park, KS | 5.0 | 2.0 | 2031 | $2,521 | $1.24 | 23d | 1 | 1.27mi |
| 4412 W 77th Pl Prairie Village, KS | 3.0 | 2.5 | 1620 | $2,645 | $1.63 | 21d | 1 | 1.41mi |
Listing history 2 events
-
2026-05-15status Pending
-
2026-05-13$250,000 Active
ⓘ Source: listings_history table (triggers on properties + properties_extension) + one-shot
backfill from property_details.listing_events for pre-trigger history.
Tax reassessment forecast KS · Resets to sale price
- Current annual tax
- $3,791 · $316/mo
- Projected year-2 tax
- $3,791 · $316/mo
- Expected delta
- $0/yr ($0/mo · 0.0%)
ⓘ Screening estimate from a state-policy table — verify with the county assessor before closing.
Climate risk First Street
- Flood 1/10 Low FEMA zone X (unshaded) · 0% chance over 30 yrs
- Wildfire 1/10 Low
- Heat 4/10 Moderate 7 d/yr ≥106°F today · 17 d/yr by 30 yrs out
- Wind 2/10 Low
- Air quality 2/10 Low 2 unhealthy d/yr today · 2 by 30 yrs out
Nearby sold comps map
Loading sold comps map…
Walkable amenities ~0.75 mi
Loading nearby amenities…
Taxation est. · year 1
- Rental income
- $31,327
- − Mortgage interest
- −$14,004
- − Property taxes
- −$3,791
- − Insurance
- −$1,250
- − Repairs & maintenance
- −$2,506
- − Management
- −$2,506
- − Depreciation
- −$7,273
- Taxable loss
- −$3
- Est. tax savings @ 24.0%
- +$1
- After-tax cash flow
- $3,976/yr
For passive investors: Depreciation is non-cash, so a rental often shows a tax loss while cash-flowing — sheltering income. Rental losses are passive: they offset passive income freely, and up to $25,000/yr can offset ordinary (W-2) income if you actively participate and your MAGI is under $100k (phasing out to $0 by $150k); unused losses carry forward. On sale, claimed depreciation is recaptured at up to 25%, and gains may owe capital-gains tax (a 1031 exchange can defer both). Figures are a year-1 estimate at your 24.0% rate — not tax advice; consult a CPA.
Schools (NCES district)
- District
- Shawnee Mission Pub Schools
- NCES district ID
- 2011640
- Math proficiency
- 38% ▼ -6.00%
- Reading proficiency
- 46% ▼ -2.00%
- Median HH income
- $64,923
- Composite
- 37.55/100
- National rank
- #4391
- State rank
- #22 of 169 in KS
Livability — Overland Park
- Score
- 80/100
- State rank
- #16
- US rank
- #1851
Category grades
Schools grade is shown separately in the Schools card above.
Census & demographics
- Census place
- Overland Park, KS
- County
- Johnson County · 574,662 people
- City population
- 180,138
- Metro
- Kansas City, MO-KS
- Population (ZIP)
- 17,948
- Household income
- $75,889
- Rent vs Own
- Severe rent burden
- 935.0
Population outlook (Johnson County) Hauer SSP2
- Today (2025)
- 663,396 people
- By 2030
- 702,585 · +5.9%
- By 2040
- 775,386 · +16.9%
- By 2050
- 841,772 · +26.9%
- By 2075
- 994,137 · +49.9%
- By 2100
- 1,073,036 · +61.7%
Race, ethnicity, and origin ACS 2023
- Neighborhood character
- Predominantly White (71%)
- Race & ethnicity
- White 71% Hispanic / Latino 17% Two or more races 10% Black 7% Asian 1%
- Hispanic origin (detail)
- Mexican 10%
- Common ancestry
- Romanian 2% Serbian 2% Slovak 2%
- Foreign-born
- 9% · Canada
- Languages at home
- 85% English-only · Spanish 11% Other Indo-European 1% Arabic 1%
Political lean MEDSL · Johnson
- 2024 margin
- Lean D (+8.5) · D 53.4% · R 44.9% · Other 1.8%
- 2008→2024 swing
- +17.5pp toward D · 2008: -9.0pp · 2024: 8.5pp
- All cycles
- 2024: D+8.5 2020: D+8.2 2016: R+2.7 2012: R+17.8 2008: R+9.0
Not yet ingested
- Civics
- —
Market trends
- HPI YoY
- ▼ -355.92%
- Current HPI
- 266.5058
- Rent YoY
- ▲ 4.79%
- Metro
- Kansas City, MO-KS
- State GDP YoY
- —
- F500 in state
- 0
Price history
2 events — show timeline
- 2026-05-15 Pending — Heartland MLS as Distributed by MLS Grid
- 2026-05-13 Listed $250,000 Heartland MLS as Distributed by MLS Grid
Property tax history
+5.6%/yrLatest (2025): $3,791 · +10.3% YoY. Source: county tax records.
Cash-flow waterfall
monthlySold comps — $/sqft
last 12 mo · ≤1 miLoading sold comps…