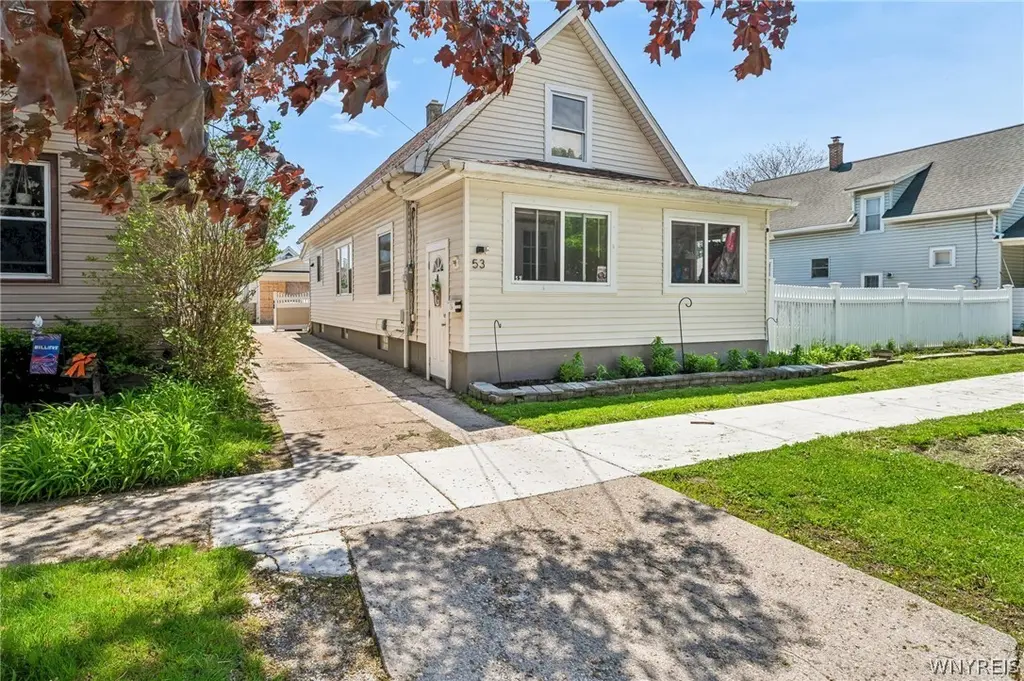
53 2nd Ave · North Tonawanda, NY
Flood risk 4/10 · Minor
- FEMA flood zone
- X (unshaded)
- Chance of flooding over 30 yrs
- 0.22%
- Est. flood insurance / yr
- $473 – $860
Fire risk 3/10 · Minor
- Est. fire insurance / yr
- $691 – $1,283
Heat risk 2/10 · Minimal
- Hot days now (above 94°F)
- 7 days/yr
- Hot days in 30 yrs
- 15 days/yr
Wind risk 1/10 · Minimal
- Chance of severe wind over 30 yrs
- —
Air-quality risk 3/10 · Minor
- Unhealthy air days now
- 3 days/yr
- Unhealthy air days in 30 yrs
- 4 days/yr
Risk factors via First Street. Map © Google.
Why this score? — see what drove the B+ grade
The composite is a weighted blend of 9 inputs, each scored 0–100. Each bar is that input's sub-score; the figure is the points it added to the 100-point composite (weight × sub-score).
- Cash flow +30.0/30.0
- ARV discount +15.0/15.0
- 1% rule +10.0/10.0
- DSCR +10.0/10.0
- Schools +4.2/10.0
- Livability +4.2/5.0
- Rent growth +4.0/5.0
- Condition / age +2.5/5.0
- Appreciation +0.0/10.0
$189,900
🖨 Deal sheet 📄 Offer letter ✓ Due diligence
Listing remarks MLS
TOTAL HOUSE UPDATED, ELECTRIC, FURNACE, ROOF, WINDOWS, FRONT PORCH, KITCHEN, FLOORS, GLASS BLOCK WINDOWS IN BASEMENT, CENTRAL AIR, (SEPARATE BREAKERS FOR GARAGE). LARGE CLOSETS IN ALL BEDROOMS, 2 BEDROOMS UP & 2 BEDROOMS DOWN. SKYLIGHT. VINYL SIDING. NEW 2.5 CAR GARAGE.
Key facts
- Double lot
- Outdoor space
- Above-ground pool
Tags
Property features AI
Exterior
- Parking: Detached garage; Approximately 2.5 garage spaces
- Utilities: Public water (connected); Sewer connected; Cable available; Circuit breaker electric service
- Home design: Single-story home; Resale property
- Construction: Vinyl siding; Copper plumbing; Block foundation; Existing (previously built)
- Exterior features: Concrete driveway; Enclosed porch; Porch; Patio; Fully fenced yard
Interior
- Kitchen: Kitchen island; Gas water heater
- Bedrooms: 2 bedrooms on the main level
- Flooring: Laminate; Vinyl; Varied flooring
- Bathrooms: 1 full bathroom (main level)
- Heating & cooling: Gas forced-air heating; Central air conditioning
- Interior features: Ceiling fan(s); Separate/formal living room; Kitchen island; Bedroom on main level; Full basement with sump pump
- Laundry & utility: Laundry in basement
Neighborhood map
What this means for you Summary
Snapshot
- This is a 4-bed/1.0-bath single-family listed at $190k.
Deal economics
- At list price, monthly cash flow is $1k ($15k/yr) — positive.
- The deal already cash-flows at list — no discount required.
- Meets the 1% rule at list price ($3k rent vs $190k).
- Cap rate 14.1% vs local median 4.0% in North Tonawanda — top-decile yield for the area; either an underpriced asset or a hidden risk that comps aren't pricing in. Stress-test before assuming the spread holds.
Location & tenants
- Location reads 85/100 on livability (#30 in NY, #518 nationally) — a professional / high-income tenant draw. Strengths: commute A+, housing A+, health & safety A+.
- North Tonawanda City School District (suburban): math 42% / reading 57% proficiency, ranked #398 of 590 in NY (top 68%) — families likely to look elsewhere, expect single-tenant / working-renter base with shorter leases.
- Market conditions: Rents rising fast (+6.0%/yr); 178 active listings in the ZIP; 3 comparable units currently listed for rent nearby; rentals leasing fast (median 11d on market — plan ~1-2 weeks tenant-placement turnaround); 167 units permitted in Niagara County in 2024 (0 in 5+ unit buildings).
- At $3,223/mo this rent would consume 52% of the median local household income ($75k/yr) (locally 1303% of renters already pay >50% of income on rent) — very limited rent-growth headroom before tenants either downsize or default.
Forward outlook
- Local home prices are declining (-3.0%/yr); year-one equity from $1k of loan paydown is wiped out by about $6k of value loss. Plan a longer hold.
- Niagara County population projected at -19% by 2050 — secular population decline; favor cash flow + early exit over multi-decade hold.
- At projected returns (-3.0% appreciation + 6.0% rent growth), your $53k cash investment doubles in ~4 years — after that, you're playing with house money.
Negotiation context
- Only 5 days on market — expect competitive offers; lowballing is unlikely to land.
- 3 sale attempts since 16y ago with the ask held roughly flat each time — persistent listings suggest the price (not the market) is what's stuck; bring a comps-based counter.
- Current owner paid $165k; 15% above their basis — modest negotiation headroom, anchor on the comps not their cost.
Risks & watch-outs
- Watch-outs: built in 1928 — expect roof / HVAC / electrical / plumbing capex.
Questions for the listing agent
- Built in 1928 — when were the roof, HVAC, electrical panel, plumbing, and water heater last replaced?
- Is there a deadline driving the sale (1031 exchange, divorce, estate, relocation)? That informs how much negotiation room exists.
- Schools are B-rated — typically a magnet for longer-tenancy family renters. What's the average tenant stay here, and is there a school-zone premium baked into asking?
- What's the average days-on-market for RENTAL listings here right now (not sales)? A rising rental-DOM trend means longer vacancies and softer asking-rent achievability than the comps imply.
- What's the recent tenant-quality profile in this submarket — average credit score on applications, eviction rate, late-payment / NSF rate, and stable-employment percentage? A property-management company in the area should have these aggregated.
- How much new for-sale + rental construction is in the pipeline within 1–3 miles? Heavy new supply typically softens prices + rents 12–24 months out; constrained supply supports both.
Investment metrics
- 1% rule
- 1.70% ✓
- Cap rate
- 14.07%
- Cash-on-cash
- 27.77%
- DSCR
- 2.24
- GRM
- 4.9
CMA / ARV
- ARV (on-the-fly)
- $272,064
- Comps found
- 12
Show comp detail 12 sales within ~0.75 mi
| Address | Dist | Beds/Ba | Sqft | Sold | Price | $/sf | Match |
|---|---|---|---|---|---|---|---|
| 61 5th Ave | 0.16mi | 3/1.0 (-1) | 1,429 (+9%) | 3mo | $215,000 | $150 | 70 |
| 732 Barrally St | 0.53mi | 3/1.0 (-1) | 1,302 (-0%) | 2mo | $280,000 | $215 | 68 |
| 203 Edward St | 0.34mi | 4/1.0 | 1,202 (-8%) | 5mo | $250,000 | $208 | 66 |
| 223 Schenck St | 0.56mi | 3/1.0 (-1) | 1,288 (-2%) | 2mo | $169,400 | $132 | 64 |
| 120 7th Ave | 0.32mi | 3/1.0 (-1) | 1,496 (+14%) | 1mo | $87,500 | $58 | 56 |
| 189 Lincoln Ave | 0.53mi | 3/1.0 (-1) | 1,432 (+10%) | 4mo | $231,080 | $161 | 51 |
| 247 Oliver | 0.58mi | 3/1.0 (-1) | 1,180 (-10%) | 1mo | $135,000 | $114 | 51 |
| 671 Treichler St | 0.54mi | 3/1.5 (-1) | 1,445 (+10%) | 3mo | $300,000 | $208 | 48 |
| 254 Spaulding St | 0.50mi | 3/1.5 (-1) | 1,137 (-13%) | 1mo | $244,000 | $215 | 48 |
| 871 Payne Ave | 0.72mi | 3/1.0 (-1) | 1,144 (-12%) | 0mo | $260,000 | $227 | 40 |
| 286 Bryant St | 0.70mi | 4/1.0 | 1,117 (-15%) | 3mo | $180,500 | $162 | 40 |
| 64 Oakwood Ter | 0.72mi | 3/1.5 (-1) | 1,464 (+12%) | 1mo | $315,000 | $215 | 38 |
Match score weights: distance 35% · size 25% · config 20% · recency 20%. Top-matched comps best support the ARV.
Projected returns pro-forma
-3.0% appreciation · 5.96% rent growth · sell at horizon
- IRR
- 25.2%
- Equity multiple
- 2.08×
- Total profit
- $57,535
- Equity at exit
- $28,315
- IRR
- 34.7%
- Equity multiple
- 4.65×
- Total profit
- $194,318
- Equity at exit
- $16,419
Cash invested: $53,172 (down + closing). Projections, not guarantees.
Landlord ↔ Tenant lean methodology
- Overall (STATE)
- 15 Strongly Tenant-Friendly
- State New York
- 15 Strongly Tenant-Friendly · D+10
- County
- — inherits STATE
- City
- — inherits STATE
ZIP-level market 14120
- Rents YoY
- 6.0%
- Active inventory
- 178
- Price-to-rent
- 4.9×
Monthly cashflow live
- Estimated rent
- $3,223 medium interval (Pro) →
- Mortgage (P&I)
- −$996
- Tax from tax record
- −$240 /mo · $2,885/yr
- Insurance
- −$79
- HOA
- −$0
- Vacancy / Maint / Mgmt
- −$677
- Net cashflow
- $1,231
Break-even live
UW: 25.0% down · 7.5% · 30yr · 1.5% tax · 5.0% vac · 8.0% maint · 8.0% mgmt
Financing live
Cash to close
- Down payment
- $47,475
- Closing costs
- $5,697
- Reserves months
- —
- Total cash needed
- —
Loan-product check · same deal, 3 products live
Conventional
25% down · 7.5% · 30yr
- Down + closing
- —
- Monthly P&I
- —
- Monthly cashflow
- —
- DSCR
- —
- Eligible?
- —
Personal DTI + credit; lowest rate.
DSCR
20% down · 8.5% · 30yr
- Down + closing
- —
- Monthly P&I
- —
- Monthly cashflow
- —
- DSCR
- —
- Eligible?
- —
No personal income docs; deal must DSCR.
Hard money
10% down · 12.0% · 12mo
- Down + closing
- —
- Monthly P&I
- —
- Monthly cashflow
- —
- DSCR
- —
- Eligible?
- —
Short-term bridge; refi at stabilization.
Rent comps 3 comps
| Address | Beds | Baths | Sqft | Rent | $/sqft | DOM | Units | Dist |
|---|---|---|---|---|---|---|---|---|
| 600 River Rd North Tonawanda, NY | 1.0–3.0 | 1.0–2.5 | 1320 | $4,995 | $3.78 | 1d | 12 | 0.28mi |
| 175 12th Ave North Tonawanda, NY | 3.0 | 1.0 | 1000 | $1,600 | $1.60 | 44d | 1 | 0.58mi |
| 757 Remington Dr Unit 1 North Tonawanda, NY | 3.0 | 1.5 | 1100 | $1,750 | $1.59 | 10d | 1 | 1.39mi |
Listing history 8 events
-
2026-05-19$189,900 Active
-
2022-06-13soldstatus $165,000 Closed Sale or Rented
-
2022-04-12historical
-
2022-04-12$165,000
-
2011-08-04soldstatus $78,000 276-char remark
Show marketing remark (276 chars)
TOTAL HOUSE UPDATED, ELECTRIC, FURNACE, ROOF, WINDOWS, FRONT PORCH, KITCHEN, FLOORS, GLASS BLOCK WINDOWS IN BASEMENT, CENTRAL AIR, (SEPARATE BREAKERS FOR GARAGE). LARGE CLOSETS IN ALL BEDROOMS, 2 BEDROOMS UP & 2 BEDROOMS DOWN. SKYLIGHT. VINYL SIDING. NEW 2.5 CAR GARAGE.
-
2011-07-28soldstatus $78,000
-
2010-12-07$86,000 276-char remark
Show marketing remark (276 chars)
TOTAL HOUSE UPDATED, ELECTRIC, FURNACE, ROOF, WINDOWS, FRONT PORCH, KITCHEN, FLOORS, GLASS BLOCK WINDOWS IN BASEMENT, CENTRAL AIR, (SEPARATE BREAKERS FOR GARAGE). LARGE CLOSETS IN ALL BEDROOMS, 2 BEDROOMS UP & 2 BEDROOMS DOWN. SKYLIGHT. VINYL SIDING. NEW 2.5 CAR GARAGE.
-
2001-04-02soldstatus $39,000
ⓘ Source: listings_history table (triggers on properties + properties_extension) + one-shot
backfill from property_details.listing_events for pre-trigger history.
Tax reassessment forecast NY · Partial reset (capped growth)
- Current annual tax
- $2,885 · $240/mo
- Projected year-2 tax
- $3,047 · $254/mo
- Expected delta
- +$162/yr (+$14/mo · 5.6%)
ⓘ Screening estimate from a state-policy table — verify with the county assessor before closing.
Climate risk First Street
- Flood 4/10 Moderate FEMA zone X (unshaded) · 22% chance over 30 yrs
- Wildfire 3/10 Moderate
- Heat 2/10 Low 7 d/yr ≥94°F today · 15 d/yr by 30 yrs out
- Wind 1/10 Low
- Air quality 3/10 Moderate 3 unhealthy d/yr today · 4 by 30 yrs out
Nearby sold comps map
Loading sold comps map…
Walkable amenities ~0.75 mi
Loading nearby amenities…
Taxation est. · year 1
- Rental income
- $38,672
- − Mortgage interest
- −$10,637
- − Property taxes
- −$2,885
- − Insurance
- −$950
- − Repairs & maintenance
- −$3,094
- − Management
- −$3,094
- − Depreciation
- −$5,524
- Taxable income
- $12,489
- Est. tax owed @ 24.0%
- −$2,997
- After-tax cash flow
- $11,769/yr
For passive investors: Depreciation is non-cash, so a rental often shows a tax loss while cash-flowing — sheltering income. Rental losses are passive: they offset passive income freely, and up to $25,000/yr can offset ordinary (W-2) income if you actively participate and your MAGI is under $100k (phasing out to $0 by $150k); unused losses carry forward. On sale, claimed depreciation is recaptured at up to 25%, and gains may owe capital-gains tax (a 1031 exchange can defer both). Figures are a year-1 estimate at your 24.0% rate — not tax advice; consult a CPA.
Schools (NCES district)
- District
- North Tonawanda City School District
- NCES district ID
- 3621240
- Math proficiency
- 42% ▼ -16.00%
- Reading proficiency
- 57% ▲ 4.00%
- Median HH income
- $48,348
- Composite
- 42.15/100
- National rank
- #3301
- State rank
- #398 of 590 in NY
Livability — North Tonawanda
- Score
- 85/100
- State rank
- #30
- US rank
- #518
Category grades
Schools grade is shown separately in the Schools card above.
Census & demographics
- Census place
- North Tonawanda, NY
- County
- Niagara County · 157,377 people
- City population
- 44,241
- Metro
- Buffalo-Cheektowaga, NY
- Population (ZIP)
- 44,241
- Household income
- $74,871
- Rent vs Own
- Severe rent burden
- 1303.0
Population outlook (Niagara County) Hauer SSP2
- Today (2025)
- 204,149 people
- By 2030
- 197,900 · -3.1%
- By 2040
- 182,239 · -10.7%
- By 2050
- 165,198 · -19.1%
- By 2075
- 129,416 · -36.6%
- By 2100
- 96,222 · -52.9%
Race, ethnicity, and origin ACS 2023
- Neighborhood character
- Predominantly White (91%)
- Race & ethnicity
- White 91% Two or more races 4% Hispanic / Latino 3% Black 2%
- Common ancestry
- Romanian 15% Lithuanian 2% Slovak 2%
- Foreign-born
- 4% · Canada, China
- Languages at home
- 95% English-only · Russian/Polish/Slavic 2% Spanish 1% Other Indo-European 1%
Political lean MEDSL · Niagara
- 2024 margin
- R (+14.9) · D 42.5% · R 57.5%
- 2008→2024 swing
- -15.9pp toward R · 2008: 1.0pp · 2024: -14.9pp
- All cycles
- 2024: R+14.9 2020: R+9.7 2016: R+19.0 2012: D+0.6 2008: D+1.0
Not yet ingested
- Civics
- —
Market trends
- HPI YoY
- ▼ -260.39%
- Current HPI
- 303.1744
- Rent YoY
- ▲ 5.96%
- Metro
- Buffalo-Cheektowaga, NY
- State GDP YoY
- ▲ 2.60%
- F500 in state
- 92
Industry mix (Fortune 500 HQ in NY)
| Industry | F500 HQs | Revenue |
|---|---|---|
| Financial Services | 10 | $950B |
|
||
| Consumer Goods | 9 | $162B |
|
||
| Insurance | 4 | $225B |
|
||
| Telecommunications | 2 | $144B |
|
||
| Pharmaceuticals | 2 | $112B |
|
||
| Media / Entertainment | 2 | $69B |
|
||
Price history
+386.9% since first listed8 events — show timeline
- 2026-05-19 Listed $189,900 WNYREIS
- 2022-06-13 Sold (MLS) $165,000 WNYREIS
- 2022-04-12 Listed $165,000 WNYREIS
- 2022-04-12 Listing Removed — WNYREIS
- 2011-08-04 Sold (MLS) $78,000 WNYREIS
- 2011-07-28 Sold (Public Records) $78,000 Public Records
- 2010-12-07 Listed $86,000 WNYREIS
- 2001-04-02 Sold (Public Records) $39,000 Public Records
Property tax history
+2.6%/yrLatest (2025): $2,885 · +2.1% YoY. Source: county tax records.
Cash-flow waterfall
monthlySold comps — $/sqft
last 12 mo · ≤1 miLoading sold comps…